中图分类号: P467;P426.6
文献标识码: A
文章编号: 1000-0690(2015)08-1051-09
通讯作者:
收稿日期: 2014-02-17
修回日期: 2014-05-4
网络出版日期: 2015-08-20
版权声明: 2015 《地理科学》编辑部 本文是开放获取期刊文献,在以下情况下可以自由使用:学术研究、学术交流、科研教学等,但不允许用于商业目的.
基金资助:
作者简介:
作者简介:卢洪健(1985-),男,江西修水人,博士研究生。主要研究方向为干旱影响及风险评估。E-mail:luhj.11b@igsnrr.ac.cn
展开
摘要
基于中国东北地区98个气象站点历史数据和WCRP多模式耦合CMIP3输出的IPCC SRES A1B、A2和B1气候变化情景下的降雨资料,计算3、6、12和24个月尺度上的标准化降水指数(SPI),结合M-K检测、EOF分解和小波分析,研究东北地区干旱的时空变化格局及其对气候变化的响应特征。结果表明:① SPI能较好地检测东北地区干湿变化状况,4个时间尺度上主要的空间模态具相似的分布型,其中12个月尺度SPI显示东北大部分地区在过去50 a干旱程度呈显著加剧、范围有明显扩大的趋势,其中南部和中部辽河流域是干旱严重区;② 干旱时间变化特征具明显的空间差异,南部干旱第一主周期为11 a,北部则为3.5 a;③ 气候变化情景下,2011~2060年的干旱以前30 a趋强,之后趋缓,且干旱高发区存在一定的北移趋势。
关键词:
Abstract
In order to capture the spatiotemporal patterns of drought vulnerability and predict its response characteristics to climate change in Northeast China (NEC), observed precipitation data sets of 98 meteorological stations in 1961-2010 and output datasets of the WCRP coupled multi-model (CMIP3) for IPCC SRES A1B, A2 and B1 climate change scenarios during 2011-2060 were engaged to calculate the commonly used Standardized Precipitation Index, which analyzed with the popular methods of Mann-Kendall detection, Empirical Orthogonal Function and Wavelet transformation. The main results can be concluded as following. Historical drought-wetness evolution in NEC could be properly detected by the SPI series, and drought severity in most areas significantly increased during last 50 years especially on the 12-month timescale. While drought conditions in southern part and Liao River basin in NEC are always most serious, the first four EOF loadings on different time steps show a similar distribution pattern with some local differences. The drought spatial coverage took on an obviously increasing trend accompanied with drastic inter-annual and inter-decadal fluctuations, and the dominant period were differently identified for the south (11a) and the north (3.5 a). Under the three climate change scenarios, the period of the early 30 years would share most of the mega droughts during 2011-2060, and the A2 scenario may own more frequently and severe drought events than others; more importantly, the drought core may migrate northward to some extent.
Keywords:
干旱的发生通常与一个持续时期内降雨总量的减少关系最为密切;同时,高温、强风、低湿以及降雨分布特征在干旱的发生和演化过程中也起着重要作用[1~3]。根据出现时间和影响对象的不同,常将干旱分为气象干旱、水文干旱、农业干旱和社会经济干旱4种类型[1,2]。在20世纪的自然灾害中,旱灾造成的损失影响面最广,通常横跨农业、工商和交通运输等多个部门[3]。近年来,大尺度的严重干旱事件在欧洲、非洲、亚洲、澳大利亚和美洲大陆频繁出现,造成高额的社会经济损失;21世纪气候变化影响下,全球将可能面临干旱频率和强度增加的前景[3,4]。
干旱指数是干旱检测、监测和影响评估不可或缺的基础工具[2,3,5]。近50 a来,基于水分平衡原理(如Palmer Drought Severity Index,PDSI)、概率分布(如Standardized Precipitation Index,SPI)和遥感监测(如Vegetation Condition Index,VCI)等相关指数广泛用于区域干旱评估[6~9]。与PDSI相比,SPI具有计算简洁、空间可比性强、时间尺度可变等优势[8,10],不仅可用于监测短期的大气水分供应,还能应用于监测河川径流、湖水和水库水位等长期水资源的变化。历经20 a来的发展,SPI被广泛应用于干旱气候学、干旱预报和农业干旱风险评价等领域[11~13],特别是继“干旱指数林肯宣言”发表之后[14],SPI更被世界气象组织(WMO)推荐为世界范围通用的气象干旱指标[15];但是,在干旱地区出现较多降雨量为零的情况下应谨慎使用[16]。
中国东北地区(Northeast China, NEC)地处中高纬度及欧亚大陆东端,属温带季风气候区,其夏季雨热同期的特点利于农业生产[17~19]。但该地区水资源主要靠大气降水补给,且降水的时空异质性较大,加上区域经济的快速发展,导致其水资源供需矛盾日益突出[20,21]。自20世纪90年代中期以后,NEC进入降水减少和干旱多发阶段,如历史罕见的1999~2001年持续大旱,严重威胁着区域国民经济的发展[21,22]。近年来,有学者对NEC降水时空变化特征及干旱对气候变暖的响应做了较详尽的研究[17,20]。还有研究表明,蒙古高压增强、副热带高压偏弱以及西风带和西南水汽输送异常减弱是NEC夏旱发生频率高的主要环流背景[22];而且其季节降水和温度具明显的年代际特征,与极端气候事件(如干旱)的发生密切相关[23]。然而,还少有研究从多个时间尺度上分析NEC干旱的时空变化模式和干旱周期性的空间差异,且未来气候情景下其干旱程度的时空分布格局尚存较大的不确定性。因此,本文基于历史实测和GCMs模拟输出的降雨资料,计算4个时间尺度上的SPI,探讨1960~2010年NEC干旱在不同时间尺度上的时空演变模式,并预估其在IPCC SRES A1B、A2和B1气候变化情景下未来50 a内干旱模式的响应特征,以期为该地区水资源的优化配置和未来气候条件下干旱的风险评价提供相关的基础科学依据。
研究区(38°43′N~53°33′N, 117°16′E~135°2′E)包括中国东北辽宁、吉林、黑龙江省和内蒙古东部的赤峰、通辽和呼伦贝尔等地,面积约161.3 ×10⁴km2。该区大部分属温带气候,以松嫩平原为核心,西、北、东三面均环山,成为马蹄形的地貌格局。西北部为大兴安岭的北段,海拔1 000 m左右,东部包括一系列山地,北面的小兴安岭、中间的大黑山、吉林哈达岭、张广才岭、老爷岭、完达山等,以及南面的长白山。地带性植被有大兴安岭北部的寒温带针叶林、东部山地的温带针阔混交林和平原地带的温带半湿润森林草原,主要的土地覆盖类型为林地、旱地、草地和水田,分别约占41.50%、27.78%、18.53%和3.62%。全区多年平均降水量呈东南向西北递减,地表径流量主要取决于降水的时空分布状况,径流深度从东南向西北递减[22~24]。
实测降雨数据由中国气象科学数据共享服务网(http://cdc.cma.gov.cn/)提供,包括98个气象站点1961~2010的逐日降雨,GCMs数据采用国家气候中心(http://ncc.cma.gov.cn/cn/)提供的WCRP耦合模式比较计划-阶段3的(CMIP3)A1B、A2和B1情景下的逐月降水数据[25,26]。为了确保计算结果的可靠与精确,气象站点降水数据经Wijngaard等[27]方法进行检验,所选数据通过95%置信水平的一致性检验。对过去近50 a降雨数据分析表明,NEC的区域平均降水年际变化大,年内分布不均匀,6~8月的降雨量占到全年降雨量的65%以上,但呈显著下降趋势;降水的空间分异性显著,且其变异系数的空间分布也十分不均。
由于降水分布通常为偏态分布而非正态分布,故可以采用Г分布概率函数来描述降水量的变化,再经正态标准化求得SPI值[8,10]。本文采用WMO推荐使用的计算程序[15],以上述处理过的月降雨资料为输入,计算3、6、12和24个月尺度上的SPI,依次记为SPI3、SPI6、SPI12与SPI24,基于SPI的旱涝等级划分见表1[8,10,15]。
表1 SPI指数旱涝等级的划分
Table 1 Drought and wetness categories for SPI
| SPI值 | 等级 | 概率(%) | SPI值 | 等级 | 概率(%) |
|---|---|---|---|---|---|
| ≥2.0 | 极端湿润 | 2.3 | 0.0~ -0.99 | 轻微干旱 | 34.1 |
| 1.5~1.99 | 严重湿润 | 4.4 | -1.00~ -1.49 | 中等干旱 | 9.2 |
| 1.0~1.49 | 中度湿润 | 9.2 | -1.50~ -1.99 | 严重干旱 | 4.4 |
| 0.0~0.99 | 轻微湿润 | 34.1 | ≤-2.0 | 极端干旱 | 2.3 |
Mann-Kendall(M-K)是一种非参数统计检验法,其优点是不需要样本遵从一定的分布和不受少数异常值的干扰,同时可以明确突变开始的时间并指出突变区域。经验正交函数(Empirical Orthogonal Function,EOF)分解是将某气候变量的观测资料以矩阵的形式给出并做自然正交展开,分解为时间函数和空间函数两部分,空间函数部分概括变量的地域分布特点,不随时间而变化;而时间函数部分则由空间点的线性组合所构成,称为主分量,这些主分量的前几个占有原空间点总方差的很大部分。小波分析(Wavelet Analysis, WA)被认为是傅里叶分析法的突破性扩展,它将一个一维信号在时间和频率2个方向上展开,不仅可以给出气候系列变化的尺度,还可以显现出变化的时间位置。
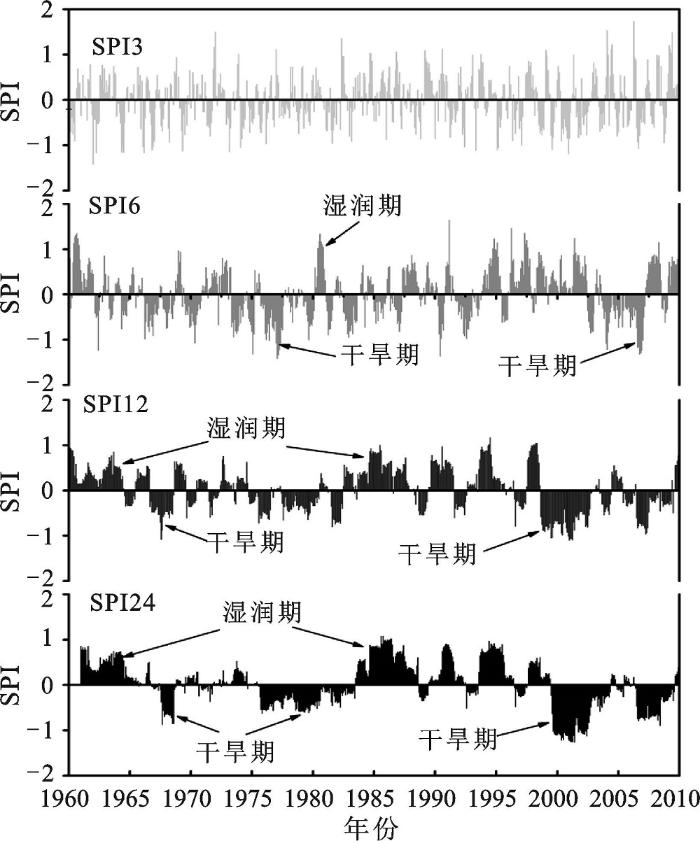
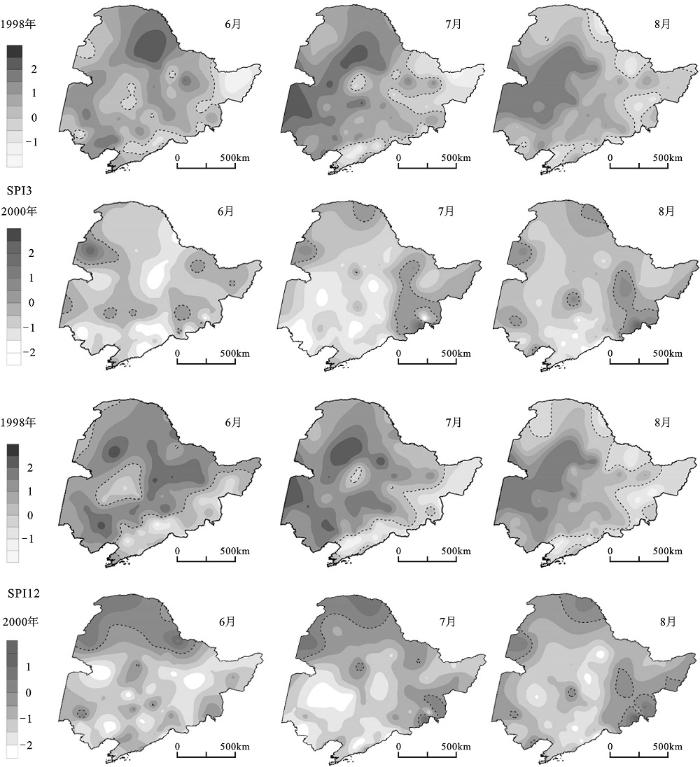
SPI能较好地表征NEC干旱程度与持续时间的变化过程,过去50 a东北地区干旱主要分布在3个时期(图1),即1960s后期、1970s中后期至1980s前期、1990s后期至2000s,以第3个时期最为严重(持续时间长且强度大),这与相关研究结果一致[21,22]。《中国干旱灾害数据集》(http://cdc.cma.gov.cn/)的记录显示,NEC在1965年、1980年、1989年、1993年、1994年和1999年均发生重旱,这与SPI所表征的结果基本吻合。对于典型旱涝年,如1998年松花江流域的特大洪水和2000年的严重干旱,SPI3和SPI12的检测效果均很好(图2)。
图1 1961~2010年区域平均多时间尺度SPI系列
Fig.1 Regional average of SPI series at multi-time scales during 1961-2010
图2 SPI3和SPI12表征的典型年旱涝程度空间分布(虚线为0分界线)
Fig.2 Spatial distributions of drought and wetness severity characterized by SPI3 and SPI12 in typical years
不同的时间尺度上,干旱特征差异十分明显,3个月和6个月时间尺度上,干旱短期波动与季节性变化强,发生频次多但持续时间较短,说明SPI3和SPI6可用于监测短期水分亏缺和季节性农业干旱的发生;SPI12和SPI24具明显的年际与代际变化,干旱发生频次相对少而持续时间更长,对于区域持续性的长期水文干旱事件和河湖、地下水位变化具有一定的指示作用[10,15]。
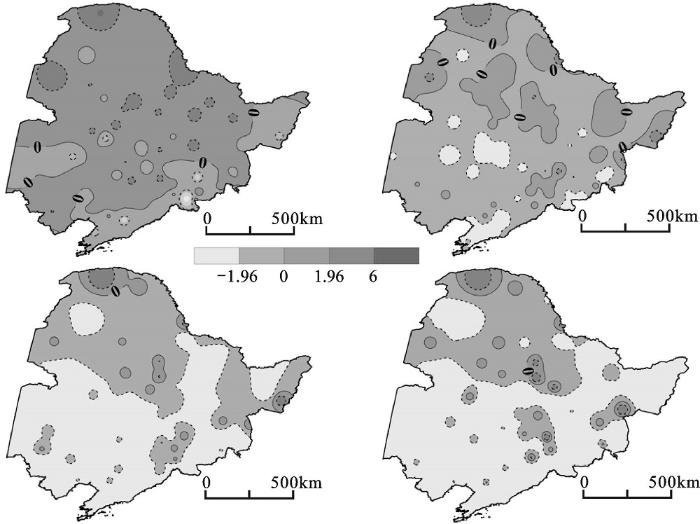
M-K检测结果表明,NEC在3个月和6个月尺度上分别有13和28个站点的干旱程度呈显著加强的趋势,而干旱显著减弱的分别为24个和10个,其余变化不显著;在12个月和24个月尺度上,干旱显著加强的站点数为60个和62个,而显著减弱的仅有7和9个。M-K统计值Z(绝对值大于1.96表示在95%的水平上变化显著)的空间分布如图3所示,干旱显著加强的站点(Z<-1.96)主要分布在NEC的南部和中部地区;而干旱显著减弱的站点主要位于北部和东北部地区。南部大多数站点在各时间尺度上均呈干旱加剧趋势,随着时间尺度的增大,中部和东部的很多站点也呈干旱加剧趋势。虽然整个NEC年降水量下降趋势不明显[20],但其南部大多数地区(尤其是6~8月)降雨变化明显,使得其干旱程度显著增加。
图3 干旱变化趋势空间分布(虚线为0值分界线)
Fig.3 Change trend of drought occurrences detected by the M-K method
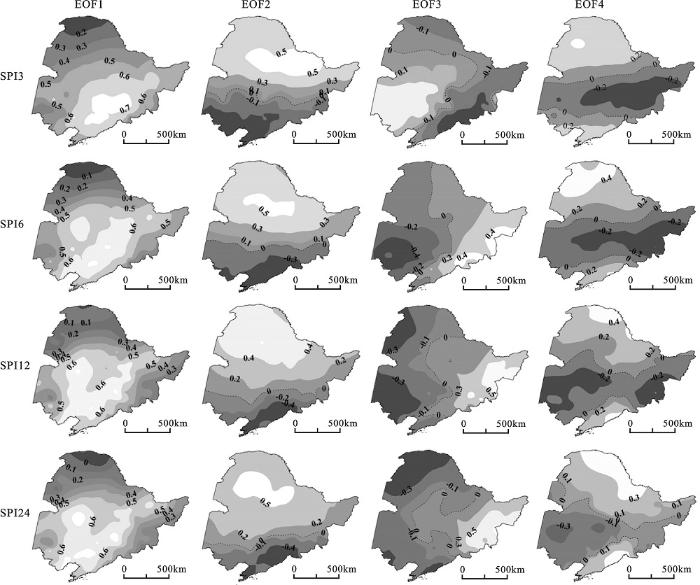
EOF分解4个尺度SPI所得前4个空间模态如图4所示。EOF1解释方差(VAR)约为30%,第一特征向量符号的一致性分布表明NEC过去近50 a干旱发生一致的变化趋势,最严重的地区为南部和中部地区-辽河流域的中心地带。EOF2(VAR约为11%)表征干旱发生的南-北分布型,其特征向量符号分布的差异(0分界线)表明该模式控制下南部干旱变化呈加剧趋势,而北部相对来说为干旱减弱趋势,这除了与南部降水总量显著减少有关之外,还可能受局地降水的年内分配、年际变化以及极端降水事件增加的影响[20,23]。EOF3(VAR约为8%)为东-西分布模式,西部地区干旱比东部严重,这可能是受海陆间的距离和大兴安岭下沉气流的影响;干旱核心区主要分布于辽宁省西北部和内蒙古高原东缘。EOF4(VAR约为5%)表征的干旱空间分布型为中部向两端递减分布型,干旱中心区为吉林省的东部地区。空间分布模式受时间尺度的影响不大,不同时间尺度上各相应模态的空间分布型相同,只有特征向量的值在局部地区存在较小的差异。
图4 EOF分解的4个主要空间模态
Fig.4 Four leading modes of SPI3 and SPI12 derived from EOF analysis
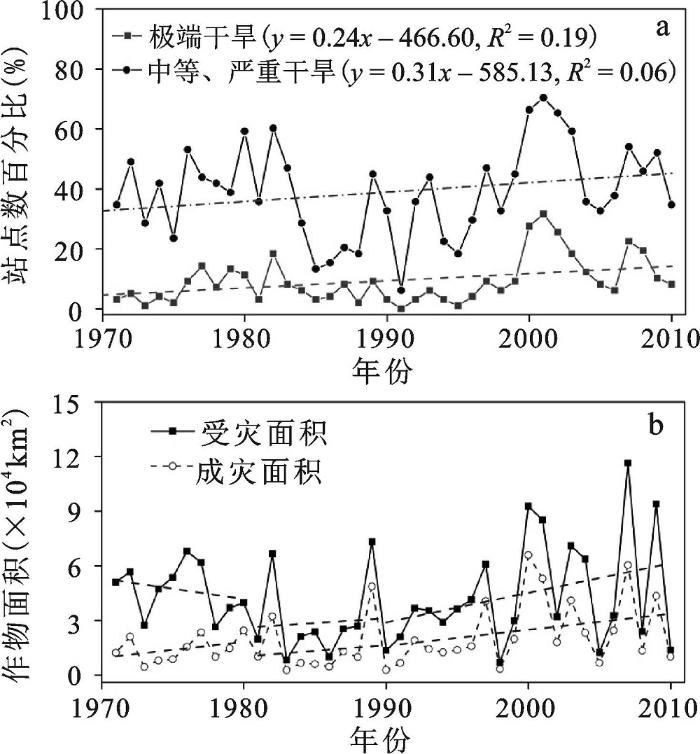
近40 a来NEC发生中等、严重干旱(-2.0<SPI12 <-1.0)和极端干旱(SPI12≤-2.0)站点数百分比的年际变化特征如图5所示,两者均呈较强的年际波动和年代际振荡,且增加趋势显著。同时,东三省过去40 a的农作物干旱受灾面积和成灾面积(资料来源于http://www.moa.gov.cn/)也呈一定的增加趋势,尤其是2000年以后,其增加幅度明显上升。分析表明,其与SPI统计的中等-严重干旱和极端干旱站点数百分比的相关系数分别为0.71和0.60(p<0.01),说明SPI对农业干旱(该地区以雨养农业为主)亦具较好的检测与评估效果。就过去50 a的时间来讲,NEC面临着干旱发生面积增大的威胁,尤以极端干旱的空间范围变化最为明显;近10 a是过去近50 a来干旱最为严重的时期,干旱持续时间延长,发生面积扩大,导致一些大尺度干旱事件的出现(如1999~2001年特大旱)。
对EOF分解SPI12得到的前两个模态的时间系数(PCA1和PCA2,分别代表南部和北部)进行Morlet小波分析,图6为小波变换系数实部在时-频域的分布图,可见两者之间存在较大的差异。PCA1的演变存在12~24 a和2~9 a的周期变化规律,其中,在10~25 a尺度上出现了干旱-湿润交替的准4次震荡;在5~10 a时间尺度上的变化不稳定,自1990 s后进入干旱多发期。PCA2的演变则存在着15~25 a和7~12 a的周期变化规律,小于7 a的干旱周期相对剧烈,但局部差异较大;在20 a左右的尺度上,周期变化具一定的连续性,经历了5个干旱发展-减缓的更替期。对小波方差分析发现,南部最大峰值对应着11 a的时间尺度,说明11 a左右的周期震荡最强,为第一主周期;北部的第一主周期则为3.5 a。
图6 EOF分解时间系数的小波系数实部与方差
注:正负值分别用实线和虚线表示,零值用加粗线表示。
Fig.6 The real part and variance of wavelet transformation for the time coefficients derived from EOF
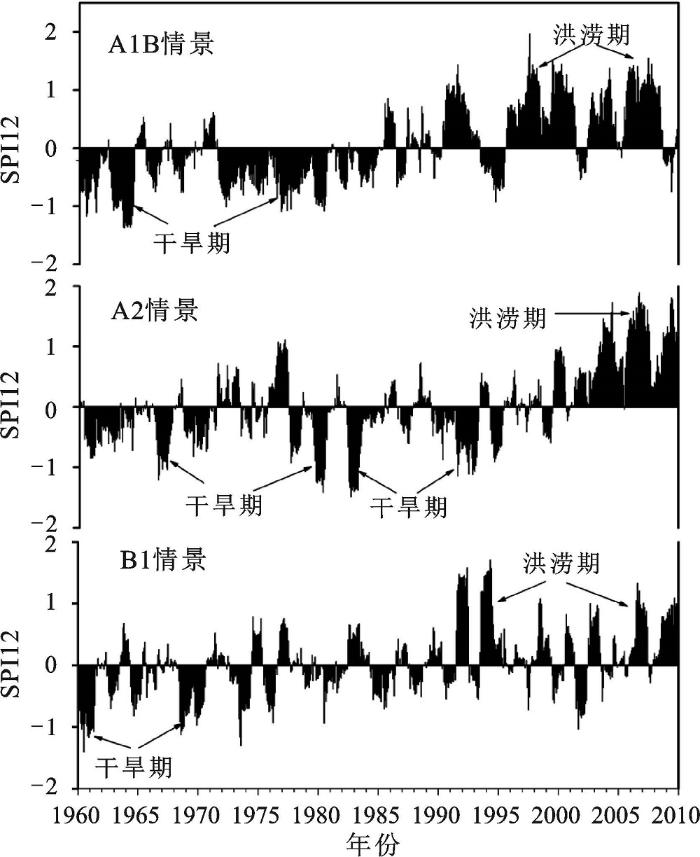
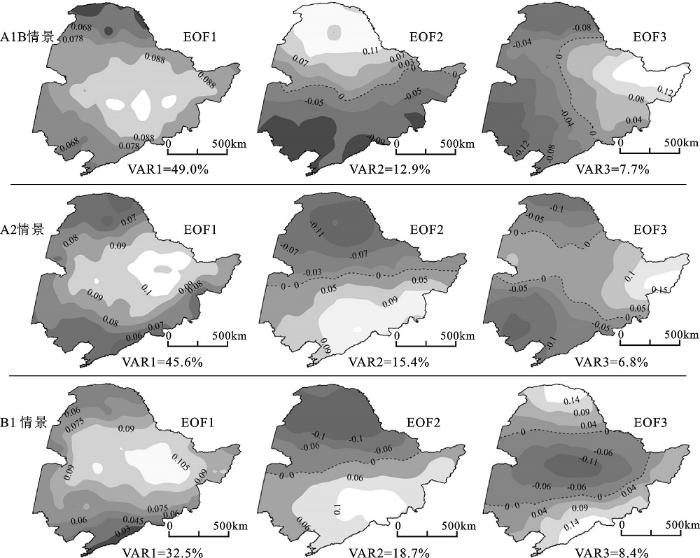
A1B、A2和B1情景下,2011~2060年NEC区域平均SPI12如图7所示,可见2040年之前均为干旱多发期,且以A2和A1B情景的干旱更为严重(强度和持续时间都较大),而A2情景在2040s还存在较长的干旱期,说明未来50 a内NEC干旱的发生以前30 a为主,在干旱规划中应当着重考虑。未来50 a各情景干旱发生的前3个空间分布模态(EOF)如图8所示。EOF1的干旱严重区均位于NEC的中部地区,其特征向量符号的一致性说明各情景存在相同的变化趋势,但不同情景之间也存在较大的局部差异。EOF2均为南-北分布型,但变化特征有显著差异,A1B情景为北强南弱模式,A2和B1情景则与之相反,干旱严重区均位于南部辽宁省地区。
EOF3的分布模式在不同情景下表现出更为明显的差异,A1B情景为典型的东-西分布型,干旱中心区为黑龙江省和吉林省的东部地区,A2情景的中心区域则为NEC的中部地区,南部和北部则为减弱趋势,而B1情景的干旱中心区除了东部的小部分地区外,还包括南部和北部的大部分地区,中部地区反而是干旱减弱区。总的来讲,未来50 a NEC的干旱主要发生在中部地区,但不同情景下干旱的分布范围和空间变异存在较大差异。
图7 气候变化下2011~2060年区域平均SPI12的变化趋势
Fig.7 Evolution of regional average of SPI12 series under climate change during 2011-2060
图8 未来气候变化情景下干旱发生的主要空间分布模态(虚线代表特征向量值为0)
Fig.8 Three primary spatial modes of drought occurrences under different climate change scenarios
干旱的形成和演变是多种因素共同作用的结果,其中气候变化和人类活动两大主导因素构成了干旱演变的驱动力系统,且不同区域的主要驱动因素不同[28]。研究表明,太平洋副热带高压、东亚夏季风环流和厄尔尼诺-南方涛动(ENSO)是NEC干旱发生的主要气候驱动因素,且各因素的作用存在着非常明显的空间差异[22,29]。此外,复杂多变的地理地形、植被条件和社会经济状况使得NEC干旱脆弱性的空间格局更为复杂。
过去近50 a,NEC整体上呈干旱加剧的趋势和南北递减的分布模式,干旱的时间变化特征与降雨模式变化基本一致,而干旱的空间变化模式主要由区域内降水的空间异质性所决定,这与其他研究得出NEC农业可利用水资源呈减少趋势、旱灾呈增加趋势的结论[17,18,22]相一致。更有意义的是,NEC短期干旱(SPI3和SPI6)显著加剧的站点较少而长期干旱(SPI12和SPI24)显著加剧的站点明显增多,说明时间尺度是干旱变化趋势的重要影响因素,针对不同时间尺度的干旱变化特征,制订区域干旱减缓措施,具重要的决策参考价值。
气候变化情景下,就降水亏缺导致的干旱而言,NEC在未来50 a的干旱主要发生在前30 a,以A2情景的干旱最为严重,而且干旱核心区将主要分布于松花江流域南部和辽河流域。在全球变暖的大背景下,水分循环的加速将可能导致未来NEC的降雨总量增加,在一定程度和意义上起着缓解干旱的作用,但降雨集中度和极端降雨事件频率的改变可能会导致新的旱涝格局。基于SPI12的干旱空间分布表明,干旱核心区存在一定的向北移动趋势,局部地区干旱程度将显著变化,因此,水资源管理与规划应对此进行加以考虑。
SPI检测NEC历史干湿变化状况的效果较好,过去近50 a各站点干旱变化趋势受时间尺度的影响很大,12个月尺度上大部分站点干旱显著加剧。NEC南部和中部辽河流域是干旱严重区,但其干旱空间分布模式呈明显的“破碎化”状态。干旱发生范围在明显的年际波动中呈增加趋势;南部和北部干旱周期性的差异较大。未来50 a NEC干旱主要发生在前30 a,且其干旱中心区存在一定的北移趋势。
气候变化往往是降水和温度等气候因素耦合变化的结果。温度对干旱的形成和发展起着重要作用,因此,温度升高与降水变化的叠加效应可能会导致更多极端干旱事件的形成。NEC在过去近50 a温度明显上升,且未来依然存在升温趋势,虽然基于单一降雨变化因素的SPI能较好地揭示NEC干旱的时空分布模式,但忽略温度及相关气候要素对干旱严重程度的贡献,很可能造成对干旱事件(尤其是极端干旱事件)严重程度的低估。因此,采用多个干旱指标并综合考虑温度和降水变化对干旱程度的贡献,才能更好地阐述区域干旱模式对气候变化的响应特征。
致谢:研究使用的全球气候模式气候变化预估数据,由国家气候中心研究人员对数据进行的整理、分析和惠许使用。原始数据由各模式组提供,由WGCM(JSC/CLIVAR Working Group on Coupled Modelling)组织PCMDI(Program for Climate Model Diagnosis and Intercomparison)搜集归类。
The authors have declared that no competing interests exist.
| [1] |
Drought as a natural hazard:Concepts and definitions[A].Wilhite D A.Drought:A Global Assessment [ |
| [2] |
A review of twentieth-century drought indices used in the United States [J]. |
| [3] |
A review of drought concepts [J].https://doi.org/10.1016/j.jhydrol.2010.07.012 URL [本文引用: 4] 摘要
Owing to the rise in water demand and looming climate change, recent years have witnessed much focus on global drought scenarios. As a natural hazard, drought is best characterized by multiple climatological and hydrological parameters. An understanding of the relationships between these two sets of parameters is necessary to develop measures for mitigating the impacts of droughts. Beginning with a discussion of drought definitions, this paper attempts to provide a review of fundamental concepts of drought, classification of droughts, drought indices, historical droughts using paleoclimatic studies, and the relation between droughts and large scale climate indices. Conclusions are drawn where gaps exist and more research needs to be focussed.
|
| [4] |
Drought under global warming:A review [J].https://doi.org/10.1002/wcc.81 URL [本文引用: 1] 摘要
ABSTRACT This article reviews recent literature on drought of the last millennium, followed by an update on global aridity changes from 1950 to 2008. Projected future aridity is presented based on recent studies and our analysis of model simulations. Dry periods lasting for years to decades have occurred many times during the last millennium over, for example, North America, West Africa, and East Asia. These droughts were likely triggered by anomalous tropical sea surface temperatures (SSTs), with La Niña-like SST anomalies leading to drought in North America, and El-Niño-like SSTs causing drought in East China. Over Africa, the southward shift of the warmest SSTs in the Atlantic and warming in the Indian Ocean are responsible for the recent Sahel droughts. Local feedbacks may enhance and prolong drought. Global aridity has increased substantially since the 1970s due to recent drying over Africa, southern Europe, East and South Asia, and eastern Australia. Although El Niño-Southern Oscillation (ENSO), tropical Atlantic SSTs, and Asian monsoons have played a large role in the recent drying, recent warming has increased atmospheric moisture demand and likely altered atmospheric circulation patterns, both contributing to the drying. Climate models project increased aridity in the 21st century over most of Africa, southern Europe and the Middle East, most of the Americas, Australia, and Southeast Asia. Regions like the United States have avoided prolonged droughts during the last 50 years due to natural climate variations, but might see persistent droughts in the next 20–50 years. Future efforts to predict drought will depend on models' ability to predict tropical SSTs. WIREs Clim Change 2011 2 45–65 DOI: 10.1002/wcc.81For further resources related to this article, please visit the WIREs website
|
| [5] |
A review of drought indices [J].https://doi.org/10.1139/a11-013 URL [本文引用: 1] 摘要
Drought is a stochastic natural hazard that is instigated by intense and persistent shortage of precipitation. Following an initial meteorological phenomenon, subsequent impacts are realized on agriculture and hydrology. Among the natural hazards, droughts possess certain unique features; in addition to delayed effects, droughts vary by multiple dynamic dimensions including severity and duration, which in addition to causing a pervasive and subjective network of impacts makes them difficult to characterize. In order manage drought, drought characterization is essential enabling both retrospective analyses (e.g., severity versus impacts analysis) and prospective planning (e.g., risk assessment). The adaptation of a simplified method by drought indices has facilitated drought characterization for various users and entities. More than 100 drought indices have so far been proposed, some of which are operationally used to characterize drought using gridded maps at regional and national levels. These indices correspond to different types of drought, including meteorological, agricultural, and hydrological drought. By quantifying severity levels and declaring drought鈥檚 start and end, drought indices currently aid in a variety of operations including drought early warning and monitoring and contingency planning. Given their variety and ongoing development, it is crucial to provide a comprehensive overview of available drought indices that highlights their difference and examines the trend in their development. This paper reviews 74 operational and proposed drought indices and describes research directions.
|
| [6] |
Challenges in drought research: some perspectives and future directions [J].https://doi.org/10.1080/02626660209493019 URL [本文引用: 1] 摘要
There has been considerable research on modelling various aspects of drought such as identification and prediction of its duration and severity. The term severity has various connotations in drought literature such as in hydrological drought, where it is defined as the cumulative shortage or the deficit sum with reference to a pre-specified truncation level. In meteorological drought, the severity has rather been defined in the form. of indices such as the Palmer drought severity index. There exist a variety of techniques and methods to analyse the duration and severity of meteoro-logical and hydrological droughts through probability characterization of low flows, time series methods, synthetic data generation, theory of runs, multiple regression, group theory, pattern recognition and neural network methods. Agricultural droughts are analysed based on soil moisture modelling concepts with crop yield considerations and using multiple linear regression techniques. The prediction aspects of drought duration are developed better than the drought severity aspects. These latter need to be improved because information on drought severity is of paramount practical impor-tance and forms an essential part of the design process of storage facilities for abatement of droughts. A major challenge of drought research is to develop suitable methods and techniques for forecasting the onset and termination points of droughts. An equally challenging task is the dissemination of drought research results for practical usage and wider applications.
|
| [7] |
East-West Highway,Silver Spring, URL 摘要
Dear Dr. Rowles: Enclosed is an amendment to Permit No. 932-1489-09, for enhancement and research activities on marine mammals. The amendment has been assigned Permit No. 932-1489-10 and the changes to specific Terms and Conditions are reflected in bold font in the attached permit. This permit amendment is effective upon your signature and valid through June 30,2009 or until the new permit (application File No. 932-1905) is issued, whichever comes first. Please note that this permit amendment replaces all previous versions of the permit. Both an original and a "file copy " of the signature page are enclosed with your amended permit. Please sign and date both signature pages where indicated, keeping the original with the permit for your records. You must return the ''file copy " signature page, with your dated signature, to this office as proof of your acceptance of the permit. Please return the signature page marked "file copy " to the Chief, Permits Division (FIPRl), 13 15 East-West Highway, Silver Spring, WID 20910. You may also submit the "file copy " of the signature page by facsimile to 301-427-2521 and confirm it by mail. As the Responsible Party of this amended permit, you are ultimately responsible for all activities
|
| [8] |
|
| [9] |
Droughts of the late 1980s in the United States as derived from NOAA polar-orbiting satellite data [J]. |
| [10] |
Accepting the Standardized Precipitation Index:A calculation algorithm [J].https://doi.org/10.1111/j.1752-1688.1999.tb03592.x URL [本文引用: 4] 摘要
The Palmer Drought Severity Index (PDSI) has been calculated for about 30 years as a means of providing a single measure of meteorological drought severity. It was intended to retrospectively look at wet and dry conditions using water balance techniques. The Standardized Precipitation Index (SPI) is a probability index that was developed to give a better representation of abnormal wetness and dryness than the Palmer indices. Before the user community will accept the SPI as an alternative to the Palmer indices, a standard method must be developed for computing the index. Standardization is necessary so that all users of the index will have a common basis for both spatial and temporal comparison of index values. If different probability distributions and models are used to describe an observed series of precipitation, then different SPI values may be obtained. This article describes the effect on the SPI values computed from different probability models as well as the effects on dry event characteristics. It is concluded that the Pearson Type III distribution is the 鈥渂est鈥 universal model, and that the reliability of the SPI is sample size dependent. It is also concluded that because of data limitations, SPIs with time scales longer than 24 months may be unreliable. An internet link is provided that will allow users to access Fortran 77 source code for calculating the SPI.
|
| [11] |
A drought climatology for Europe [J].https://doi.org/10.1002/joc.846 URL [本文引用: 1] 摘要
We present a high spatial resolution, multi-temporal climatology for the incidence of 20th century European drought. The climatology provides, for a given location or region, the time series of drought strength, the number, the mean duration, and the maximum duration of droughts of a given intensity, and the trend in drought incidence. The drought climatology is based on monthly standardized precipitation indices (SPIs) calculated on a 0.5掳 grid over the European region 35-70 掳N and 35 掳E-10 掳W at time scales of 3, 6, 9, 12, 18, and 24 months for the period 1901-99. The standardized property facilitates the quantitative comparison of drought incidence at different locations and over different time scales. The standardization procedure (probability transformation) has been tested rigorously assuming normal, log-normal, and gamma statistics for precipitation. Near equivalence is demonstrated between the Palmer drought severity index (PDSI) and SPIs on time scales of 9 to 12 months. The mean number and duration by grid cell of extreme European drought events (SPI -2) on a time scale of 12 months is 6 +/- 2 months and 27 +/- 8 months respectively. The mean maximum drought duration is 48 +/- 17 months. Trends in SPI and PDSI values indicate that the proportion of Europe experiencing extreme and/or moderate drought conditions has changed insignificantly during the 20th century. We hope the climatology will provide a useful resource for assessing both the regional vulnerability to drought and the seasonal predictability of the phenomenon.
|
| [12] |
BONACCORSO,et al.Drought forecasting using the Standardized Precipitation Index [J].https://doi.org/10.1007/s11269-006-9062-y URL 摘要
Unlike other natural disasters, drought events evolve slowly in time and their impacts generally span a long period of time. Such features do make possible a more effective drought mitigation of the most adverse effects, provided a timely monitoring of an incoming drought is available. Among the several proposed drought monitoring indices, the Standardized Precipitation Index (SPI) has found widespread application for describing and comparing droughts among different time periods and regions with different climatic conditions. However, limited efforts have been made to analyze the role of the SPI for drought forecasting. The aim of the paper is to provide two methodologies for the seasonal forecasting of SPI, under the hypothesis of uncorrelated and normally distributed monthly precipitation aggregated at various time scales k. In the first methodology, the auto-covariance matrix of SPI values is analytically derived, as a function of the statistics of the underlying monthly precipitation process, in order to compute the transition probabilities from a current drought condition to another in the future. The proposed analytical approach appears particularly valuable from a practical stand point in light of the difficulties of applying a frequency approach due to the limited number of transitions generally observed even on relatively long SPI records. Also, an analysis of the applicability of a Markov chain model has revealed the inadequacy of such an approach, since it leads to significant errors in the transition probability as shown in the paper. In the second methodology, SPI forecasts at a generic time horizon M are analytically determined, in terms of conditional expectation, as a function of past values of monthly precipitation. Forecasting accuracy is estimated through an expression of the Mean Square Error, which allows one to derive confidence intervals of prediction. Validation of the derived expressions is carried out by comparing theoretical forecasts and observed SPI values by means of a moving window technique. Results seem to confirm the reliability of the proposed methodologies, which therefore can find useful application within a drought monitoring system. Copyright Springer Science + Business Media, Inc. 2007
|
| [13] |
Analysis of multidimensional aspects of agricultural droughts in Zimbabwe using the Standardized Precipitation Index(SPI) [J].https://doi.org/10.1007/s00704-010-0262-2 URL [本文引用: 1] 摘要
This study focuses on a framework of methodologies used for analyzing the frequency and spatiotemporal characteristics of agricultural droughts in Zimbabwe from a vulnerability context. By employing an empirical orthogonal analysis method, the study revealed that relatively strong spatial and temporal station drought relationships prevail, making the drought spatiotemporal characteristics of the country to be considered highly homogeneous. Thus, agricultural droughts were characterized temporarily using the Standardized Precipitation Index derived from rainfall data for the longer but sparse data period from 1901 to 2004. At the same time, higher spatial density analysis was achieved from shorter but denser database for the period 1941 to 1999. The results indicated that drought is a natural climatic feature of the region and occurs from time to time in defined periods. However, severe and extreme droughts tend to concentrate near the end of the time series, suggesting that during the earlier period of the twentieth century, droughts have been smaller or less pervasive. The extreme droughts appear to inherit the coincidence of both very high values of spatial extent and intensity in a single event. This offers a possible explanation to why extreme droughts in Zimbabwe usually have dire consequences on agriculture and the national economy. By showing that the related national drought impacts on staple maize food production can be estimated, this study has demonstrated that it is possible to anticipate future drought hazard impacts and predict periods of food insecurity. As far as the forecasting of agricultural droughts is concerned, the recently discovered Indian Ocean dipole/zonal mode seems to perform better than the traditional El Ni帽o鈥揝outhern Oscillation as a potential drought predictor during the twentieth century.
|
| [14] |
The Lincoln Declaration on Drought Indices [J]. |
| [15] |
Standardized Precipitation Index User Guide(M. |
| [16] |
Appropriate application of the Standardized Precipitation Index in arid locations and dry seasons [J].https://doi.org/10.1002/joc.1371 URL [本文引用: 1] 摘要
The Standardized Precipitation Index (SPI) is now widely used throughout the world in both a research and an operational mode. For arid climates, or those with a distinct dry season where zero values are common, the SPI at short time scales is lower bounded, referring to non-normally distributed in this study. In these cases, the SPI is always greater than a certain value and fails to indicate a drought occurrence. The nationwide statistics based on our study suggest that the non-normality rates are closely related to local precipitation climates. In the eastern United States, SPI values at short time scales can be used in drought/flood monitoring and research in any season, while in the western United States, because of its distinct seasonal precipitation distribution, the appropriate usage and interpretation of this index becomes complicated. This would also be the case for all arid climates. From a mathematical point of view, the non-normally distributed SPI is caused by a high probability of no-rain cases represented in the mixed distribution that is employed in the SPI construction. From a statistical point of view, the 2-parameter gamma model used to estimate the precipitation probability density function and the limited sample size in dry areas and times would also reduce the confidence of the SPI values.On the basis of the results identified within this study, we recommend that the SPI user be cautious when applying short-time-scale SPIs in arid climatic regimes, and interpret the SPI values appropriately. In dry climates, the user should focus on the duration of the drought rather than on just its severity. It is also worth noting that the SPI results from a statistical product of the input data. This character makes it difficult to link the SPI data to the physical functioning of the Earth system.
|
| [17] |
东北地区可利用降水资源的初步分析 [J].https://doi.org/10.3878/j.issn.1006-9585.2005.01.14 URL [本文引用: 3] 摘要
利用1961~2002年东北地区80个测站的月降水量和月平均气温资料,采用陆面蒸发经验模型计算得到各测站的月蒸发量,再根据水量平衡关系,得到可利用降水量,以此分析了东北地区大气降水资源的空间分布特征及其变化趋势.结果表明:东北地区可利用降水资源为东多西少分布,东西部区域降水资源差异显著,西部地区可利用降水资源严重匮乏;全区可利用降水资源呈下降趋势,西部半干旱地区在已有水资源严重不足的情况下,可利用降水量仍呈下降趋势,在东部山区其下降趋势最为明显,这将对整个东北地区水资源的开发利用产生不利影响.
|
| [18] |
近50年中国东北地区气候变化对农业的影响 [J].https://doi.org/10.3969/j.issn.1005-9369.2010.09.027 URL [本文引用: 1] 摘要
在回顾中国学者关于东北地区气候变化及对农业影响研究成果基础 上,系统概括分析了近50年东北地区农业气候资源和灾害的变化特征及气候变化对农业的影响特征.近50年东北地区升温明显,生长季热量资源增加;农业可用 水资源和光能资源呈不同程度减少趋势,且时空分布不均.霜冻害、低温冷害、寒潮、洪涝、冰雹等农业气象灾害减少,旱灾增加.东北地区气候变化对农业影响总 体有利,表现为作物适宜生育期延长,发育进程加快,全生育期缩短;积温增加且积温带北移东扩明显,主栽作物适宜种植区域扩大;作物品种由中晚熟替换早中 熟;作物种植格局的变化为玉米、水稻、马铃薯等喜温作物种植面积扩大,春小麦种植面积减小.在水分为非限制因子的农区,作物气候生产潜力和产量为增加趋 势.气候变化对农业影响的研究存在较大的不确定性,有必要针对农业气候变化及其对农业影响等开展系统性研究.
|
| [19] |
中国东北地区夏季降水异常的气候分析 [J].https://doi.org/10.11676/qxxb2000.007 Magsci [本文引用: 1] 摘要
利用中国东北三省69个测站,1961~1995年6~8月降水量资料,采用EOF、REOF、小波分析及突变分析等方法,对夏季降水量的空间异常特征和时间变化规律进行了诊断研究。结果表明:东北地区夏季降水异常的空间分布既有整体一致的性质,也存在着南部和北部及东部和西部相反变化的差异,并且可以把整个东北地区划分为7个主要的降水异常型:辽东半岛型、西部平原型、中南部型、东部山区型、三江平原型、辽西型和东北北部型。近90a来,东北地区夏季降水主要呈多雨、少雨或是波动等阶段性变化,没有明显的变干或是变湿倾向。各异常型代表站资料反映出近35~45a中,东北地区1960年代中期至1980年代初降水的减少比较明显,具有突变性质,1980年代总体上讲降水有一定程度的增加,1990年代处于旱涝交替出现的波动状态。东北地区夏季降水主要有34,22,11a以及2~4a左右的周期变化,但各异常区所盛行的主要周期以及同一异常区在不同年代所盛行的主要周期均有所差异。
|
| [20] |
近50年来东北地区降水的时空分异研究 [J].https://doi.org/10.3969/j.issn.1000-0690.2005.02.007 URL Magsci [本文引用: 4] 摘要
以ARCGIS8.3为关键数 据处理平台,通过编制相关AML程序,对东北地区近50年来(1951-2000年)降水的时空分异特征进行了分析。东北区多年平均降水量为489mm, 从东南向西北递减,多年平均东部区、中部区和西部区的降水分别为635mm,481mm,355mm。整体上看,东北区降水还有显著的周期性,东部区和西 部区的降水周期均为11年,中部为32年。东北区降水整体上呈现下降趋势,但下降趋势不明显。
|
| [21] |
中国东北近50年干旱发展及对全球气候变暖的响应 [J].https://doi.org/10.3321/j.issn:0375-5444.2003.z1.009 URL [本文引用: 3] 摘要
应用实测的降水、气温和土壤湿 度资料,分析我国东北区(含黑龙江、吉林、辽宁三省和内蒙古自治区的东部) 近50年干旱化的发展趋势。结果表明,用月平均气温和降水量的距平和均方差所构造的“大气干旱指数”以及土壤湿度都显示,近50年来整个东北区是向干旱发 展的,1990年代中期以来这种干旱化趋势尤为明显;而东北西部亚干旱地区的干旱化相对更严重(特别是内蒙古东部的北半部)。在亚干旱地区的气温和降水两 个要素中,气温的升高对干旱化的作用可能更重要。在东北区的南部,近50年来的降水是略有增加,但仍有向干旱发展的趋势。这显然与全球气候变暖的大背景有 关。为探讨东北区干旱的发展对全球气候变暖的响应,利用Jones等的1951~2000年全球平均气温资料和东北区25个站的大气干旱指数进行线性回归 分析。结果表明,在全球平均温度上升1 oC的情况下,中国东北区的干旱化程度要增加5~20%,最大的达到22%。这种形势应该引起我们的关注。
|
| [22] |
东北地区干旱强度频率分布特征及其环流背景 [J].https://doi.org/10.3969/j.issn.1004-4574.2009.03.001 URL [本文引用: 6] 摘要
考虑到气候变暖对干旱加剧的可能影响,利用1951-2007年 中国东北地区17站的月降水量和气温资料,定义了表征该地区各站干旱强度的指数.在此基础上分析了干旱强度的周期变化和频率分布特征,以及夏季干旱强度变 化与同期水汽输送异常的联系.结果表明,东北地区干旱强度变化具有显著的2~3年的周期变化.近57年来东北地区的干旱变化经历了4个气候阶段,近期的 1996-2007年是近57年来干旱发生频次最多的时期,平均每年有4.1月会出现不同程度的干旱,发生干旱的频率为34%.东北地区夏季发生干旱的频 率最高,达34.5%, 春季次之,为32.25%, 秋季为27.5%, 冬季发生干旱的频率最小.夏季蒙古高压增强,副热带高压偏弱,位置偏南,同时西风带水汽输送和孟加拉湾西南水汽输送异常减弱,是导致东北地区夏季发生干旱 的主要环流背景.
|
| [23] |
东北气候和生态过渡区近50年来降水和温度概率分布特征变化 [J].https://doi.org/10.3969/j.issn.1000-0690.2005.05.008 URL [本文引用: 2] 摘要
文章从中国160个站的观测资料中选取位于东北气候和生态过渡区内9个测站的冬、夏季降水和温度资料,分析该地区近50年来冬夏季降水和温度的年际变化及其概率分布特征,结果表明,东北气候和生态过渡区的冬夏季降水和温度有明显的年代际变化特征,在不同的年代际变化阶段,降水和温度的总体概率分布特征差异较大,这种概率分布形式的差异与高温、干旱等极端天气气候事件的频繁发生具有密切关系。20世纪80年代以来降水处于平均值减小的总体分布中,温度则处于平均值增加的总体分布中,因此该地区冬季发生暖冬和少雨(雪)的机会增大,夏季出现严重干旱和高温的可能性增大。
|
| [24] |
东北地区玉米干旱时空特征分析 [J].
利用1961-2007年东北地区124个气象站日气象数据,采用彭曼-蒙特斯方程计算参考 蒸散量、作物需水量及玉米水分亏缺指数,按玉米生长的不同发育期确定不同干旱等级玉米水分亏缺干旱指标并计算了干旱频率,并就其时空分布及其年际变化特征 进行分析。结果表明:东北地区玉米生长季内干旱呈现明显的季节性和区域性,干旱发生频率较高的时段主要在苗期生长阶段,其次是灌浆成熟期;玉米苗期、拔节 期、抽雄开花期、灌浆成熟期轻旱以上干旱频率都呈东北向西南逐渐增加的分布趋势,区域性比较明显;辽宁西部和南部、吉林西部和黑龙江西南部地区干旱发生频 率较高,是干旱的主发区,玉米苗期、拔节期、抽雄开花期、灌浆成熟期干旱发生频率分别为 60%-96%,30%-58%,20%-40%,30%-52%,从年代际变化看,20世纪60年代到80年代干旱缓和,从90年代初开始干旱呈增加的 趋势,90年代中期以后干旱增加趋势明显,特别是2000-2004年维持在一个较高的水平。由此可见,东北地区近十年来干旱呈显著增加的趋势,且干旱在 各个发育阶段同时发生。
|
| [25] |
Calculation of average, uncertainty and reliability of regional climate change from AOGCM simulations via the ‘Reliability Ensemble Averaging (REA)’ method. |
| [26] |
Probability of regional climate change based on the Reliability Ensemble Avraging (REA) method. |
| [27] |
KLEIN TANK A M G and KONNEN G P.Homogeneity of 20th century European daily temperature and precipitation series [J].https://doi.org/10.1002/joc.906 URL [本文引用: 1] 摘要
Abstract Daily European station series (1901–99) of surface air temperature and precipitation from the European Climate Assessment dataset are statistically tested with respect to homogeneity. A two-step approach is followed. First, four homogeneity tests are applied to evaluate the daily series. The testing variables used are (1) the annual mean of the diurnal temperature range, (2) the annual mean of the absolute day-to-day differences of the diurnal temperature range and (3) the wet day count (threshold 1 mm). Second, the results of the different tests are condensed into three classes: ‘useful’, ‘doubtful’ and ‘suspect’. A qualitative interpretation of this classification is given, as well as recommendations for the use of these labelled series in trend analysis and variability analysis of weather extremes. In the period 1901–99, 94% of the temperature series and 25% of the precipitation series are labelled ‘doubtful’ or ‘suspect’. In the sub-period 1946–99, 61% of the temperature series and 13% of the precipitation series are assigned to these classes. The seemingly favourable scores for precipitation can be attributed to the high standard deviation of the testing variable, and hence the inherent restricted possibilities for detecting inhomogeneities. About 65% of the statistically detected inhomogeneities in the temperature series labelled ‘doubtful’ or ‘suspect’ in the period 1946–99 can be attributed to observational changes that are documented in the metadata. For precipitation this percentage is 90%. Copyright 08 2003 Royal Meteorological Society
|
| [28] |
干旱演变驱动机制理论框架及其关键问题 [J].
干旱演变驱动机制是科学认识干 旱问题和制定有效防旱抗旱政策的理论基础。针对气象干旱、水文干旱和农业干旱3种干旱类型,分别分析了其形成过程,并阐述了其之间的关系;采用"驱动力- 压力-状态-响应"模式构建了干旱演变驱动机制总体研究框架,并探讨了干旱演变驱动力系统构成、干旱演变驱动机制、变化环境下干旱演变规律及其响应等关键 科学问题。
|
| [29] |
Spatiotemporal variability of drought and the potential climatological driving factors in the Liao River basin [J].https://doi.org/10.1002/hyp.8104 URL [本文引用: 1] 摘要
Abstract Spatiotemporal characteristics of drought based on the Standardized Precipitation Index (SPI) in the Liao River basin (LRB) are investigated in this study. High autocorrelation in SPI seems to lend itself to drought prediction. Drought is becoming more frequent, widespread, and severe in the LRB during the past several decades. Major factors affecting drought in this basin are analysed by investigating relationship between SPI and several circulations including western Pacific Subtropical High (WPSH), East Asian Summer Monsoon (EASM) and El Ni帽o-Southern Oscillation (ENSO) indices. Different correlation patterns between WPSH indices and SPI are obtained. Several significant positive correlations between the area, intensity of WPSH and SPI are observed in the west and the centre of the study area, while negative correlations are observed in the east. Reverse patterns are observed in the correlation between the ridge of westward longitude of WPSH and SPI. Corresponding lag-correlation is dominated by positive correlations between the area, intensity of WPSH and SPI, and by negative correlation between the ridge of westward longitude of WPSH and SPI. EASM is mainly negative related with drought in the east of the LRB. Significant positive correlation between ENSO and SPI is mainly located in the east while negative correlation is located in west of the basin. Lag-correlation (with lags of 1 to 12 months) between them is also investigated and results show that significant negative correlation is located in a broad area extending from the west to the centre of the basin, while less positive correlation is observed with the increase of lags. The possibility of employing general circulation models (GCMs) for drought prediction is discussed based on the above analyses. Copyright 漏 2011 John Wiley & Sons, Ltd.
|

/
| 〈 |
|
〉 |
