王琎 , 吴志峰, 李少英
Wang Jin, Wu Zhifeng, Li Shaoying
中图分类号: X22;F902
文献标识码: A
文章编号: 1000-0690(2016)12-1903-09
通讯作者:
收稿日期: 2016-02-26
修回日期: 2016-05-16
网络出版日期: 2016-12-20
版权声明: 2016 《地理科学》编辑部 本文是开放获取期刊文献,在以下情况下可以自由使用:学术研究、学术交流、科研教学等,但不允许用于商业目的.
基金资助:
作者简介:
作者简介:王琎(1989-),男,湖北武汉人,博士研究生。研究方向:GIS与遥感、环境科学。E-mail: egmontwj@gmail.com
展开
摘要
利用遥感、GIS技术对珠江口湾区1960~2012年海岸线以及海岸带土地利用进行监测,通过定量化、空间化方法监测海岸线和土地利用的时空变化,并分析二者的关系,进而探究珠江口湾区海岸线变迁的原因。研究结果表明,1960~2012年,珠江口湾区海岸线长度由1 134.95 km增至1 508.02 km,在此期间,湾区新增的陆地面积为878.11 km2;从空间上看,广州、珠海及深圳市在珠江口五市中不仅海岸线增长幅度较显著,新增陆地面积也较大; 1960~2012年,珠江口湾区建设用地扩张幅度非常大,增长了33.05倍,城镇建设和农业发展等人类活动是52 a来珠江口湾区海岸线发生显著变化的重要原因。
关键词:
Abstract
Coastline is the sea-land demarcation line in coastal regions. The position and shape of coastline depends on various natural and anthropogenic factors. The change of coastline exerts obvious influence on environment and economy in coastal regions. Therefore, it is important to detect and analysis the change of coastline and landuse for coastal environment and sustainable development. The Pearl River Estuary Gulf (PREG), the core region of Greater Pearl River Delta urban agglomeration, is one of the most prosperous and fastest growing regions in China. The coastline and land use in PREG have changed remarkably and continuously during the past decades. In this research, the change of coastline and land use in 1960-2012 was detected with RS and GIS. Furthermore, coastline characteristics of temporal and spatial variation were analyzed with quantitative and spatial approach. And the relationship between the changes of coastline and land use was explored. Finally, the impact that urban expansion brought to landscape in coastal zone was quantitatively analyzed. 1) In 1960-2012, the length of coastline in PREG increased from 1 134.95 km to 1 508.02 km with annul increasing speed of 7.17 km/a. Relatively, the coastline changed more obvious in three period (2004-2006, 2006-2008 and 2008-2010). The annual average change rate of coastline in the three period were -3.45%, 2.85% and 2.98%, respectively. After 2010, the speed of coastline change in PREG became lower. 2) In 1960-2012, the coastline had a greater increasing amount in the cities of Zhuhai, Guangzhou and Shenzhen, where the length of coastline increased by 60.81%, 22.00% and 19.71%, respectively. 3) In 1960-2012, Nansha in Guangzhou, south Zhuhai and Qianhai in Shenzhen gained more newly-added land than any other area in PREG. Their land area increased from 172.34 km2 to 303.22 km2, 344.70 km2 to 603.29 km2 and 89.62 km2 to 145.49 km2, respectively. 4) In PREG, construction land expanded 33 times in 1960-2012. In the meanwhile, the area of forest and farm land decreased by 47.53% and 56.70%, respectively. 5) In 1960-1979, the total area of newly-added land in PREG was 231.53 km2, where farm land accounted for 61.07%. In 1979-1990, the total area of newly-added land was 224.82 km2, where aquafarm land accounted for 51.44%. From 1990 to 2000, the total area of newly-added land was 321.42 km2, where farm/aquafarm land accounted 61.07%. It can be known that the land demand for agricultural development was the key factor that changed coastline in PREG before 2000. From 2000 to 2012, the total area of newly-added land was 100.34 km2, where construction land accounted for 51.30%. Since 2000, land demand for urban construction has been the key factor that changed coastline in PREG. In conclusion, human activities, including agricultural development and urban construction, largely resulted in the significant change of coastline in PREG.
Keywords:
海岸线是沿海地区的海陆分界线,它的位置与形态决定于地壳运动、河流与海洋沉积物淤积、海洋侵蚀、气候变化等自然因素以及人类社会经济活动。海岸线的改变对潮间带滩涂的面积与资源量、湿地生态系统产生直接影响,进而改变海岸带环境[1,2]。此外,海岸线的变化还会使潮汐河道的性质乃至河口的通航条件产生改变,从而影响地区宏观经济[3,4]。因此,沿海地区的岸线及土地利用的变化监测对于沿海地区的环境保护与可持续发展都具有重要意义[5]。
珠三角地区的海岸线以及沿岸的土地利用近几十年来一直处于显著的变化过程中,传统的地理调查手段难以进行有效监测。与之相比,遥感具有宏观、快速、准确、多时相的优势。因此,2000年以来,一些研究者通过遥感与地理信息系统技术的结合,实现了海岸线变化的定量分析[6-15]。近年来,一些研究深入地分析了不同区域海岸线变化与各种自然、人为因素间的关系[16-22]。然而现有研究中缺乏海岸线与土地利用变迁之间动态关系的分析,大尺度的海岸带研究目前也较少。
本研究以珠江口湾区为研究区,主要通过面向对象和监督分类方法分别监测海岸线和土地利用变化,采用目视解译方法修正监测结果;分析了1960~2012年海岸线的变化特征,进而得到这段时期研究区中的新增陆地。结合新增陆地和土地利用变化的分布对岸线变迁与土地利用之间关系进行分析,进而探究52 a来珠江口湾区海岸线发生显著变化的原因。
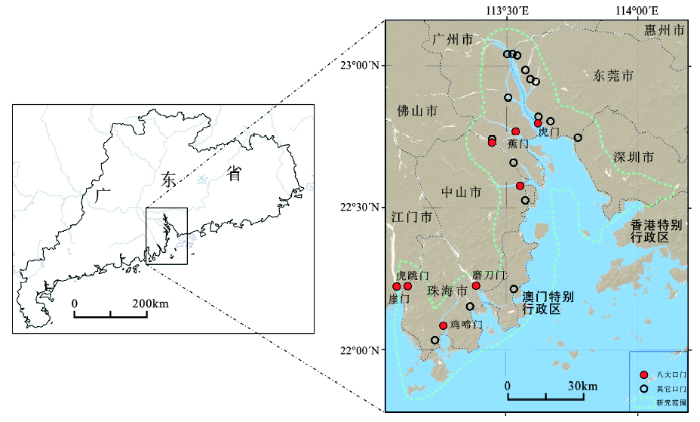
研究区为珠三角五市(广州、东莞、深圳、中山、珠海)海岸线(1960年)为基准的10 km缓冲区,即珠江口湾区。位于21°48′N~23°09′N、 113°09′E~114°37′E之间(图1)。珠江口湾区是大珠三角城镇群的核心空间,区位优越、资源丰富、经济繁荣。改革开放以来,该地区是中国社会、经济发展最快的地区之一。2013年,珠三角9个仅占全国面积0.57%的城市创造了全国9.33%的GDP[23]。
图1 研究区(珠江口湾区)及河口位置
Fig.1 Location of the study area (the Pearl River Estuary Gulf) and river mouth
针对不同年份,本研究分别采用大比例尺地形图、Landsat TM/ETM影像、SPOT影像作为主要数据源(表1),辅助数据源包括数字高程模型数据、实地调查数据、历史数据、行政区划图等,为本研究的监测与验证提供了重要支持。
表1 主要数据源信息
Table 1 Data sources information
| 监测年份 | 主要数据源 | 分辨率(m) |
|---|---|---|
| 1960 | 大比例尺地形图 | / |
| 1979 | Landsat 2 MSS | 78 |
| 1990 | Landsat 5 TM | 30 |
| 1995 | Landsat 5 TM | 30 |
| 2000 | Landsat 5 TM | 30 |
| 2002 | Landsat 5 TM | 30 |
| 2004 | Landsat 7 ETM+ | 30 |
| 2006 | SPOT 5 | 2.5 |
| 2008 | SPOT 5 | 2.5 |
| 2010 | Landsat 7 ETM+ | 30 |
| 2012 | Landsat 7 ETM+ | 30 |
本研究共计使用遥感影像37景,采用FLAASH模型进行辐射校正,尽可能消除传感器测量值与地物反射率之间的差异;本研究对所有遥感影像对照地形图进行几何校正,误差小于一个像元。LANDSAT 7 ETM+传感器故障导致部分 Landsat7 ETM+影像出现条带缝隙,本研究采用多影像局部自适应回归分析模型进行条带修复。
1960年主要数据源为1:50 000地形图,共60幅,测绘年份为1960~1965年。
本研究主要采用面向对象方法提取海岸线。使用面向对象方法进行遥感影像分类时,分类的基本单元不再是像元,而是这些由同质像元聚合而成的多边形或区域,即对象。面向对象方法中的分类依据除了光谱信息以外,还可以包括对象的几何信息(包括形状、大小等)、纹理信息以及对象间的语义信息与拓扑关系、高程信息等等[24]。本研究选用较小尺度进行影像分割,根据影像波段信息和地理特征指标(归一化植被指数NDVI、改进的归一化水平指数MNDWI)进行海陆分类。
本研究采用目视解译、矢量化方法从地形图上提取1960年海岸线。对比1960年地形图与1979年海岸线提取结果,可以发现除广州南沙和珠海南部的沿海区域外,其余地区变化较小。变化较小区域参考1979年海岸线对在1960年的海岸线提取结果进行修正。1960~2012年海岸线变化如图2所示。
图2 1960~2012年珠江口湾区海岸线空间分布
Fig.2 The coastline distribution of the Pearl River Estuary Gulf in 1960-2012
珠江口湾区的海岸以人工海岸为主。对于人工海岸,围垦封闭的区域以最外围为海岸线,围垦尚未封闭的区域按围垦前的原有边界自然延伸,以原有边界及其延伸线为海岸线;珠江口湾区分布较少的自然岸线主要包括基岩海岸、生物海岸及砂质淤泥海岸。基岩海岸由岩石组成,常有突出的海岬和深入陆地的海湾,位于在明显的水陆分界线上。生物海岸以高分影像中可见的海岸植物分布的外边界(靠海洋一侧)的最前沿为海岸线。砂质淤泥海岸主要根据大潮高潮位确定海岸线位置。最后人工修正跨海、河口的桥梁、靠岸船只为水体,筑坝以内的水体区域为陆地,由此得到了1979~2012年珠江口湾区海岸线的分布。此外,本研究还基于潮位、高分影像以及实地调查等数据对海岸线提取结果作进一步优化。
本研究采用目视解译、矢量化方法从地形图上提取1960年海岸线。对比1960年地形图与1979年海岸线提取结果,可以发现除广州南沙和珠海南部的沿海区域外,其余地区变化较小。变化较小区域参考1979年海岸线对在1960年的海岸线提取结果进行修正。
本研究结合研究区内的土地利用特征确定分类体系,包括建设用地、林地、农用地、水体、养殖用地和围垦滩涂6种土地利用类型。1960年地形图较详细地标示了研究区中居民点、耕地、仓库、果林、山地等土地利用或自然地貌类型的位置,本研究对标示位置及其附近区域进行矢量化。通过对比1979年遥感影像可以发现地形图中的空白区域多为人迹罕至的山地,土地利用类型应为林地。1979~2012年遥感影像中,Landsat系列影像的空间分辨率较低而光谱信息较丰富,SPOT 5影像空间分辨率较高而光谱信息相对匮乏。本研究对Landsat MSS/TM/ETM+影像进行监督分类、对SPOT 5影像进行面向对象分类得到1979~2012年土地利用的初步监测结果。针对初步监测结果中农用地与植被二者间、围垦滩涂、沿海养殖与水体三者由于“异物同谱”导致的错分,本研究参考实地调查数据、高分辨率遥感影像进行人工修正。此外,通过人工目视解译方式提取光谱特性较复杂的围垦滩涂。
本研究从研究区中随机选取了400个样点,对照2012年高分辨影像和实地调查结果对每个样点赋予海/陆属性和土地利用属性,分别验证海岸线提取和土地利用监测结果的精度。其中,海/陆属性以及土地利用类型估测正确的样点数分别为379、342,精度分别为94.75%、85.5%,Kappa均高于0.75。
本研究基于珠江口湾区1960年、1979年、1990年、1995年、2000年、2002年、2004年、2006年、2008年、2010年以及2012年共11期监测结果,分析海岸线及土地利用的时空变化特征并探讨二者关系。
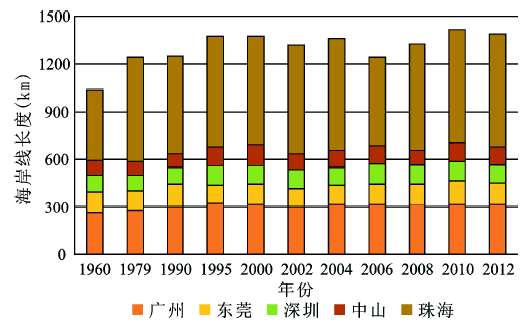
提取结果显示,自1960~2012年,珠江口湾区海岸线由1 134.95 km增至1 508.02 km,年均增速为7.17 km/a(图3)。海岸线变化最显著的时期为2004~2006年、2006~2008年以及2008~2010年3个时间段,年均变化率分别为-3.45%、2.85%以及2.98%。珠海市、广州市以及深圳市在珠江口五市中海岸线的增长幅度较显著,增长率分别为60.81%、22.00%以及19.71%。2004~2010年,珠江口湾区海岸线的年均变化率达3%左右,是变化最显著的时期(表2)。其次为1990~1995年、2000~2002年,年均变化率分别为2.01%、-1.93%。1960~1979年、2002~2004年以及2010~2012年,海岸线长度也产生了较明显的变化,年均变化率分别为0.90%、1.51%以及-1.19%。其余时间段海岸线长度变化不明显。
图3 1960~2012年珠江口湾区海岸线长度
Fig.3 The length of coastline of the Pearl River Estuary Gulf in 1960-2012
表2 海岸线长度年均变化率统计表
Table 2 The average annual change rate of coastline length
| 广州 | 东莞 | 深圳 | 中山 | 珠海 | 总计 | |
|---|---|---|---|---|---|---|
| 1960~1979年 | 0.29% | -0.58% | 0.02% | -0.24% | 2.10% | 0.90% |
| 1979~1990年 | 0.63% | 1.60% | 0.23% | -0.16% | -0.55% | 0.05% |
| 1990~1995年 | 1.80% | -4.43% | 3.23% | 5.59% | 2.47% | 2.01% |
| 1995~2000年 | -0.39% | 2.10% | -0.71% | 2.31% | -0.48% | -0.06% |
| 2000~2002年 | -2.94% | -4.41% | -0.79% | -9.20% | -0.06% | -1.93% |
| 2002~2004年 | 3.21% | -0.54% | -0.09% | 0.68% | 1.78% | 1.51% |
| 2004~2006年 | -0.44% | 4.08% | 7.53% | 1.71% | -11.06% | -3.45% |
| 2006~2008年 | -0.80% | 2.34% | -2.18% | -10.72% | 9.69% | 2.85% |
| 2008~2010年 | 0.79% | 5.11% | -0.25% | 12.94% | 3.36% | 2.98% |
| 2010~2012年 | 0.54% | -5.58% | -2.52% | -2.67% | -0.37% | -1.19% |
2012年广州市海岸线长度为318.14 km,较1960年增长22.00%,增长率在珠江口湾区五市中仅次于珠海。52 a间,海岸线变化最显著的时期为2000~2002年以及2002~2004年,年均变化率分别为-2.94%、3.21%。龙穴岛和万顷沙在这段时期内急剧扩张,使南沙地区的海岸线产生了明显变化。此外,1990~1995年变化幅度也较大,年均变化率达1.80%。
1960~2012年,深圳市海岸线从100.72 km增至120.58 km,较1960年增长19.71%。1995年以前,深圳市海岸线持续增加,其中1990~1995年间年均增长率达3.32%。1995年后,持续多年的填海造地工程使深圳蛇口半岛以及福田沿海地区原本蜿蜒曲折的自然岸线变为平坦笔直的人工岸线,海岸线长度因此持续下降(2004~2006年除外)。2004~2006年,大铲湾码头的建设使海岸线猛增6.65 km,全市年均增长率高达7.53%。
2012年中山市海岸线长度为108.97 km,与1960年相比增长幅度14.90%。2000~2002年、2006~2008年以及2008~2010年海岸线的长度变化都非常显著,年均变化率分别为-9.20%、-10.72%以及12.94%,全市海岸线变化最明显的区域是横门滩。
与珠江口湾区其余四市不同,东莞市海岸线的长度在1960~2012年不增反减,从136.67 km减少至130.25 km。原因是东莞市海岸线改变最大的区域位于长安镇交椅湾,多年来的围垦养殖填海使陆地不断向海洋延伸,海湾的曲折程度大为减少。
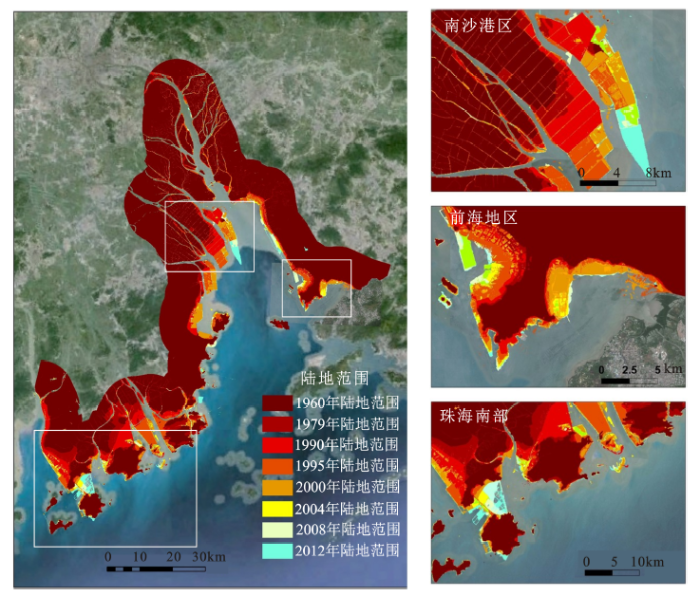
基于1960~2012年珠江口湾区的海岸线,本研究进一步提取了该区域的海陆分布及其变化(图4)。结果显示,珠江口湾区的南部是新增陆地最显著的地区,以珠海南部沿海地区和深圳前海地区为代表。2012年,上述两地区陆地面积分别为603.29 km2、145.49 km2,较1960年分别增长75.02%、62.34%。在此过程中,珠海的三灶岛在20世纪80年代,高栏岛于2008年前后相继与陆地相连。深圳的蛇口半岛的陆地面积在1979年以后几乎增加了2倍,蛇口半岛在各方向上均明显扩展,从细长型变为近似菱形,土地面积得到了极大的增加。除珠海南部、深圳前海以外,广州南沙港区的陆地面积也在迅速扩张,从172.34 km2增至303.22 km2。龙穴岛在1960年面积仅有0.66 km2,2012年全岛陆地面积达52.91 km2。与此同时,万顷沙的新增陆地面积为64.52 km2,平均每年增加1.24 km2。
图4 1960~2012年珠江口湾区陆地范围变化
Fig.4 Terrestrial change in the Pearl River Estuary Gulf in 1960-2012
2.2.1 土地利用变化总体分析
监测并分析了珠江口湾区自1960~2012年的土地利用状况(表3,图5)。可以得到如下结论:① 建设用地总体的增长趋势非常显著,52 a间扩张了33.05倍。其中,1960~1990年期间年增幅相对较低,年均增长率为6.08%。1990~1995年建设用地增长幅度惊人,年均增长率达到了22.61%,在此期间,珠江口湾区的代表城市——广州和深圳的GDP年均增速分别为31.60%、37.39%。1995年后建设用地仍保持较快增长,年变化率为4.24%;② 农用地分布的减少趋势显著。1960~2012年,珠江口湾区农用地的总面积每年下降1.60%。1979~1990年,农用地分布减少速度较快,年均下降3.82%。1990~2004年农用地的分布保持稳定,年变化率0.18%。2004年后,农用地分布面积以-6.56%的年变化率迅速减少,直至2012年。③ 林地在1990~1995年经历了总面积的大幅下降,年均变化率高达-12.56%。在1960~1990年、1995~2012年2个时期内林地分布面积保持稳定。④ 养殖用地的分布面积在1979~1995年,从几乎为零增长到648.06 km2,此后保持在一定范围内波动;围垦滩涂在1990年前几乎没有分布。随着填海活动的加强,围垦滩涂的面积有所增长,2000年达到108.59 km2。
表3 1960~2012年珠江口湾区近岸土地利用面积统计表(km2)
Table 3 The area of different land use types in 1960-2012(km2)
| 建设用地 | 林地 | 农用地 | 养殖用地 | 围垦滩涂 | |
|---|---|---|---|---|---|
| 1960年 | 54.84 | 1128.48 | 1710.43 | 0.00 | 0.00 |
| 1979年 | 45.49 | 1116.94 | 1908.43 | 0.00 | 0.00 |
| 1990年 | 322.63 | 1279.63 | 1243.27 | 344.42 | 10.79 |
| 1995年 | 893.99 | 654.02 | 1200.42 | 627.06 | 54.15 |
| 2000年 | 1041.82 | 613.54 | 1296.30 | 469.87 | 108.69 |
| 2002年 | 1096.81 | 647.67 | 1142.54 | 635.99 | 85.60 |
| 2004年 | 1254.71 | 706.71 | 1274.38 | 307.52 | 39.95 |
| 2006年 | 1321.38 | 797.45 | 1044.28 | 400.40 | 62.91 |
| 2008年 | 1456.48 | 607.72 | 922.07 | 481.35 | 36.82 |
| 2010年 | 1609.29 | 636.54 | 815.39 | 427.93 | 86.38 |
| 2012年 | 1812.33 | 592.16 | 740.58 | 530.53 | 37.63 |
图5 1960~2012年珠江口湾区土地利用变化
Fig.5 Land use change in the Pearl River Estuary Gulf in 1960-2012
2.2.2 土地利用与海岸线变迁的动态关系
1960年以来,珠江口湾区的海岸线持续向海洋方向推进。1960~2010年,珠江口湾区陆地面积由2 893.75 km2增至3 771.87 km2,年均新增陆地17.56 km2(图4)。为分析土地利用状况对海岸线变化所产生的影响,本研究提取并统计了1979年、1990年、2000年和2010年珠江口湾区新增陆地的土地利用情况(表4)。
表4 新增陆地土地利用状况统计表(km2)
Table 4 Land use state in newly-added land (km2)
| 1960~1979年 | 1979~1990年 | 1990~2000年 | 2000~2010年 | |
|---|---|---|---|---|
| 建设用地 | 3.35 | 7.73 | 55.89 | 51.47 |
| 林地 | 86.78 | 27.94 | 4.51 | 0.65 |
| 农用地 | 141.40 | 62.93 | 67.97 | 4.73 |
| 养殖用地 | 0.00 | 115.64 | 99.15 | 16.86 |
| 围垦滩涂 | 0.00 | 10.58 | 93.90 | 26.63 |
| 新增陆地总面积 | 231.53 | 224.82 | 321.42 | 100.34 |
由上表可知,1960~1979年,珠江口湾区新增陆地面积231.53 km2,其中农用地占61.07%,显示这一时期农业发展是导致海岸线变化的首要原因。1979~1990年新增陆地面积为224.82 km2,年均扩张速度大大高于前一个时期。新增陆地面积中养殖用地的面积为115.64 km2,所占比例为51.44%。此外,在围填海的过程中,农用地的面积同样有了明显扩张,达62.93 km2,不过扩张速度比1979年以前略有下降。
1990~2000年是近50 a来陆地向海洋扩张最快的一段时期,新增陆地面积达321.42 km2。其中占地面积最大的2种土地利用类型是养殖用地和围垦滩涂,分别为99.15 km2、93.90 km2。值得注意的是,沿海新增陆地中建设用地的分布规模有了明显扩大,达55.89 km2。2000年以后,沿海新增陆地规模大大低于前3个时期,仅为100.34
综上所述,自1960~2012年,珠江口湾区累计新增陆地面积为878.11 km2。2000年前,珠江口湾区的新增陆地主要服务于农业发展,2000年以后,城镇建设成为了陆地扩张的主要原因。以上基于土地利用的海岸线变迁研究显示,人类活动是海岸线变化的重要因素。
改革开放以后,伴随着经济的持续高速发展,湾区的海岸地貌景观也发生了显著变化,包括海岸线的增长、海域的减少和建设用地的快速扩张等等。深圳的前海地区是珠江口湾区中的典型区域。1979年7月,中国第一个对外开放的工业区——蛇口工业区建立于前海地区,该地区遂成为改革开放的窗口。2015年4月21日,中国(广东)自由贸易试验区正式挂牌,前海为自贸区三大片区之一,被定位为中国金融业对外开放试验示范窗口、世界服务贸易重要基地和国际性枢纽港。与经济发展的可观前景形成鲜明对比,深圳市土地资源日益紧缺。深圳市域总面积仅有1 993 km2,相当于广州的1/4、北京的1/8。2010年深圳市平均人口密度为全省最高,达13 290人/km²,是位居第二的东莞市的3倍[25],因此深圳市,尤其是前海这样的热点地区多年来城市用地的需求非常高。过去50 a来大规模的填海活动已经使前海地区的陆地面积从89.68 km²(1960年)增长至145.49 km²(2012年),蜿蜒曲折的自然岸线也随之变为平坦笔直的人工岸线。值得注意的是,这些新增的陆地在2004年以后几乎完全转化为建设用地,而其他填海活跃的地区如广州南沙、珠海南部直至2012年仍有养殖用地分布,可以在相当程度上为未来城市建设用地的扩张提供空间。据南方日报2016年3月3日报道,深圳市委书记马兴瑞表示将填海55 km²,增加土地供应以应对持续高涨的房价。作为中国红树林分布的集中区域和珍稀鸟类与海洋生物的栖息地,前海地区同样也是研究珠江口湾区海岸环境的“窗口”。在发展经济与保障民生的双重压力下,未来深圳市沿海地区的环境问题值得更深入的研究与思考。
利用遥感、GIS技术对珠江口湾区1960~2012年海岸线以及海岸带土地利用进行监测,通过定量化、空间化方法监测海岸线和土地利用的时空变化,并分析二者的关系,进而探究珠江口湾区海岸线变迁的原因。主要结论如下:
1) 对于珠江口湾区这种地貌景观变化显著区域,遥感和GIS技术提供了实用、经济的监测方法,并且能达到较高精度。
2) 从时间上来看,珠江口湾区海岸线在2004~2010年变化最显著,从空间上来看,珠海、广州以及深圳三市海岸线变化最显著。
3) 1960~2012年,珠江口湾区新增陆地规模非常大,农业发展和城镇建设等人类活动是珠江口湾区海岸线发生显著变化的重要原因。
The authors have declared that no competing interests exist.
| [1] |
基于遥感测量的海岸线变化与分析 [J].https://doi.org/10.3876/j.issn.1000-1980.2012.02.019 URL [本文引用: 1] 摘要
采用较高分辨率的卫星影像,对影像的空间数据进行挖掘,解译出不同时期的海岸线;在盐城沿海 选择12个断面,定量地获取海岸线信息,计算海岸的淤蚀形态和速率变化;分析典型岸段人类活动对海岸线变化的影响.分析结果表明:在人类活动影响下研究区 域海岸线形态平直化程度加剧,2007—2009年海岸线平直情况突出,长度缩短近40km;2009—2010年海岸线平直化有所减缓.盐城海岸线年平 均淤长速率在44~100m.射阳河口北部海岸线变化很小,南部淤长比较明显(其中水龙港—川东港口海岸年淤长速率达到278m).
Analysis of coastline change based on remote sensing measurement .https://doi.org/10.3876/j.issn.1000-1980.2012.02.019 URL [本文引用: 1] 摘要
采用较高分辨率的卫星影像,对影像的空间数据进行挖掘,解译出不同时期的海岸线;在盐城沿海 选择12个断面,定量地获取海岸线信息,计算海岸的淤蚀形态和速率变化;分析典型岸段人类活动对海岸线变化的影响.分析结果表明:在人类活动影响下研究区 域海岸线形态平直化程度加剧,2007—2009年海岸线平直情况突出,长度缩短近40km;2009—2010年海岸线平直化有所减缓.盐城海岸线年平 均淤长速率在44~100m.射阳河口北部海岸线变化很小,南部淤长比较明显(其中水龙港—川东港口海岸年淤长速率达到278m).
|
| [2] |
2000-2012年中国北方海岸线时空变化分析 [J].https://doi.org/10.11821/xb201305007 URL [本文引用: 1] 摘要
利用遥感和GIS技术获取了中国北方"三省一市"2000年、2005年、2008年、2010年、2011年与2012年共6期大陆海岸线的时空分布情况;采用网格法计算了各个时期海岸线的分形维数;分析了海岸线时空变化特征、海岸线长度变化与分形维数变化之间的关系,以及海岸线动态变化的原因。2000-2012年,研究区海岸线长度持续增加,总共增加了637.95km,年均增加53.16km。从区域上看,以天津市与河北省所在的渤海湾区域海岸线变化最强烈;从时间过程上看,2008年后海岸线长度进入快速增长时期,其中2010-2011年是海岸线长度变化最剧烈的时期,变化强度为2.49%。2000-2012年研究区海岸线的分形维数不断增大,其中渤海湾区域海岸线分形维数变化最剧烈;历史海岸线的长度与分形维数之间存在较好的线性关系,相关系数为0.9962;通过对大量海岸线动态引起的整体海岸线长度变化与分形维数变化的统计分析研究表明,在大多数情况下,局部海岸线长度增大(或缩减)会导致整体海岸线分形维数增大(或减小),并且呈正比例变化。从2000-2012年各时段海岸线动态对应的各类沿海工程的面积汇总情况来看,港口建设、渔业设施建设以及盐场建设分别占前三位,人类工程建设是中国北方海岸线变化最主要原因;与人类活动影响相比,自然变化如河口淤积与侵蚀对海岸线影响比较小。
Spatial-temporal analysis of coastline changes in northern China from 2000 to 2012 .https://doi.org/10.11821/xb201305007 URL [本文引用: 1] 摘要
利用遥感和GIS技术获取了中国北方"三省一市"2000年、2005年、2008年、2010年、2011年与2012年共6期大陆海岸线的时空分布情况;采用网格法计算了各个时期海岸线的分形维数;分析了海岸线时空变化特征、海岸线长度变化与分形维数变化之间的关系,以及海岸线动态变化的原因。2000-2012年,研究区海岸线长度持续增加,总共增加了637.95km,年均增加53.16km。从区域上看,以天津市与河北省所在的渤海湾区域海岸线变化最强烈;从时间过程上看,2008年后海岸线长度进入快速增长时期,其中2010-2011年是海岸线长度变化最剧烈的时期,变化强度为2.49%。2000-2012年研究区海岸线的分形维数不断增大,其中渤海湾区域海岸线分形维数变化最剧烈;历史海岸线的长度与分形维数之间存在较好的线性关系,相关系数为0.9962;通过对大量海岸线动态引起的整体海岸线长度变化与分形维数变化的统计分析研究表明,在大多数情况下,局部海岸线长度增大(或缩减)会导致整体海岸线分形维数增大(或减小),并且呈正比例变化。从2000-2012年各时段海岸线动态对应的各类沿海工程的面积汇总情况来看,港口建设、渔业设施建设以及盐场建设分别占前三位,人类工程建设是中国北方海岸线变化最主要原因;与人类活动影响相比,自然变化如河口淤积与侵蚀对海岸线影响比较小。
|
| [3] |
珠江口海岸线变化的遥感监测 [J].https://doi.org/10.3969/j.issn.1007-6336.2002.02.005 URL [本文引用: 1] 摘要
珠江口、香港及澳门地区海岸线的变化近十几年来十分迅速,采用常 规方法及时、定量地测量这种变化十分困难.本研究应用多时相Landsat卫星遥感图像,采用神经网络分类方法,监测海岸线的变化并计算增长的陆地面积. 结果表明,人为的围海造田,香港、澳门机场及相关高速公路、港口等设施的建设是海岸线变化的最主要原因.
Remote sensing monitoring of coastline changes in Pearl River Estuary .https://doi.org/10.3969/j.issn.1007-6336.2002.02.005 URL [本文引用: 1] 摘要
珠江口、香港及澳门地区海岸线的变化近十几年来十分迅速,采用常 规方法及时、定量地测量这种变化十分困难.本研究应用多时相Landsat卫星遥感图像,采用神经网络分类方法,监测海岸线的变化并计算增长的陆地面积. 结果表明,人为的围海造田,香港、澳门机场及相关高速公路、港口等设施的建设是海岸线变化的最主要原因.
|
| [4] |
渤海湾西岸近百年来海岸线变迁遥感分析 [J].https://doi.org/10.3969/j.issn.1001-070X.2003.04.014 URL [本文引用: 1] 摘要
渤海湾是中国典型的淤泥质海岸带,应用不同时期的历史资料、地形图、航空照片及多时相的MSS、TM、ETM遥感数据,经计算机处理,进行信息增强及信息复合,提取了百年来海岸线变化信息,划分为侵蚀、淤积和稳定不同类型岸段,表明渤海湾西岸泥质海岸带近百年来已发生了"缓变型地质环境变化"中的"相对快速的变化"。
A remote sensing analysis of coastline changes along the bohai bay muddy coast in the past 130 years .https://doi.org/10.3969/j.issn.1001-070X.2003.04.014 URL [本文引用: 1] 摘要
渤海湾是中国典型的淤泥质海岸带,应用不同时期的历史资料、地形图、航空照片及多时相的MSS、TM、ETM遥感数据,经计算机处理,进行信息增强及信息复合,提取了百年来海岸线变化信息,划分为侵蚀、淤积和稳定不同类型岸段,表明渤海湾西岸泥质海岸带近百年来已发生了"缓变型地质环境变化"中的"相对快速的变化"。
|
| [5] |
Monitoring of Caspian Sea coastline changes using object-oriented techniques [J]. |
| [6] |
江苏海岸侵蚀过程及其趋势 [J].https://doi.org/10.3321/j.issn:1000-0585.2002.04.009 URL [本文引用: 1] 摘要
江苏省侵蚀海岸的总长度为 30 1 7km ,分为 4段 :废黄河三角洲海岸、港海岸、吕四海岸以及海州湾的沙质海岸。各段海岸侵蚀原因不同。废黄河三角洲海岸是因黄河改道失去泥沙来源 ;吕四与港海岸则因辐射沙洲调整过程中滨岸水道的向岸移动造成的 ;而北部沙岸则是因人类活动 (上游建设水库及开挖海滩沙 )的干扰。江苏海岸是一个沉积物准封闭系统 ,全球性海平面上升将加剧这一侵蚀过程 ,预计未来侵蚀海岸的长度将增加 ,辐射沙洲区的外围沙洲将因侵蚀而向中心区退缩。一些目前是隐型侵蚀的岸段将向显性侵蚀的阶段发展。由于连云港到长江口北支的岸段是软性海岸 ,缺乏硬质节点 ,在没有建造大型人工设施的前提下 ,估计江苏海岸动态及制定开发规划时必须考虑平直化的大趋势。
The mechanism and trend of coastal erosion of Jiangsu Province in China .https://doi.org/10.3321/j.issn:1000-0585.2002.04.009 URL [本文引用: 1] 摘要
江苏省侵蚀海岸的总长度为 30 1 7km ,分为 4段 :废黄河三角洲海岸、港海岸、吕四海岸以及海州湾的沙质海岸。各段海岸侵蚀原因不同。废黄河三角洲海岸是因黄河改道失去泥沙来源 ;吕四与港海岸则因辐射沙洲调整过程中滨岸水道的向岸移动造成的 ;而北部沙岸则是因人类活动 (上游建设水库及开挖海滩沙 )的干扰。江苏海岸是一个沉积物准封闭系统 ,全球性海平面上升将加剧这一侵蚀过程 ,预计未来侵蚀海岸的长度将增加 ,辐射沙洲区的外围沙洲将因侵蚀而向中心区退缩。一些目前是隐型侵蚀的岸段将向显性侵蚀的阶段发展。由于连云港到长江口北支的岸段是软性海岸 ,缺乏硬质节点 ,在没有建造大型人工设施的前提下 ,估计江苏海岸动态及制定开发规划时必须考虑平直化的大趋势。
|
| [7] |
Coastline extraction from SAR images and a method for the evaluation of the coastline precision [J].https://doi.org/10.1016/j.patrec.2004.05.022 URL 摘要
ABSTRACT The coast area is a vital and highly dynamic environment whose multiple geophysical parameters are worth monitoring. At present the current coastline extraction operations made through high-resolution aerial images consist of the visual photo-interpretation. This performance, which mainly finds cartographic applications, is rather slow in comparison to the possibilities of remote sensing and image processing techniques.The aim of this paper is to describe the development and testing of an innovative algorithm able to extract semi-automatically the coastline by means of remote sensed images.The approach proposed is based on fuzzy connectivity concepts and takes into account the coherence measure extracted from an InSAR (Interferometric Synthetic Aperture Radar) couple. The method combines uniformity features and the averaged image that represents a simple way of facing textural characteristics. The results are then quantitatively evaluated through the comparison with optical aerial images. An automatic procedure is proposed for the evaluation of results, which makes use of distance measurements between the satellite and the aerial result, even though there is a considerable difference in space resolution.
|
| [8] |
黄河三角洲海岸线遥感动态监测 [J].https://doi.org/10.3969/j.issn.1560-8999.2004.01.021 URL 摘要
黄河三角洲是世界上海岸线变迁最快的地区之一.遥感与GIS技术 相结合,能准确及时地监测黄河三角洲海岸线的动态演变.本文以1976年以来多时相遥感影像为主要数据源,通过几何精校正与配准,形成统一投影与坐标体系 的遥感影像,运用平均高潮线法,对20景时间序列影像经分类处理后提取海岸线;另经GIS叠加分析,剖析了现行黄河河口、钓口河口地区海岸线的演变过程及 其规律.
Dynamic monitoring of coastline in the Yellow River Delta by remote sensing .https://doi.org/10.3969/j.issn.1560-8999.2004.01.021 URL 摘要
黄河三角洲是世界上海岸线变迁最快的地区之一.遥感与GIS技术 相结合,能准确及时地监测黄河三角洲海岸线的动态演变.本文以1976年以来多时相遥感影像为主要数据源,通过几何精校正与配准,形成统一投影与坐标体系 的遥感影像,运用平均高潮线法,对20景时间序列影像经分类处理后提取海岸线;另经GIS叠加分析,剖析了现行黄河河口、钓口河口地区海岸线的演变过程及 其规律.
|
| [9] |
厦门岛及其邻域海岸线变化的遥感动态监测 [J].https://doi.org/10.3969/j.issn.1004-0323.2005.04.005 URL 摘要
利用美国Landsat TM/ETM+卫星影像,分1989、1995和2000年3个时相,研究了福建省厦门市从1989~2000年的岸线变化情况.岸线变化的信息主要通过变化检测和信息提取等一系列遥感技术来获得.研究结果表明,厦门市在所研究的1989~2000年期间,海域面积共减少了7.54 km2,这主要是由于城市用地扩展和养殖业发展占用了海域的面积.分时段研究表明,从1995~2000年,海域减少的面积明显要比1989~1995年期间来的多,这从一个侧面反映了厦门在1995~2000年间,城市建设和经济发展对土地提出了更高的需求.
Dynamic monitoring of the shoreline changes in Xiamen island with its surrounding areas of SE China using remote sensing technology .https://doi.org/10.3969/j.issn.1004-0323.2005.04.005 URL 摘要
利用美国Landsat TM/ETM+卫星影像,分1989、1995和2000年3个时相,研究了福建省厦门市从1989~2000年的岸线变化情况.岸线变化的信息主要通过变化检测和信息提取等一系列遥感技术来获得.研究结果表明,厦门市在所研究的1989~2000年期间,海域面积共减少了7.54 km2,这主要是由于城市用地扩展和养殖业发展占用了海域的面积.分时段研究表明,从1995~2000年,海域减少的面积明显要比1989~1995年期间来的多,这从一个侧面反映了厦门在1995~2000年间,城市建设和经济发展对土地提出了更高的需求.
|
| [10] |
Coastline change detection with satellite remote sensing for environmental management of the Pearl River Estuary, China [J].https://doi.org/10.1016/j.jmarsys.2010.02.005 URL 摘要
The Pearl River delta area in Guangdong Province has one of the highest economic development rates of China. Rapid industrialization and urbanization has resulted in extensive changes in land use, including the construction of harbours and embankments. The lack of sustainable coastal zone management has caused severe environmental problems, such as land subsidence, intrusion of sea water, siltation of river channels and coastal erosion. For the analysis of the changes of the coastlines, multi-temporal Landsat images and a SPOT scene have been used, in combination with topographical and nautical data. From the change analysis, it can be concluded that the largest variations in the position of the coastline over time occurred in the Nansha Development Zone, situated in the Northern part of Lingdingyang bay. Sedimentation and land reclamation was responsible for the growth of the islands in the period 1960 to 2000, which however decreased slightly in the years after. Various large changes occurred also in the East of the bay along the coast of Shekou peninsula, caused by extensive harbour construction and growth of polder systems. Based on the research of the coastline change in recent decades, suspended sediment plume distribution and its sedimentation, it is suggested that the western part of the waterway in the estuary may not be suitable for large number of construction for harbours, due to the sedimentation and fill up. One of the most important impacts of the coastline changes in the Pearl River Estuary is the narrowing down and extension of river channel which results in more floods in the upper part of the river.
|
| [11] |
Coastline change of the Yellow River estuary and its response to the sediment and runoff (1976-2005) [J].https://doi.org/10.1016/j.geomorph.2010.12.001 URL 摘要
ABSTRACT The dramatic decreases in runoff and sediment have great impacts on erosion–deposition variation in the Yellow River estuary. This study extracted mean high tide lines of the Yellow River estuary from MSS, TM and ETM+ data from 1976 to 2005, and explored relationships between the accretion–erosion of land and the runoff and sediment load of the Yellow River. The results showed that the general pattern of accretion–erosion of the entire estuary was divided into four stages: rapid accretion stage (1976–1986), accretion–erosion adjustment stage (1986–1996), slow erosion stage (1996–2003), and slow accretion stage (2003–present). For maintaining the annual balance of the entire estuary (1976–2005) and Q8 estuary (most recent course of the Qingshuigou estuary from 1996 to 2005), critical annual runoff and sediment load are 140.36 × 10⁸ m3 year61 1 and 3.31 × 10⁸ t year61 1, and 85.0 × 10⁸ m3 year61 1 and 1.63 × 10⁸ t year61 1, respectively. In the future decades, the Q8 estuary is likely to maintain its shape and area balance or have a little accretion, but the entire estuary could be in an eroding state.
|
| [12] |
Monitoring coastline change in the Red River Delta using remotely sensed data [J].https://doi.org/10.15625/1859-3097/13/2/3518 URL 摘要
ABSTRACT This study focuses on the use of remotely sensed data for monitoring coastline changes in the Red River Delta during the 1998 to 2008 period. For the satellite image data processing, the shoreline was defined as the mean sea level on the muddy coast where the tide is the dominant dynamic factor and as the mean high sea level on the sandy coast where the ocean waves are the dominant dynamic factor. A GIS approach was used for the quantitative analysis of coastline change. It was observed that the coastline change in the Red River Delta underwent complicated changes during this 10 year period. In this period, the accretion rate in Red River Delta coastal area was about 10,256ha and the erosion rate was about 542ha. In the Hai Hau and Hau Loc coastal areas, erosion occurred in a large scale and was very intense. Along other coastlines of the Red River Delta, sediment accretion dominated at rates of over 30m/year. These zones of varying erosion and accretion have important implications for coastal zone management in the Red River Delta region.
|
| [13] |
Hoitink A et al. Morphological change in the Pearl River Delta, China [J].https://doi.org/10.1016/j.margeo.2015.02.012 URL 摘要
Abstract Morphological changes in the Pearl River Delta (PRD) have been investigated using bathymetric charts, underwater Digital Elevation Models, remote sensing data and Geographic Information Systems. Water depths were extracted from digitized charts to explore the accretion-erosion characteristics of three estuarine environments, and to provide quantitative estimates of changes in sediment volumes. Multi-temporal satellite images have been used, in combination with topographical data, to analyze the coastline changes. The PRD has gained an abundant amount of sediment by almost 9.45 脳 105 km3 above the 10-m isobath in the same period; the average sedimentation rate was 3.15 脳 104 km3/yr. The coastline extended seaward by 579.2 m in total, with a mean net extension rate of 19.3 m/yr for the period from 1976 to 2006. The results suggest that the PRD experienced a major accretion with net erosion in some local zones. Coastline extension, associated with major morphological changes, has accelerated in recent decades. Changes in boundary conditions, such as sea-level rise, seem to have relatively minor impacts on the dramatic changes in the morphology of the estuary. The changes of the coastlines show an increasing trend whereas the changes of the sediment supply from the delta display a decreasing trend. The opposing trends imply that there should be other external factors contributing to the morphological changes. A detailed comparative analysis demonstrates that land reclamation in the PRD is the most significant factor that progressively alters the estuarine hydrodynamic and coastlines within this region.
|
| [14] |
1990年以来中国大陆海岸线稳定性研究 [J].URL 摘要
海岸线变迁是一个动态的演变过程,它是自然与人类共同作用的结果。基于1990年、2000年、2007年和2012年4个时期的资源卫星、Landsat系列卫星的遥感影像,采用色差Canny算子计算方法提取岸线数据,计算近22 a来中国大陆海岸线向海推进或向陆后退的空间位置变化量及年均变化速度,研究中国大陆海岸线空间位置与稳定性的演变规律,得出以下结论:1中国海岸线空间位置变化以向海推进为主;2中国海岸线多为相对稳定海岸线,其次为强烈岸进岸线,稳定性岸线全国均有分布,而强烈岸进岸线多分布于江苏和辽宁两省;3自1990年以来,中国大陆岸线的稳定性指数逐渐降低,22 a下降了1.1,以长江入海口为分界,南方沿海城市岸线稳定性指数高于北方。
Stability of continental coastline in China since 1990 .URL 摘要
海岸线变迁是一个动态的演变过程,它是自然与人类共同作用的结果。基于1990年、2000年、2007年和2012年4个时期的资源卫星、Landsat系列卫星的遥感影像,采用色差Canny算子计算方法提取岸线数据,计算近22 a来中国大陆海岸线向海推进或向陆后退的空间位置变化量及年均变化速度,研究中国大陆海岸线空间位置与稳定性的演变规律,得出以下结论:1中国海岸线空间位置变化以向海推进为主;2中国海岸线多为相对稳定海岸线,其次为强烈岸进岸线,稳定性岸线全国均有分布,而强烈岸进岸线多分布于江苏和辽宁两省;3自1990年以来,中国大陆岸线的稳定性指数逐渐降低,22 a下降了1.1,以长江入海口为分界,南方沿海城市岸线稳定性指数高于北方。
|
| [15] |
Monitoring the coastline change of Hatiya Island in Bangladesh using remote sensing techniques [J].https://doi.org/10.1016/j.isprsjprs.2014.12.009 URL [本文引用: 1] 摘要
Abstract A large percentage of the world鈥檚 population is concentrated along the coastal zones. These environmentally sensitive areas are under intense pressure from natural processes such as erosion, accretion and natural disasters as well as anthropogenic processes such as urban growth, resource development and pollution. These threats have made the coastal zone a priority for coastline monitoring programs and sustainable coastal management. This research utilizes integrated techniques of remote sensing and geographic information system (GIS) to monitor coastline changes from 1989 to 2010 at Hatiya Island, Bangladesh. In this study, satellite images from Thematic Mapper (TM) and Enhanced Thematic Mapper (ETM) were used to quantify the spatio-temporal changes that took place in the coastal zone of Hatiya Island during the specified period. The modified normalized difference water index (MNDWI) algorithm was applied to TM (1989 and 2010) and ETM (2000) images to discriminate the land鈥搘ater interface and the on-screen digitizing approach was used over the MNDWI images of 1989, 2000 and 2010 for coastline extraction. Afterwards, the extent of changes in the coastline was estimated through overlaying the digitized maps of Hatiya Island of all three years. Coastline positions were highlighted to infer the erosion/accretion sectors along the coast, and the coastline changes were calculated. The results showed that erosion was severe in the northern and western parts of the island, whereas the southern and eastern parts of the island gained land through sedimentation. Over the study period (1989鈥2010), this offshore island witnessed the erosion of 6476 hectares. In contrast it experienced an accretion of 9916 hectares. These erosion and accretion processes played an active role in the changes of coastline during the study period.
|
| [16] |
辽宁省海岸线时空变化及驱动因素分析 [J].
借助遥感与GIS技术,以10期MSS、TM、ETM和CBERS影像为数据源,通过人机交互式解译方式提取海岸线,并将定量分析与定性分析结合,建立海岸线与自然、经济和社会因素的灰色关联模型,探究海岸线变化的驱动因素.研究表明:1978-2008年,辽宁省海岸线呈现快速缩短、缓慢缩短和稳定变化3个阶段,海岸线长度变化最大的是大连市,淤泥质海岸是海岸线变化最显著的地带.海岸线变化是自然、经济和社会诸因素综合作用的结果,驱动因素在空间上存在分异.
Spatial-temporal change of coastline in Liaoning Province and its driving factor analysis .
借助遥感与GIS技术,以10期MSS、TM、ETM和CBERS影像为数据源,通过人机交互式解译方式提取海岸线,并将定量分析与定性分析结合,建立海岸线与自然、经济和社会因素的灰色关联模型,探究海岸线变化的驱动因素.研究表明:1978-2008年,辽宁省海岸线呈现快速缩短、缓慢缩短和稳定变化3个阶段,海岸线长度变化最大的是大连市,淤泥质海岸是海岸线变化最显著的地带.海岸线变化是自然、经济和社会诸因素综合作用的结果,驱动因素在空间上存在分异.
|
| [17] |
Resilience assessment on coastline changes and urban settlements: A case study in Seribu Islands, Indonesia [J].https://doi.org/10.1016/j.ocecoaman.2010.12.003 URL 摘要
From the data analysis results, it is found that the urban settlement in Seribu Islands is one of the resilient factors in addition to the geological and geomorphological conditions. The resilience factors in Seribu Islands are classified into four categories: 1) settlements area, 2) population density, 3) hard infrastructure such as airfields, ports and roads, 4) geological process such as abrasion and erosion. Based on the island characteristics of Seribu Islands, a unique vulnerability index that fits to this locality is developed. It is shown that the vulnerability index developed in this study can measure the resilience of Seribu Islands. In addition to the aforementioned resilience factors, the unique geographical condition and the geological stability in Seribu Islands made the outer islands become a barrier from oceanographic conditions and made the inner islands protected. However, the population growth made significant changes in terms of ecology, water, sanitation and pollution within the region.
|
| [18] |
渤海湾西北岸1974-2010年逐年填海造陆进程分析 [J].URL 摘要
自20世纪70年代以来,渤海湾西北岸陆续实施了大量填海工程,形成了目前中国最大的人工填海造陆区,有必要对其进行精确和连续的监测与分析。以1974~2010年逐年MSS/TM/ETM影像为主要数据源,利用RS/GIS技术,分析了研究区填海造陆的动态空间分布和数量变化特性。36 a间,研究区共填海901.7 km2,主要在滩涂和近海进行,海岸线长度从1974年的224.9 km增长到2010年的536.7 km,填海区的重心总体上从东北向西南方向迁移了26.3 km。将研究期细分为5个阶段进行深入分析发现:研究区海岸线长度增量与填海造陆规模呈正相关关系;填海利用方式经历了盐田为主→盐田和水产养殖相结合→港口和临港工业为主的发展历程;以天津港和曹妃甸港及各自的临港工业区为填海造陆中心和副中心的格局已经形成。
Annual processes of land reclamation from the sea along the northwest coast of Bohai Bay during 1974 to 2010 .URL 摘要
自20世纪70年代以来,渤海湾西北岸陆续实施了大量填海工程,形成了目前中国最大的人工填海造陆区,有必要对其进行精确和连续的监测与分析。以1974~2010年逐年MSS/TM/ETM影像为主要数据源,利用RS/GIS技术,分析了研究区填海造陆的动态空间分布和数量变化特性。36 a间,研究区共填海901.7 km2,主要在滩涂和近海进行,海岸线长度从1974年的224.9 km增长到2010年的536.7 km,填海区的重心总体上从东北向西南方向迁移了26.3 km。将研究期细分为5个阶段进行深入分析发现:研究区海岸线长度增量与填海造陆规模呈正相关关系;填海利用方式经历了盐田为主→盐田和水产养殖相结合→港口和临港工业为主的发展历程;以天津港和曹妃甸港及各自的临港工业区为填海造陆中心和副中心的格局已经形成。
|
| [19] |
Progress in coupling models of human and coastal landscape change [J].https://doi.org/10.1016/j.cageo.2011.10.010 URL 摘要
Abstract Humans are increasingly altering the Earth’s surface, and affecting processes that shape and reshape landscapes. In many cases, humans are reacting to landscape-change processes that represent natural hazards. Thus, the landscape is reacting to humans who are reacting to the landscape. When the timescales for landscape change are comparable to those of human dynamics, human and ‘natural’ components of developed environments are dynamically coupled—necessitating coupling models of human and physical/biological processes to study either environmental change or human responses. Here we focus on a case study coupling models of coastal economics and physical coastline change. In this modeling, coastline change results from patterns of wave-driven sediment transport and sea-level rise, and shoreline stabilization decisions are based on the benefits of wide beaches (capitalized into property values) balanced against the costs of stabilization. This interdisciplinary modeling highlights points that may apply to other coupled human/natural systems. First, climate change, by accelerating the rates of landscape change, tends to strengthen the coupling with human dynamics. In our case study, both increasing sea-level-rise rates and changing storm patterns tend to increase shoreline change rates, which can induce more vigorous shoreline stabilization efforts. However, property values can fall dramatically as erosion rates and stabilization costs rise, which can also lead to the abandonment of expensive stabilization methods as shoreline change rates increase. Second, socio-economic change can also strengthen the human/landscape coupling. Changing costs of shoreline stabilization can alter stabilization decisions, which in turn alters patterns of coastline change. The coupled modeling illuminates the long-range effects of localized shoreline stabilization efforts; communities arrayed along a coastline are unwittingly affecting each other’s erosion rates, and therefore each other’s economies. Our coupled modeling experiments show that spatial distributions of property values and erosion rates can jointly affect economic outcomes, resource allocation between communities, and patterns of shoreline change. These findings raise questions about coastal management strategies, and efficient and equitable allocation of scarce resources among coastal communities.
|
| [20] |
2000-2010年渤海湾岸线变迁及驱动力分析 [J].URL 摘要
利用多期遥感数据,以2年为时间步长提取了2000-2010年间各时期渤海湾海岸线空间位置、长度以及结构信息。通过空间分析,以岸线长度和陆域面积增长为数量指标对海岸线的时空变迁过程进行了定量反演,并进行了驱动力和影响分析。研究表明,研究期渤海湾岸线变化显著,岸线总长度增长了约427km,几乎全部为人工岸线,自然岸线变化微弱。由岸线变迁所造成的陆域面积增长达到937km2。海岸线变迁的主要驱动力表现为前期的围垦养殖以及中后期的工业园区和港口的建设。主要的陆域增长点为沾化和无棣沿海地区、曹妃甸工业区,天津滨海新区以及黄骅港、滨州港、东营港等。2010年的渤海湾海岸线形态相比于2000年要粗糙很多,10年间新增加了4处向海延伸20km左右的人工建筑以及多处10km左右的人工建筑,岸线形态的变化必然对渤海湾水动力环境造成显著影响。
Driving force analysis of Bohai Bay coastline change from 2000 to 2010 .URL 摘要
利用多期遥感数据,以2年为时间步长提取了2000-2010年间各时期渤海湾海岸线空间位置、长度以及结构信息。通过空间分析,以岸线长度和陆域面积增长为数量指标对海岸线的时空变迁过程进行了定量反演,并进行了驱动力和影响分析。研究表明,研究期渤海湾岸线变化显著,岸线总长度增长了约427km,几乎全部为人工岸线,自然岸线变化微弱。由岸线变迁所造成的陆域面积增长达到937km2。海岸线变迁的主要驱动力表现为前期的围垦养殖以及中后期的工业园区和港口的建设。主要的陆域增长点为沾化和无棣沿海地区、曹妃甸工业区,天津滨海新区以及黄骅港、滨州港、东营港等。2010年的渤海湾海岸线形态相比于2000年要粗糙很多,10年间新增加了4处向海延伸20km左右的人工建筑以及多处10km左右的人工建筑,岸线形态的变化必然对渤海湾水动力环境造成显著影响。
|
| [21] |
Coastal changes and land use alteration on Northeastern part of Turkey [J].https://doi.org/10.1016/j.ocecoaman.2015.06.019 URL 摘要
Coasts, not only today but throughout history, have been valuable, important and attractive areas for mankind. Unfortunately, the link between coasts and user has not been stayed in balance due to growing pressure from increasingly diverse human activities. Anthropogenic pressure on coastal areas is rising because of the fact that people are tend to settle by the coast for some reasons such as better transportation, nutrition and commerce. Many conflicts were observed during the establishment of mega cities on coastal zones. Unfortunately, sustainability is generally neglected through the solution process of the coastal problems. Even though, it is a relatively late step, the recent initiatives have a potential to decrease the anthropogenic pressure on coastal zones in Turkey. To achieve the best management strategy, there should be a well established connection between science and policy. Therefore novel technologies should be used for better monitoring and mapping the coastal zones. Coastline mapping is one of the fundamental steps of Integrated Coastal Zone Management (ICZM) planning. In this study, coastal zone of the Trabzon city which comprises approximately 110km length including central district and 9 coastal counties was investigated in terms of decadal coastline changes and associated land use/cover (LULC) types. Automatic extraction of the coastline was achieved by applying proposed methodology on multispectral Landsat TM/ETM images. To obtain the LULC classes, Support Vector Machine (SVM) algorithm was implemented and four classes, water, vegetation, impervious surface and bare soil were identified. Finally all graphical data was transferred and analyzed within GIS environment. The coastline changes were evaluated by using a GIS tool of Digital Shoreline Analysis System (DSAS). DSAS results revealed that, the net coastline change was reached up to 88.2m in central region of Trabzon. It was found that during the time span (1984鈥2011) coastal agricultural lands were intentionally converted to impervious surfaces. The ratio analyses of the study area showed that impervious surface area was doubled for the last 27 years. The coastal zone of the region can be characterized with 鈥渁ccretion鈥 type zone. The geomorphologic character, linear-littoral development of the city and recently completed North Anatolian highway might be dominant effects in shaping the coastal zone character. In conclusion, decadal change analyses prove that the coastal zone of the city is under severe anthropogenic effects as it can be observed in some other coasts of Turkey.
|
| [22] |
Recent shifts in coastline change and shoreline stabilization linked to storm climate change [J]. |
| [23] |
|
| [24] |
基于面向对象和规则的遥感影像分类研究 [J].https://doi.org/10.3321/j.issn:1671-8860.2006.04.009 URL [本文引用: 1] 摘要
讨论了面向对象和规则的光学遥感影像分类方法。首先利用多尺度分割形成影像对象,建立对象的层次结构,计算对象的光谱特征、几何特征、拓扑特征等,利用对象、特征形成分类规则,并通过不同对象层间信息的传递和合并实现对影像的分类。并以北京城市土地利用分类为例,对该方法进行了验证。
Classification of remot sensing image based on object oriented and class rules .https://doi.org/10.3321/j.issn:1671-8860.2006.04.009 URL [本文引用: 1] 摘要
讨论了面向对象和规则的光学遥感影像分类方法。首先利用多尺度分割形成影像对象,建立对象的层次结构,计算对象的光谱特征、几何特征、拓扑特征等,利用对象、特征形成分类规则,并通过不同对象层间信息的传递和合并实现对影像的分类。并以北京城市土地利用分类为例,对该方法进行了验证。
|
| [25] |
中国珠三角盆地和日本关东盆地平地人口密度对比研究 [J].
改革开放以来,大量人口向珠三角盆地聚集,不断增加的人口负荷给区域可持续发展带来巨大压力,也给珠三角盆地国土承载力带来挑战。以中国珠三角盆地和日本关东盆地作为研究区,选取2地2000和2010年普查人口和国土面积数据,进行计算、分析和对比,认为用可居住的平地人口密度才能真实反映区域人口压力状况。研究结果表明,日本关东盆地人口增长率从1995年开始已降到0.5%,人口承载力接近饱和。以人口承载力接近饱和的日本关东盆地为参考对象,对比中国珠三角盆地和日本关东盆地的平地人口密度,2000年时中国珠三角盆地的平地人口密度低于日本关东盆地,珠三角盆地还有一定吸纳人口的能力;2010年时中国珠三角盆地的平地人口密度已超过日本关东盆地,其人口规模已经接近其国土承载力极限,进一步集聚人口的能力已经非常有限。依靠人口集聚发展劳动密集型产业推动经济增长的传统发展模式已经难以为继,转变经济发展方式势在必行。
Comparative study of population density in flat area between the Pearl River Basin in China and Kanto Basin in Japan .
改革开放以来,大量人口向珠三角盆地聚集,不断增加的人口负荷给区域可持续发展带来巨大压力,也给珠三角盆地国土承载力带来挑战。以中国珠三角盆地和日本关东盆地作为研究区,选取2地2000和2010年普查人口和国土面积数据,进行计算、分析和对比,认为用可居住的平地人口密度才能真实反映区域人口压力状况。研究结果表明,日本关东盆地人口增长率从1995年开始已降到0.5%,人口承载力接近饱和。以人口承载力接近饱和的日本关东盆地为参考对象,对比中国珠三角盆地和日本关东盆地的平地人口密度,2000年时中国珠三角盆地的平地人口密度低于日本关东盆地,珠三角盆地还有一定吸纳人口的能力;2010年时中国珠三角盆地的平地人口密度已超过日本关东盆地,其人口规模已经接近其国土承载力极限,进一步集聚人口的能力已经非常有限。依靠人口集聚发展劳动密集型产业推动经济增长的传统发展模式已经难以为继,转变经济发展方式势在必行。
|

/
| 〈 |
|
〉 |

