孙斌栋 , 李琬
, 李琬
华东师范大学中国现代城市研究中心/城市与区域科学学院,上海 200062
Sun Bindong, Li Wan
中图分类号: F129.9
文献标识码: A
文章编号: 1000-0690(2016)03-0328-07
通讯作者:
收稿日期: 2015-01-14
修回日期: 2015-04-15
网络出版日期: 2016-03-20
版权声明: 2016 《地理科学》编辑部 本文是开放获取期刊文献,在以下情况下可以自由使用:学术研究、学术交流、科研教学等,但不允许用于商业目的.
基金资助:
作者简介:
孙斌栋(1970-),男,河北阜平人,教授,博士生导师,主要从事城市地理与经济地理研究。E-mail: bdsun@re.ecnu.edu.cn
展开
摘要
基于2010年市域数据,定量分析市域范围的城市规模分布对经济绩效的影响,并探索最优城市规模分布的影响因素。结果表明,① 在控制了其它重要的生产要素后,单中心规模分布具有更高的劳动生产率;② 随着规模由小变大,具有最优经济绩效的城市规模分布形式存在单中心-多中心-单中心的转变;③ 没有发现经济发展水平影响最优城市规模分布的明确证据;④ 西部地区城市规模单中心分布更有助于提高经济绩效。
关键词:
Abstract
In 2011, the proportion of China's urban population exceeded 50%. The focus of China's urbanization is shifting from improving the urbanization rate to optimizing spatial efficiency, and it is of significant importance to explore the optimal city size distribution in terms of economic performance. City size distribution is a kind of spatial structure that reflects individuals' location choice after weighing their own advantages and disadvantages, and this is bound to affect the performance of economy. However, there is no logical consistency answer on which one is more efficient, pursuing mono-centric spatial structure for higher agglomeration economy or hunting polycentric spatial structure for lower agglomeration diseconomy. Besides, research on the economic performance of city size distributions has long been neglected. Existing studies of urban size distribution are mainly concentrated in discovering the stylized facts and rules of city size distribution, validating whether the theory of city size distribution conforming to the facts, and explaining the mechanism on the formation of city size distribution and so on. Based on city-regions cross-sectional data in 2010, this article studies how different city size distribution influences economic performance, what kinds of city size distribution has a higher economic efficiency in the mono-centric or polycentric dimension, and whether the optimal economic performance of urban size distribution is affected by other factors. This conclusions show that: 1) the mono-centric city size distribution tends to be associated with higher labor productivity, but with further samples subdivision, the optimal city size distribution turns up a mono-poly-mono shift along with the rise of scale. 2) No evidence has been found to support that the level of economic development affects the optimal city size distribution. And 3) it is of great significance to shape the cities in China's western region into mono-centric form.
Keywords:
中国城镇化率已经超过50%,城镇化的关注点正从提高城镇化率转移到优化城镇化空间效率上来。根据国家新型城镇化纲要,制约人口自由流动的户籍制度开始松动,中国正面临着一个重构城市规模分布的时间窗口,因势利导地引导人口向更具空间效率的格局迁移和分布是当务之急,而怎样的城市规模分布具有更好的经济绩效则成为当前亟待回答的问题。城市规模分布(City Size Distribution)是城市地理学和经济地理学重要的研究主题之一,反映了要素尤其是人口在空间的分布和组合结构。已有针对城市规模分布的研究主要集中在揭示城市规模分布的特征和规律[1]、验证城市规模分布的理论法则与实际的相符程度[2~4]以及解释城市规模分布的形成机制[5~9]等方面,对城市规模分布的经济绩效研究十分有限,尺度不同,结论也不统一[10~15]。
城市规模分布是“用脚投票”的行为主体综合权衡集聚经济与集聚不经济等利弊后形成的一种反映城市资源配置状况的空间结构[16~18],这种空间结构必然通过集聚经济和集聚不经济来影响经济绩效。而究竟是追崇更高的集聚经济,还是致力于减少集聚不经济的城市规模分布更有利于经济绩效,已有研究尚不能给出逻辑上一致的判断,有必要展开进一步探讨。本文定量分析中国市域范围的城市规模分布对经济绩效的作用,并探索了不同人口规模、经济发展水平和不同地区对这一作用的影响。本文试图回答的核心问题是,表征城市空间结构的城市规模分布是否影响经济绩效,怎样的城市规模分布具有更高经济效率,以及具有最优经济绩效的城市规模分布是否受其它因素影响。
本文选择中国地级及以上城市的市域城镇体系作为基本分析单元,当然,“按整个大都市区域进行划分是最合理的”[2],但受限于数据的可得性,本文仅以行政分界的市域作为研究对象。本文数据来自《中国2010年人口普查分县资料》[19]、《中国城市统计年鉴2011》[20]和《中国区域统计年鉴2011》[21]。由于数据限制,香港、澳门和台湾没有纳入分析,而拉萨市地方财政支出数据缺失、资本存量数据质量低等原因被剔除,本文利用2010年中国287个地级及以上城市作为对象开展研究。
借鉴Anas等[22]关于城市空间结构的经典定义,本文将城市规模分布分为单中心和多中心两种。单中心分布是指城市人口集中分布于城市体系中的一个或者有限的几个城市,居于主导地位的首位城市突出;多中心分布是指城市人口均匀的分散于几个城市中,城市之间主从关系不严格。城市规模分布的测度方法主要有规模位次法、首位城市比重法和赫芬达尔指数法,其中规模位次法被Krugman[6]认为是经济学中最惊人的实证规律性之一,本文主要使用规模位次法来衡量城市规模分布,数学表达式如下:
lnS= α + β lnR
式中,S代表城市常住城镇人口,R表示该城市常住城镇人口在市域范围内所占位次,α为常数,β为规模分布指数,其中β的绝对值越大,城市规模越倾向单中心分布。在具体处理上将位次减去最优位移量1/2来最大限度的消除可能的测量偏差[23]。
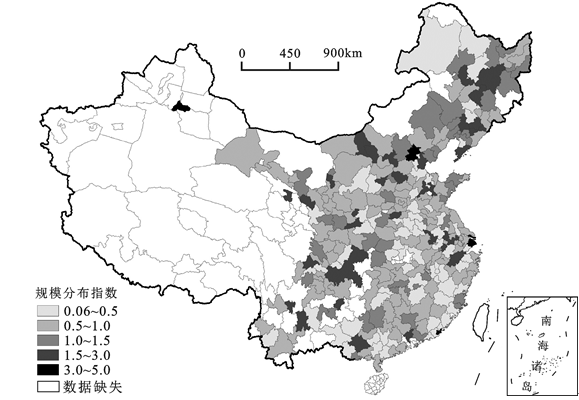
另外,本文的城市规模分布的基本空间单位是地级及以上城市市域范围内的市辖区(各个区加总)、飞地区、县和县级市(本文将空间相邻的市辖区整体视为一个独立城市。飞地区是指该区与城市其他市辖区在地理位置上不相毗邻,一般是矿区或经济特区,经济相对比较独立,故可以看作一个独立的城市,2010年共有20个城市存在飞地区(21个)。县城和县级市市区的人口规模数据不可得,而县和县级市从形态上来看是一个区域,不是城市实体,故这里构造一个虚拟的城市,分别用全县和全市的常住城镇人口来反映其规模。),并剔除了只有市辖区的14个样本城市。由于不同城市的市域含有不同数目的基本单位,为了保证城市间测度结果可比性,Meijers[24]认为应采用固定位数的基本单位来测度,本文借鉴文献中常用的方法采用规模排序前4位城市进行测度规模分布指数(RS_F)[13,25],位次不足4位则以最多位次为准。为了保证结论的可靠性,本文还测度了前6位、前10位和全部位次的规模分布指数。从图1规模分布指数(RS_F)的地理分布来看,2010年中国市域城市规模分布的区域差异明显,相对而言,东北地区、京津冀及其附近、长三角地区和以重庆、乌鲁木齐为代表的西部城市规模偏向单中心分布,中部和东南部的城市规模偏向多中心分布。
遵循Meijiers等做法,采用修正后的柯布道格拉斯生产函数衡量城市规模分布对劳动生产率的影响,基于规模报酬不变,其线性检验方程为:
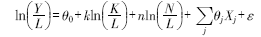
式中,Y是名义产出,L为劳动力,K是固定资本存量,N为建设用地面积,Xj为变量组,表示第j个控制变量,k、n、θj分别为各个对应变量的系数大小,θ0为常数,ε为残差。该方程含义是,劳均产出(Y/L)取决于劳均固定资本存量(K/L)、劳均建设用地、变量组Xj包括本文的核心变量城市规模分布(RS_F)、代表集聚效应的劳动力规模、代表人力资本的平均受教育年限、代表政策干预的政府支出比重、代表基础设施的劳均公路里程和代表产业结构的二三产业比重。
具体变量说明如下:
1) 被解释变量为劳均GDP(Y/L),采用2010年市域名义GDP总量除以劳动人口(元/人),用以衡量劳动生产率。由于集聚效应主要发生在工业和服务业,因此GDP数据剔除第一产业产值,劳动人口相应剔除了农林牧副渔业人口。
2) 解释变量除了城市规模分布指数外,还包括:① 劳均资本存量(K/L):市域资本存量除以劳动人口(元/人),目前国内资本存量没有公开数据,本文以2010年为标准对1978~2009年进行区划调整,然后根据永续盘存法测算得出。② 劳均建设用地(N/L):由于县的建设用地面积数据不可得,因此劳均建设用地面积为地级市市辖区和县级市市辖区的建设用地之和除以劳动人口(m2/人)。③ 二三产业劳动力规模。④ 人均受教育年限:近似反映劳动者人力资本状况。⑤ 政府支出比重:政府财政一般预算支出占全部GDP比重,根据巴罗[26]的建议,预算支出中剔除了教育支出。⑥ 劳均公路里程:市域范围的劳均公路里程(km2/人),宁夏自治区的地级市数据缺失,使样本数减少到267个。⑦ 二三产业比重:市域二三产业与GDP比值。主要变量的描述性统计分析因篇幅限制从略。
本文采用稳健多元回归的方法检验城市规模分布对经济绩效的影响,表1报告了回归结果。第(1)列为仅控制城市规模分布的单变量回归,从中可以看出城市规模分布(RS_F)对经济绩效有着显著的正向作用。第(2)列加入其他影响劳动生产率的变量,RS_F依然显著为正,即单中心有助于提高劳动生产率。为了检验城市规模分布与集聚效应是否存在交互作用,在第(3)列加入两者的交乘项,高度显著为正,这说明随着市域规模的扩大,城市规模单中心分布对劳均GDP的提高作用更为明显。为保证估计结果的可靠性,以固定位数前6位、前10位和全部位次的规模分布指数分别置换上面的前4位城市规模分布变量(RS_F),结果也均与RS_F一致。
表1 城市规模分布与经济绩效
Table 1 City size distribution and economic performance
| (1) | (2) | (3) | |
|---|---|---|---|
| 城市规模分布(RS_F) | 0.2046*** | 0.0538* | 0.0335 |
| (0.0468) | (0.0280) | (0.0285) | |
| 二三产业劳动力规模 | 0.0333 | 0.0170 | |
| (0.0261) | (0.0276) | ||
| 城市规模分布×规模 | 0.0461*** | ||
| (0.0170) | |||
| 劳均资本 | 0.3040*** | 0.3014*** | |
| (0.0333) | (0.0334) | ||
| 劳均土地 | 0.1897*** | 0.1923*** | |
| (0.0431) | (0.0421) | ||
| 受教育年限 | 0.0870*** | 0.0769*** | |
| (0.0256) | (0.0270) | ||
| 政府支出比重 | -2.1049*** | -2.1840*** | |
| (0.4187) | (0.4405) | ||
| 劳均公路里程 | 9.5009*** | 8.7801*** | |
| (2.3734) | (2.3092) | ||
| 二三产业比重 | 0.1144*** | 0.1177*** | |
| (0.0234) | (0.0245) | ||
| 常数 | 11.2679*** | 6.1323*** | 6.4874*** |
| (0.0479) | (0.5262) | (0.5742) | |
| 样本量 | 272 | 267 | 267 |
| 调整R2 | 0.1031 | 0.7450 | 0.7485 |
| F | 19.1270 | 92.7050 | 82.7307 |
模型中反映规模经济效应的市域二三产业劳动力尽管系数为正,但并不显著,也就是说市域范围的规模经济(模型中也尝试加入规模的二次项,但并不显著,所以并未在模型中控制规模二次项。)并不存在,将其置换为城镇人口和常住人口,结论仍一致,这似乎相悖于公认的规模收益递增这一预期。可能的原因是:① 城市规模收益递增在地理维度上有一定范围,目前中国市域还未发展为联系密切的区域单元,规模经济尚不存在;② 劳动力总量的增加不会单纯的带来集聚经济,还伴随着劳均GDP分母的增大带来的劳均GDP降低。对于本文来说,在市域规模经济不存在的情况下,单中心城市规模分布仍是有利于经济绩效的,这暗示着单个城市的规模经济并没有扩展到市域范围,市域范围内尚未发生“规模互借”( 规模互借(Borrowed Size)1973年由阿隆索提出,用来解释为什么大都市区的小城市比同等规模独立的小城市具有更高的收入。)。
其余解释变量与已往研究结论相一致,资本、土地、受教育年限、公路里程和二产主导的产业结构均对市域的经济绩效产生正面的影响,而政府支出比重则反映了政府对市场的干预程度,这种干预程度越高越不利于经济绩效的改善。
当然,不仅城市规模分布可能影响经济发展,经济发展也可能会反过来影响城市规模分布,且这种影响已经得到部分实证检验的确认[27,28]。为了解决由于反向因果存在造成的估计结果有偏和不一致,本部分采用工具变量的两阶段最小二乘法回归(TSLS)进行模型的内生性检验,主要采用1个历史变量和1个地理变量作为规模分布的工具变量,具体为:① 1953年常住人口测度的城市规模分布(基于数据可得性的考虑选择中国第一次人口普查(1953年)数据作为工具变量,并按2010年行政区划进行调整。由于1953年人口普查只统计常住人口数据,1953年城市规模分布是行政区划调整后的常住人口的规模位次分布值。);② 一级河流密度。为了在统计上对此进一步确认,本文在历史工具变量的基础上,加上一级河流密度进行Sargan过度识别检验。一方面,河流作为自然地理现象在一定地域范围内具有高度的随机外生特性,可以被假设为与个人或群体的异质性无关;另一方面,河流能起到分割城市作用,河流越密城市规模分布可能更加多中心。从统计检验结果看,模型通过了不可识别和弱工具检验,工具变量满足相关性的要求;Sargan过度识别检验拒绝工具变量内生的原假设,据此推断本文的工具变量具有良好的外生性。而进一步的Hausman和Durbin-Wu-Hausman检验结果表明,本文的城市规模分布不存在内生性,这与Lee等[12]、Meijers等[24]的结论基本一致,即城市规模分布的改变十分缓慢,以规模位次法测度的城市规模分布相对于这一时期的劳动生产率来说是外生的。这一结论表明上文多元回归结果是可信的。
以上实证结果只显示了城市规模分布对于经济绩效的一般性影响,这种作用可能会因市域规模、经济发展水平和地理区位不同而具有差异性。
本文以100万二三产业劳动力规模为界( 以100万分组依据在于2010年所有城市样本的二三产业劳动力的平均规模为120.43万。),把原样本分成两个子样本分别回归。结果如表2所示,对于100万以下城市,与表1的全样本模型结果一致,单中心有助于提高经济绩效,但这里最优规模分布不再受规模影响。而对于100万以上的城市,规模分布则出现负显著,即多中心规模分布的经济绩效更高,且劳动力规模变为正显著,开始具有规模集聚递增效应。进一步根据表2第4列所得系数,综合考虑规模分布及其交乘项求取在不同规模条件下RS_F的边际作用,发现规模一旦超过283.38万,最优城市规模分布模式出现多中心到单中心的转变。为了探索这一变化原因,在第(5)列加入快速轨道交通里程和直辖市虚拟变量,结果交乘项不再显著,换句话说最优城市规模分布模式不再发生改变。
对于这一连串结果进行逻辑一致解释的关键在于判断单中心与多中心“净集聚经济”是如何随规模动态变化的。首先,对于规模100万以下样本来说,由于“规模互借”的市域集聚经济不存在(规模系数不显著),而规模较小时的集聚经济超过不经济,所以单中心是经济绩效较好的城市规模分布模式。对100万以上的样本而言,市域规模系数正显著,即市域范围的集聚经济和首位城市的集聚经济、不经济同时存在,净集聚经济的确定十分困难。理论上来说,随着规模的扩大,城市边际规模收益递减,而边际外部成本递增,集聚不经济迅速加大很有可能超过集聚经济的增加,加上“规模互借”集聚经济的存在,这就使得多中心成为具有更高经济绩效的城市规模分布模式。最后,随着规模超过一定门槛,由于高等级城市的强大资源动员能力,加上城市技术和管理能力的提高,规模不经济被降低,单中心的净集聚经济能力进一步增大,因此单中心重新成为更具经济绩效的城市规模分布模式。如规模超过283万的19个城市,行政等级大多是直辖市、副省级城市和省会城市,且大多有地铁运营,这有助于减轻集聚不经济。简而言之,城市规模分布随着规模的扩大,其经济绩效的分布模式呈现单中心-多中心-单中心的变化。
表2 劳动力规模分组下城市规模分布对经济绩效的影响
Table 2 Labor’s influence on the economic performance of city size distribution
| 劳动力小于100万 | 劳动力大于100万 | |||||
|---|---|---|---|---|---|---|
| (1) | (2) | (3) | (4) | (5) | ||
| 城市规模分布 | 0.0623** | 0.0920** | -0.0304 | -0.1122*** | -0.0872* | |
| (0.0293) | (0.0436) | (0.0376) | (0.0407) | (0.0490) | ||
| 规模 | 0.0237 | 0.0251 | 0.1724*** | 0.0934** | 0.0737 | |
| (0.0472) | (0.0473) | (0.0447) | (0.0469) | (0.0537) | ||
| 规模×城市规模分布 | 0.0605 | 0.0905*** | 0.0451 | |||
| (0.0565) | (0.0296) | (0.0456) | ||||
| 劳均快速轨道交通里程 | 2.8276 | |||||
| (3.7834) | ||||||
| 是否是直辖市(虚拟变量) | 0.1688 | |||||
| (0.1719) | ||||||
| 其他控制变量 | 有 | 有 | 有 | 有 | 有 | |
| 样本量 | 168 | 168 | 99 | 99 | 99 | |
| 调整R2 | 0.7647 | 0.7645 | 0.7897 | 0.7999 | 0.7979 | |
| F | 54.6438 | 51.6049 | 40.1105 | 38.4209 | 31.9134 | |
城市规模分布对经济增长的作用很可能受经济发展水平影响,因此本文采用分位数回归的方法检验城市规模分布系数在劳均GDP不同分位点上的变化。
由图2可见,城市规模分布系数随着劳均GDP分位数的提高大致呈先升后降的趋势,即在劳动生产率比较低的发展阶段,市域规模分布单中心化的经济贡献逐渐加强,而在劳动生产率相对较高的情况下,市域单中心规模分布对经济增长的贡献逐渐降低。但分位数回归模型并未通过斜率相等检验,也就是说虽然城市规模分布在不同分位点上系数有一定变化,但在统计上可以忽略这种区别,这说明最优城市规模分布是否受经济发展水平的影响还需要更为直接的证据。
图2 分位数回归中城市规模分布的系数变化
Fig.2 Coefficients of cities size distribution in Quantile regression
不同地理区位的城市具有不同的自然禀赋、经济、制度等,很有可能导致经济绩效最优的城市规模分布存在区域差异性,因此进一步把样本分为东中西分别回归,结果发现(具体结果因篇幅限制不予报告),东、中部城市模型中城市规模分布均不再显著,而西部城市模型的系数不仅增大而且统计上是正显著的,也就是说西部城市规模单中心分布具有更好经济绩效。区域的异质性与规模、发展阶段异质性的逻辑基本一致,从城市的平均规模上来看,西、中、东依次增加,单中心化的经济贡献逐渐降低,单中心向多中心转换的可能性加大。
本文研究显示,市域尺度的城市规模分布的确影响经济绩效。从全部样本来看,城市规模单中心分布经济绩效更好;最优城市规模分布的规模依赖性突出,经济绩效最优的城市规模分布随着规模的变化呈现出单中心-多中心-单中心的变化;并没有找到经济绩效最优的城市规模分布受经济发展水平影响的明确证据;城市规模分布影响经济绩效的区域异质性突出,现阶段西部城市规模单中心分布更能够显著提高经济绩效。上述结论对于中国新型城镇化建设具有重要的政策含义。整体而言,在市域范围内要因势利导地引导人口向更具空间效率的市辖区流动,尤其是规模较小城市区域,其政策重点更应放在引导人口和就业向中心城区集中;而对于规模较大城市区域,政策上要适当倾斜促进多中心有机疏散,当然对于规模更大城市区域,集聚不经济减轻很可能会呈现出单中心集聚经济增强的结果,因此对特大城市的城市规模分布引导政策需要更加慎重。就不同区域而言,西部地区政策上要重视引导人口和就业向市辖区集聚,以期尽快形成单中心规模布局;而东部和中部的城市人口空间引导则要谨慎以待,不能简单的向单中心或者多中心引导,结合城市具体的规模、经济发展阶段等方面的异质性进行具体分析十分必要。本文的局限在于,由于数据可获得性限制,仅采用2010年的数据进行静态分析,无法考察随时间变化的动态效应;对城市规模分布影响经济绩效的机制还需要更为直接的证据,这也是未来需要重点研究的方向。
The authors have declared that no competing interests exist.
| [1] |
Human behaviour and the principle of least effort [M]. |
| [2] |
The size distribution of cities: An examination of the pareto law and primacy [J].https://doi.org/10.1016/0094-1190(80)90043-1 URL [本文引用: 2] 摘要
This paper examines the Pareto and primacy measures of the size distribution of cities. The mean Pareto exponent for a sample of 44 countries is 1.136, somewhat greater than the exponent of one implied by the rank-size rule. We find that value of the Pareto exponent is quite sensitive to the definition of the city and the choice of city sample size. The significance of non-linear terms in variants of the Pareto distribution also indicate that the rank-size rule is only a first approximation to a complete characterization of the size distribution of cities within a country. The relatively low correlation between primacy and Pareto measures confirms the need for a variety of measures of city size distributions. This paper also suggests that large cities are growing faster than small cities in most of the countries in our sample. This is indicated by the positive coefficient on the first non-linear term introduced into the Pareto equation. Finally, variations in the Pareto exponent and measures of primacy are partly explained by economic, demographic, and geographic factors.
|
| [3] |
The strategic bombing of German cities during World War II and its impact on city growth [J]. |
| [4] |
Zipf's law for cities: A cross-country investigation [J].https://doi.org/10.1016/j.regsciurbeco.2004.04.004 URL [本文引用: 1] 摘要
This paper assesses the empirical validity of Zipf07s Law for cities, using new data on 73 countries and two estimation methods 07 OLS and the Hill estimator. With either estimator, we reject Zipf07s Law far more often than we would expect based on random chance; for 53 out of 73 countries using OLS, and for 30 out of 73 countries using the Hill estimator. The OLS estimates of the Pareto exponent are roughly normally distributed, but those of the Hill estimator are bimodal. Variations in the value of the Pareto exponent are better explained by political economy variables than by economic geography variables.
|
| [5] |
The sizes and types of cities [J].https://doi.org/10.1257/aer.103.3.701 URL [本文引用: 1] 摘要
This paper presents a simple general equilibrium model of an economy where production and consumption occur in cities. The paper focuses on the different sizes and types of cities generated by market forces and whether these market forces generate optimally size cities. Before the model is presented, four complex questions are naively answered, revealing the most basic concepts underlying the paper and intellectual debts to the existing literature. First the model of a single city is presented. How factor rewards and cost of living vary with city size is analysed. Given these results, the paper presents an analysis of market equilibrium and optimum city size. Finally, equilibrium in an economy with multiple types of cities is examined. At the end of the paper, we discuss how natural resources and transportation costs in trade can be integrated into the model. Throughout the paper, it is assumed that capital and labour are scarce resources and perfectly mobile within the economy. The economy is situated on a flat featureless plain, large enough so that land per se is never a scarce resource (although location will be a scarce resource). This non-critical assumption implies the opportunity cost of land is zero. Lastly, there are no specified transport costs of inter-city trade.
|
| [6] |
Confronting the mystery of urban hierarchy [J].https://doi.org/10.1006/jjie.1996.0023 URL [本文引用: 1] 摘要
The size distribution of cities in the United States is startlingly well described by a simpler power law: the number of cities whose population exceeds S is proportional to 1/ S . This simple regularity is puzzling; even more puzzling is the fact that it has apparently remained true for at least the past century. Standard models of urban systems offer no explanation of the power law. A random growth model proposed by Herbert Simon 40 years ago is the best try to date—but while it can explain a power law, it cannot reproduce one with the right exponent. At this point we are in the frustrating postion of having a striking empirical regularity with no good theory to account for it. J. Japan. Int. Econ. , December 1996, 10 (4), pp. 399–418. Stanford University, Stanford, California 94305-6072
|
| [7] |
Zipf's law for cities: An explanation [J].https://doi.org/10.1162/003355399556133 URL 摘要
Zipf's law is a very tight constraint on the class of admissible models of local growth. It says that for most countries the size distribution of cities strikingly fits a power law: the number of cities with populations greater than S is proportional to 1/S. Suppose that, at least in the upper tail, all cities follow some proportional growth process (this appears to be verified empirically). This automatically leads their distribution to converge to Zipf's law. 漏 2000 the President and Fellows of Harvard College and the Massachusetts Institute of Technology
|
| [8] |
Axtell R, Florida R. Emergent cities: A microeconomic explanation for Zipf's law [R/OL]. . |
| [9] |
Some foundations for Zipf's law: Product proliferation and local spillovers [J].https://doi.org/10.1016/j.regsciurbeco.2006.03.008 URL [本文引用: 1] 摘要
This paper embeds the canonical model of endogenous growth with product proliferation developed by Romer [Romer, P.M., 1990. Endogenous technical change. Journal of Political Economy 98, S71–S102] into a simple urban framework. This yields a reduced form isomorphic to the popular statistical device developed by Simon [Simon, H., 1955. On a class of skew distribution functions. Biometrika 42, 425–440], which in turn can yield Zipf's law for cities. The stochastic outcomes of purposeful innovation and local spillovers can thus serve as foundations for random growth models.
|
| [10] |
The urbanization process and economic growth: The so-what question [J].https://doi.org/10.1023/A:1022860800744 URL Magsci [本文引用: 1] 摘要
<a name="Abs1"></a>There is an extensive literature on the urbanization process looking at both urbanization and urban concentration, asking whether and when there is under or over-urbanization or under or over urban concentration. Writers argue that national government policies and non-democratic institutions promote excessive concentration—the extent to which the urban population of a country is concentrated in one or two major metropolitan areas—except in former planned economies where migration restrictions are enforced. These literatures assume that there is an optimal level of urbanization or an optimal level of urban concentration, but no research to date has quantitatively examined the assumption and asked the basic <img src="/content/T317782VG206636L/xxlarge8220.gif" alt="ldquo" align="MIDDLE" border="0">so-what<img src="/content/T317782VG206636L/xxlarge8221.gif" alt="rdquo" align="MIDDLE" border="0"> question—how great are the economic losses from significant deviations from any optimal degrees of urban concentration or rates of urbanization? This paper shows that (1) there is a best degree of urban concentration, in terms of maximizing productivity growth (2) that best degree varies with the level of development and country size, and (3) over or under-concentration can be very costly in terms of productivity growth. The paper shows also that productivity growth is not strongly affected by urbanization per se. Rapid urbanization has often occurred in the face of low or negative economic growth over some decades. Moreover, urbanization is a transitory phenomenon where many countries are now fully urbanized.
|
| [11] |
City size distribution and Economic Growth: The Case of China [R].
|
| [12] |
Urban spatial structure and economic growth in US metropolitan areas [R]. |
| [13] |
Spatial structure and productivity in US metropolitan areas [J]. |
| [14] |
东北地区市域城市人口空间结构与劳动生产率关系研究 [J].Magsci 摘要
以东北地区36个地级行政单元为样本,利用2000年中国第五次人口普查数据,采用Meijers等给出的区域城市人口中心度和分散度指标对各市域城市人口空间结构进行测度,同时借鉴Cobb-Douglas生产函数,推导出基于OLS算法的实证回归模型,选取中心度、分散度和首位城市人口规模等指标与劳动生产率进行实证分析。结果表明:① 首位城市人口规模越大,劳动生产率越高;② 中心度对劳动生产率的作用不明显;③ 分散度对劳动生产率有负的影响,并受到市域人口规模和市域尺度的影响。
Du xue, Zhang Peng et al. The Urban Population Spatial Structure and Labor Productivity of Administrative Region of Cities in the Northeast China .Magsci 摘要
以东北地区36个地级行政单元为样本,利用2000年中国第五次人口普查数据,采用Meijers等给出的区域城市人口中心度和分散度指标对各市域城市人口空间结构进行测度,同时借鉴Cobb-Douglas生产函数,推导出基于OLS算法的实证回归模型,选取中心度、分散度和首位城市人口规模等指标与劳动生产率进行实证分析。结果表明:① 首位城市人口规模越大,劳动生产率越高;② 中心度对劳动生产率的作用不明显;③ 分散度对劳动生产率有负的影响,并受到市域人口规模和市域尺度的影响。
|
| [15] |
城市群空间结构特征与经济绩效——来自中国的经验证据 [J].
合理有序的空间组织结构是提高经济增长质量和效益的重要源泉,也是当前区域规划的重要内容。本文基于2000—2009年中国十大城市群面板数据,综合运用位序规模法则、首位度系统考察了城市群空间结构对经济绩效的影响。结果表明:在控制了城市群规模、产业结构、基础设施以及外商直接投资等影响因素后,单中心结构对全要素生产率具有显著的促进作用,且这种作用在城市群规模较小时尤为明显。这意味着我国城市等级分布差异仍然较小,呈现核心城市偏小,中小城市偏大的扁平化特征。因而,进一步强化中心城市的集聚效应,能够降低交通成本和资源消耗,形成更加有效的劳动力市场和更加紧密的产业、技术关联,是促进城市群协调可持续发展的有效途径。
Spatial Structure and Economic Performance in Chinese Urban Agglomerations .
合理有序的空间组织结构是提高经济增长质量和效益的重要源泉,也是当前区域规划的重要内容。本文基于2000—2009年中国十大城市群面板数据,综合运用位序规模法则、首位度系统考察了城市群空间结构对经济绩效的影响。结果表明:在控制了城市群规模、产业结构、基础设施以及外商直接投资等影响因素后,单中心结构对全要素生产率具有显著的促进作用,且这种作用在城市群规模较小时尤为明显。这意味着我国城市等级分布差异仍然较小,呈现核心城市偏小,中小城市偏大的扁平化特征。因而,进一步强化中心城市的集聚效应,能够降低交通成本和资源消耗,形成更加有效的劳动力市场和更加紧密的产业、技术关联,是促进城市群协调可持续发展的有效途径。
|
| [16] |
|
| [17] |
Economies and diseconomies of agglomeration [C]//
|
| [18] |
特大城市多中心空间结构的经济绩效——基于城市经济模型的理论探讨 [J].https://doi.org/10.3969/j.issn.1000-3363.2011.06.004 URL [本文引用: 1] 摘要
国内特大城市大多采取多中心空 间战略,但效果并不明显,其理念的有效性尤其是经济的有效性需要严谨检验。尽管主流经济学对此还没有完整、精确的答案,但城市经济方面的研究成果却给出了 方向性的结论,即随着城市规模扩大,集聚的负外部性产生的成本会逐渐超过规模经济带来的效益,最终导致单中心向多中心转化。这一结论从经济绩效角度为多中 心的规划理念提供了理论依据。实践中的多中心战略之所以达不到预期效果,原因在于城市经济模型是基于自由市场机制的前提假设,而这与现实存在很大出入。为 了降低由多中心结构形成的时滞性造成的城市利益损失,政府应发挥作为城市整体利益最大化代表的作用,在尊重经济运行规律的基础上及时做出空间转型的决策, 并发挥政策聚焦和资源调动优势,促进外围有初始优势的地区迅速发展成为次中心城市,积极主动地推进多中心空间结构的形成,从而实现城市空间布局的最优化和 城市整体利益的最大化。
The Economic Performance of the Polycentric Spatial Structure of Mega-cities: Based on the Models of Urban Economics .https://doi.org/10.3969/j.issn.1000-3363.2011.06.004 URL [本文引用: 1] 摘要
国内特大城市大多采取多中心空 间战略,但效果并不明显,其理念的有效性尤其是经济的有效性需要严谨检验。尽管主流经济学对此还没有完整、精确的答案,但城市经济方面的研究成果却给出了 方向性的结论,即随着城市规模扩大,集聚的负外部性产生的成本会逐渐超过规模经济带来的效益,最终导致单中心向多中心转化。这一结论从经济绩效角度为多中 心的规划理念提供了理论依据。实践中的多中心战略之所以达不到预期效果,原因在于城市经济模型是基于自由市场机制的前提假设,而这与现实存在很大出入。为 了降低由多中心结构形成的时滞性造成的城市利益损失,政府应发挥作为城市整体利益最大化代表的作用,在尊重经济运行规律的基础上及时做出空间转型的决策, 并发挥政策聚焦和资源调动优势,促进外围有初始优势的地区迅速发展成为次中心城市,积极主动地推进多中心空间结构的形成,从而实现城市空间布局的最优化和 城市整体利益的最大化。
|
| [19] |
|
| [20] |
|
| [21] |
|
| [22] |
Urban spatial structure [J]. |
| [23] |
Rank-1/2: A simple way to improve the OLS estimation of tail exponents [J].https://doi.org/10.1198/jbes.2009.06157 Magsci [本文引用: 1] 摘要
Despite the availability of more sophisticated methods, a popular way to estimate a Pareto exponent is still to run an OLS regression: log(Rank) = a - b log(Size), and take b as an estimate of the Pareto exponent. The reason for this popularity is arguably the simplicity and robustness of this method. Unfortunately, this procedure is strongly biased in small samples. We provide a simple practical remedy for this bias, and propose that, if one wants to use an OLS regression, one should use the Rank - 1/2, and run log(Rank - 1/2) = a - b log(Size). The shift of 1/2 is optimal, and reduces the bias to a leading order. The standard error on the Pareto exponent xi is not the OLS standard error, but is asymptotically (2/n)(1/2)xi. Numerical results demonstrate the advantage of the proposed approach over the standard OLS estimation procedures and indicate that it performs well under dependent heavy-tailed processes exhibiting deviations from power laws. The estimation procedures considered are illustrated using an empirical application to Zipf's law for the United States city size distribution.
|
| [24] |
Measuring polycentricity and its promises [J].https://doi.org/10.1080/09654310802401805 URL [本文引用: 2] 摘要
Even a decade after the concept of polycentric development became popular and increasingly widespread in Europe as a normative policy stance allegedly leading to cohesion and competitiveness, its empirical basis is still rather weak. This is partly due to a lack of conceptual clearness, which makes its measurement difficult. This research briefing synthesises the results of two recent ESPON projects that aim to create a quantitative measurement of the extent of polycentricity of national urban systems, as well as the links they find between polycentricity and economic and social objectives. Both approaches have their limits and have been, and can be criticized from various perspectives. Some suggestions on how to proceed with this research agenda are presented.
|
| [25] |
Metropolitan labor productivity and urban spatial structure [M]. |
| [26] |
Inequality and Growth in a Panel of Countries [J].https://doi.org/10.1023/A:1009850119329 Magsci [本文引用: 1] 摘要
<a name="Abs1"></a>Evidence from a broad panel of countries shows little overall relation between income inequality and rates of growth and investment. For growth, higher inequality tends to retard growth in poor countries and encourage growth in richer places. The Kuznets curve—whereby inequality first increases and later decreases during the process of economic development—emerges as a clear empirical regularity. However, this relation does not explain the bulk of variations in inequality across countries or over time.
|
| [27] |
Development,primacy,and systems of cities [J]. |
| [28] |
基于理论模型与美国经验证据的城市增长序贯模式 [J].https://doi.org/10.11821/dlxb201312004 Magsci [本文引用: 1] 摘要
城市体系演化动态规律的研究正逐渐成为城市地理学研究的热点。基于新经济地理学理论模型和美国城市体系演化的实证案例,本文研究了城市增长的一般次序和城市体系规模结构演化的动态模式。研究表明,城市增长呈现序贯模式,即发展条件较好的城市率先增长,然后较低位序的城市依次成为增长最快的城市。研究还揭示了与城市序贯增长相伴生的系列特征:城市规模分布“初级平衡型—初级首位型—高级平衡型”的倒“U”型演化特征、城市规模分布持续的分层特征、上截尾城市增长的条件收敛性。本研究结论将加深学术界对城市化和城市体系规模结构演化规律的理解,还将在制定有效的城市化政策和编制科学的城市规划实践中得到广泛的应用。
A study of sequential city growth pattern: Theoretical model and empirical evidence of U.S. urban system .https://doi.org/10.11821/dlxb201312004 Magsci [本文引用: 1] 摘要
城市体系演化动态规律的研究正逐渐成为城市地理学研究的热点。基于新经济地理学理论模型和美国城市体系演化的实证案例,本文研究了城市增长的一般次序和城市体系规模结构演化的动态模式。研究表明,城市增长呈现序贯模式,即发展条件较好的城市率先增长,然后较低位序的城市依次成为增长最快的城市。研究还揭示了与城市序贯增长相伴生的系列特征:城市规模分布“初级平衡型—初级首位型—高级平衡型”的倒“U”型演化特征、城市规模分布持续的分层特征、上截尾城市增长的条件收敛性。本研究结论将加深学术界对城市化和城市体系规模结构演化规律的理解,还将在制定有效的城市化政策和编制科学的城市规划实践中得到广泛的应用。
|

/
| 〈 |
|
〉 |
