胡刚 , 宋慧
, 宋慧
Hu Gang, Song Hui
中图分类号: S157
文献标识码: A
文章编号: 1000-0690(2016)04-0621-07
收稿日期: 2014-05-24
修回日期: 2014-08-30
网络出版日期: 2016-07-21
版权声明: 2016 《地理科学》编辑部 本文是开放获取期刊文献,在以下情况下可以自由使用:学术研究、学术交流、科研教学等,但不允许用于商业目的.
基金资助:
作者简介:
作者简介:胡刚(1976-),男,山东滨州人,博士,主要从事土壤侵蚀、环境演变、水土资源利用与3S应用研究。E-mail:geo_hug@126.com
展开
摘要
探讨了典型黑土区基于单位汇水面积的LS因子算法与传统基于径流路径长度算法的差异。研究表明,在研究区坡长坡缓的地形条件下,基于单位汇水面积的LS因子算法值普遍要大于基于径流路径长度算法的LS因子值;在有限的坡度范围内,不同算法的坡度因子相差不大,与之相比,不同算法的坡长因子值差别明显,特别是对于坡长指数采用定值的Govers算法更是如此。这说明在研究区坡长坡缓的地形条件下,坡长因子对LS因子算法的响应更为敏感。同时,侵蚀机理分析得出,坡长因子指数采用与坡度有关的变值更为合理,特别是在采用DEM进行大范围土壤侵蚀量预测时更应如此。
关键词:
Abstract
Topography factor is one of the main components for soil loss prediction in soil erosion model. Here topography factor includes slope length factor and slope gradient factor, which have been the emphasis and difficulty in related research. Although many of LS factor algorithms have been proposed in literatures, it is not yet clear for the differences between them. In this article, L factor is calculated based on the algorithm of Desmet,which evolved from the unit contributing catchment area. With S factor value calculated based on different algorithms, LS factors are presented, which are called the kind of LS factor from unit contributing catchment area. Then they are compared with the LS factor from modified AML program of Remortel. The AML program is designed to calculate the L factor based on the grid cumulative length in the runoff path. When compared to the LS factor value from modified AML program, the method of unit contributing catchment area yields broadly greater results. In the limited range of slope gradient in the study area, different methods yield similar slope factor values. In contrast, it is obvious for the difference of slope length factor from different algorithms. This is especially true for the algorithms of Govers, in which the slope length index is constant value. This indicated that with the condition of long slope length and low slope gradient in study area, different LS algorithms have more influence on the slope length factor. Meanwhile, through the analysis of soil erosion mechanism, we concluded that it’s more reasonable for the slope length factor index to use variable values related to slope gradient. With the introduction of the use of DEM in soil erosion prediction, it’s more possible to calculate the soil loss for a wide range of region. However, the calculation is based on cell, which means that the slope gradient is not the same for all cells, e.g. the slope of each cell has a larger range, esp. for the small area with large elevation difference. In this case, it’s especially true for the slope length index values to be variable values related to slope gradient.
Keywords:
地形因子是土壤侵蚀模型中的主要构成部分,也是目前研究的重点和难点。土壤侵蚀模型中的地形因子包括坡长因子(L)和坡度因子(S),坡长因子反映了土壤侵蚀量与坡长之间的量化关系[1],坡度因子则反映了坡度对侵蚀的影响[2]。通用土壤流失方程(USLE)及其修订版(RUSLE)中的L因子表示标准化到22.13 m坡长上的土壤侵蚀量[3]。
坡长为从地表径流源点到坡度减小至有沉积出现地方之间的距离,或到一个明显的渠道之间的水平距离[4]。坡长可以从野外直接测量,也可以通过等高线量算确定。RUSLE中一般用汇水渠道表示坡长结束的地方,由于地形图上一般没有标明汇水渠道,所以通过等高线确定的坡长一般过长[5]。随着数字制图技术的出现,利用DEM(Digital Elevation Model)计算坡长得到广泛应用。其中基于径流路径栅格累积提取坡长的算法思路为:在计算水流流向的基础上,定义局部高点作为坡长累计计算起点,根据水流来向和流向关系,由高到低,通过不断寻求径流结束点的方式,利用多重循环和迭代方法,完成对累计坡长的计算[6],该算法中以Hichy和Remortel的研究为代表[7]。国内学者以Remortel的AML程序为基础进行了改进和应用[8, 9]。
事实上,在真实的二维空间中,地表径流及其产生的土壤流失,不是决定于到分水岭或农田边界的距离,而是决定于单位等高线长度上的径流面积[10](简称为单位汇水面积)。由于受水流汇聚或分散的影响,单位汇水面积与坡长存在较大的差别。所以,土壤侵蚀模型中的地形因子计算仅考虑坡面纵向形态的影响还不全面,还要考虑坡面平面形态的影响,也就是要考虑径流汇聚程度的影响。现有研究中对于基于径流路径的LS因子值与基于单位汇水面积的LS因子值的差异研究尚不多见。为此,本文尝试对两者的差异及其区域特征进行探讨。
本研究所涉及区域位于黑龙江九三农垦鹤山农场鹤北流域中的2号小流域,该流域地理位置介
于125°16′12″E~125°18′7″E, 49°0′0.8″N~49°1′5.1″N,流域面积为3 km2。为研究方便,本文所讨论2号小流域为通过径流算法得到的纯自然流域,与受诸如机耕路、垄作方向等人类活动而使自然径流流向发生改变,并最终形成的流域形态稍有不同。该区是典型东北漫川漫岗地带,呈坡长坡缓的地形特征,海拔高度一般在400 m以下,相对高差≤100 m,坡度一般为1°~3°,大坡度在3°~6°之间。
该区域基本是在1949年后开始大规模开垦,尽管时间相对较短,但到目前为止侵蚀相当严重,据相关研究,该区的侵蚀速率达到了14.5 t/(hm2·a)[11],远超容许土壤流失量。研究区气候属寒温带大陆性半湿润气候,气温冷热相差悬殊,夏季最热月份在7月,平均气温20.8℃,最高气温可达37℃;冬季最冷在1月份,平均气温为-22.5℃,最低气温可达-43.7℃。初春温差较大,年均气温0.4℃左右。年降水量在500~550 mm间,降水年际变化大,分布不均,集中在7~9月份,占到全年的64%。本区漫岗基本都已开垦成耕地,耕种作物主要为大豆和小麦(Triticum aestivum),大豆(Glycine max)实行垄作耕种。由于难以做到完全等高起垄,所以往往造成顺(坡)垄沟状面蚀和断垄沟状侵蚀。
研究的总体思路为,在构建栅格DEM的基础上,分别计算基于单位汇水面积的LS因子值和基于径流路径栅格累积的LS因子值,并对两类算法计算值进行比较分析。
本研究所用栅格DEM是在1:1万地形图基础上矢量化所得,首先利用矢量化数据构建不规则三角网TIN,进而将其转化为栅格DEM。通过量算等高线间的间距,最终确定栅格DEM的分辨率为2 m。依据构建转化得到的栅格DEM,分别计算基于单位汇水面积和基于径流路径栅格累积两类不同算法LS因子值。
为对比分析两类不同算法差异,考虑到数据量,利用Hawths Tools工具在计算得到的LS因子栅格图上随机生成300个点,并提取其LS因子值。由于RUSLE极少使用超过305 m的坡长,加之本研究所用基于径流路径的坡长算法是根据RUSLE所得,因此,本研究中对于坡长超过305 m的随机点不予考虑,最终实际参与对比分析的随机点为291个。流域随机分布291点的坡度和坡长的最小值、最大值、平均值和标准偏差如表1所示。
表1 流域随机分布291点的坡度及坡长相关参数
Table 1 The related parameters of slope gradient and slope-length for randomly distributed 291 points
| 最小值 | 最大值 | 平均值 | 标准偏差 | |
|---|---|---|---|---|
| 坡度(%) | 0.26 | 12.67 | 4.13 | 1.52 |
| 坡长(m) | 1 | 303 | 101.56 | 86.40 |
本研究基于单位汇水面积的坡长因子计算,采用的是Desmet提出的算法[12],该算法以Foster[13]提出的不规则坡面坡长因子计算公式推演而来。地形因子中的坡度因子则分别采用Wischmeier[4]、McCool[14]、 Govers[15]、Nearing[16]等人的研究成果。上述坡度坡长因子的具体算法请参阅相应文献,在此不再赘述。对于基于单位汇水面积的地形因子而言,由于坡长因子和坡度因子分别来自于不同的研究成果,为表述方便,将LS因子算法的名称,以LS因子中所采用的坡度因子算法进行命名。研究中面积计算涉及到的流向算法,统一采用Quinn等提出的多流向算法(Multiple Flow)[17]。
基于径流路径栅格累计算法是在Remortel[7]的AML(arc macro language)程序基础上对相关参数修改得到。Remortel算法提取的坡长反应了侵蚀-沉积发生的空间位置,由于其简单易算而得到广泛的应用。目前Remortel的AML程序已经发展到第四版,不同版本的AML程序算法在坡长指数因子值的选取和坡度因子算法上有所不同。以其最新版第四版为例,代码反映出该版本m取值较之前版本更为精细,m值根据McCool等研究[18]并经局部内插得到。该版算法中的坡度因子,则是根据McCool等于1987年提出的S因子计算公式[19]得来。第四版AML程序中坡长指数(m)取细沟和细沟间侵蚀之比较低情况下的数值,而这仅适用于诸如草地和其他有覆盖的紧实土壤,这与本研究区细沟和浅沟较为发育不符,因此将m修正为RUSLE中采用的Foster等[20]的计算方法。
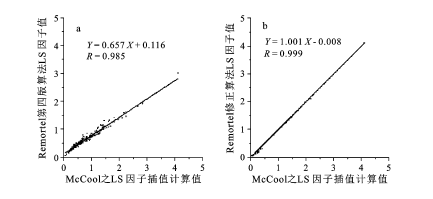
通过与McCool特定坡度坡长条件下的LS因子值的相关分析(如图1所示),发现Remortel修改算法与McCool的LS因子值的相关系数达到了0.999,而两者线性回归方程的斜率也近乎等于1(如图1b所示),可以看出两者近乎呈1:1的关系。与之相比,Remortel第四版AML原始程序算法与McCool之LS因子值的相关性尽管依然相对较高,达到了0.985(如图1a示),但从回归方程的斜率看则明显要小于相等坡度坡长条件下的McCool之值。究其原因,与Remortel第4版AML程序算法中坡长指数取值有关,其计算中采用的坡长指数(m)为细沟和细沟间侵蚀之比较低情形下的数值,而本研究采用的是在细沟和细沟间侵蚀比率中等情形下的坡长指数作为参照。通过与实测径流泥沙数据的对比,坡长指数采用RUSLE中Foster等[20]的方法计算结果与实测值结果吻合较好[21]。总之,无论从相关系数来看,还是从线性回归方程的斜率看,参数修正后的Remortel算法计算值明显要好于第四版原始算法计算值。
图1 Remortel修正算法和原始第四版AML算法值与McCool因子值对比
Fig.1 Comparison of LS factor value from the modified AML algorithm of Remortel and his original No.4 AML algorithm with the LS value from McCool
对流域整体而言,以单位汇水面积为基础得到的4种算法LS因子值存在明显差异,特别是Govers算法与其他3种算法在最大值、平均值及标准偏差间相差较大。与之相比,McCool、Wischmeier和Nearing算法计算值在流域值整体方面相差不大。从表2可以看出,无论地形因子的最大值、平均值还是标准偏差,根据Govers算法计算得到的流域LS因子值在4种算法中都是最大的,其流域最大值达到85.88,而McCool、Wischmeier、Nearing算法的流域最大值仅有不到Govers算法计算值的一半,如根据McCool算法计算得到的流域最大值是34.78,Nearing的最大值在三者中相对较大,也只有35.24。地形因子流域最大值在4种算法中最小的为Wischmeier算法,只有29.20。对于流域平均值而言,也呈现与流域最大值相类似的特征,所不同的是McCool算法计算值稍大于Nearing算法计算值(如表2所示)。标准偏差方面,也是Govers算法最大,其他3种算法相对较小。总之,对流域整体LS因子计算相关参数而言,4种算法中,Govers算法除去最小值外都远远高于其他3种算法计算值,对于McCool、Wischmeier和Nearing算法而言,流域整体计算值都相差不大。
表2 典型流域不同算法LS因子值流域参数值
Table 2 The parameters of LS from different algorithm for classic watershed of northeast China
| 最小值 | 最大值 | 平均值 | 标准偏差 | |
|---|---|---|---|---|
| Govers | 0 | 85.88 | 3.49 | 3.61 |
| Nearing | 0.05 | 35.24 | 1.43 | 1.13 |
| McCool | 0.03 | 34.78 | 1.57 | 1.12 |
| Wischmeier | 0.05 | 29.20 | 1.40 | 1.25 |
| Remortel修正算法 | 0.02 | 11.86 | 0.89 | 0.70 |
与前述基于单位汇水面积LS因子算法计算值相比,基于径流路径栅格累计的Remortel修改算法LS因子值,在流域最大值、平均值以及标准偏差上都要小于前者,仅仅只有最小值要高于Govers算法的最小值。
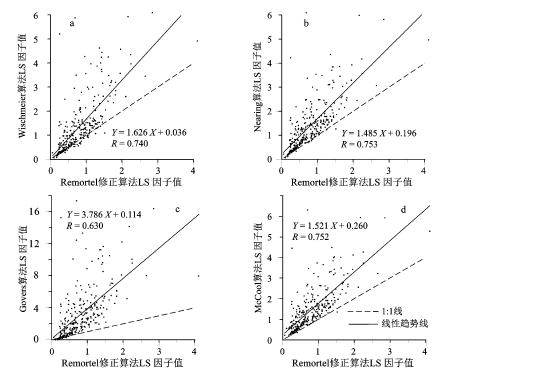
从图2中可以看到,4种算法中的点基本都位于1:1线以上,仅有Wischmeier和Nearing算法中,有少数点位于1:1线以下,但数量相当有限。这说明291点的4种算法计算值与参照值相比,基本上都要大于参照值。从回归趋势线的斜率来看,Nearing算法与参照值最为接近,其回归趋势线的斜率仅有1.485,其次依次为McCool算法及Wischmeier算法,偏离最大的为Govers算法计算值,回归线斜率达到了3.786。对于不同算法的相关性而言,McCool、Nearing及Wischmeier与参照值的相关性相差不大,最好的为Nearing算法计算值,相关系数达到了0.753,其次为McCool和Wischmeier算法,相关性最差的为Govers算法,相关系数只有0.630。
图2 不同算法LS因子值与Remortel修正算法计算值的比较
Fig.2 Comparison of reference value with calculated LS value from different algorithm
从以上分析可以看出,在其他因子相同的条件下,由基于单位汇水面积地形因子计算得到的土壤侵蚀量要大于由栅格累计算法得到的土壤侵蚀量。以往的径流小区实验基本都是围绕坡度和坡长展开,坡度、坡长与侵蚀量间的量化关系得到了实验数据的支持,而截至目前单位汇水面积与侵蚀量关系的实验研究尚未见相关报道。坡度和坡长参数,尤其是坡长的测量或计算有一定的不确定性和复杂性,尽管理论推导上看,单位汇水面积代替坡长具有一定的合理性,但从上面的分析可以看出,要确切的认识单位汇水面积得到的地形参数与侵蚀量的关系,还需进一步从试验得到的实测数据来分析。
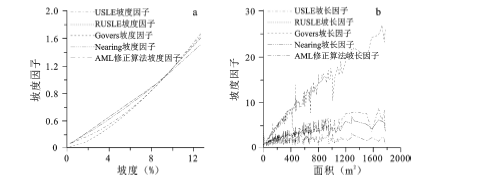
进一步分析L和S因子的影响(如图3示),可以看到在既定的流域坡度范围内,S因子随坡度的变化在不同算法间相差不大。与之形成鲜明对照的是,L因子随面积的变化则差异明显。此处需要说明的是,由于在计算基于单位汇水面积的LS因子时,除涉及面积参数外,还有修正因子,即与坡向相关的参数,故而其随着面积的增加并非呈现规则的递增趋势。在5种算法中,尤其以Gover的坡长因子算法变化最大,在相同的汇水面积条件下,Gover的L因子算法计算值要比其他四种算法计算值大几倍甚至十几倍之多。这说明在研究区坡长坡缓的地形条件下,不同LS因子算法对于坡长因子的影响更为明显。
图3 不同算法的坡度因子和坡长因子值
Fig.3 Slope length factor and slope steepness factor from different algorithm of USLE(Wischmeier), RUSLE(McCool), Govers, Nearing, and modified AML of Remortel
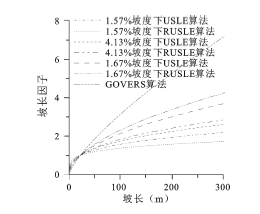
在4种算法LS因子计算中,除去Govers的L因子算法中坡长因子m为定值外,其他算法都为变值。由于Desmet不规则坡面L因子算法涉及坡度、坡向及面积等诸多因子,为简化相关参数具体分析坡长指数的影响,本文以基于径流路径的坡长为自变量,结合研究流域的坡度分布情况(如表3所示),将1.57%和4.13%及12.67%作为固定坡度(此处因3.97%和4.13%坡度条件下计算得到的坡长因子相差不大,故只采用4.13%的坡度进行分析),分析不同算法条件下,坡长因子L随坡长增加的变化情形。
in No 2 watershed
从图4可以看到,在坡长大于约22 m的坡面上,无论是RUSLE还是USLE中的坡长因子计算值,在等坡长条件下,坡长因子值都随着坡度的增加而增加;在坡长小于约22 m的坡面上,则正好相反,即在等坡长条件下,坡长因子值都随着坡度的增加反而减小。这说明在大于22 m的坡面上,等坡长条件下土壤侵蚀随着坡度的增加而增强,而在小于22 m的坡面上,则正好相反。RUSLE和USLE模型计算可以看出,坡长与侵蚀间关系的复杂性。
图4 基于USLE、RUSLE和Govers算法的不同坡度条件下的坡度因子
Fig.4 Slope length factor of USLE、RUSLE and Govers for different slope gradient
同时,从图4还可以看出,尽管USLE和RUSLE中的m取值有所不同,但在有限的坡长条件下,两者的差异相对有限。只不过,在大于22 m的坡面上,1.57%坡度下USLE算法坡长因子值大于等坡长条件下RUSLE中的坡长因子值,但在4.13%和12.67%坡度条件下,正好相反,RUSLE中的坡长因子值大于等坡长条件下USLE算法得到的坡长因子值。
对于坡长指数为定值的Govers算法而言,由于m为定值,所以不同坡度条件下由其计算得到的坡长因子不存在随坡度变化的情形,而且由于m值较大,由其计算得到的坡长因子值在大于22 m坡长的坡面上,都要远远大于USLE和RUSLE中L因子的计算值。
对于坡长因子的差异,一般可以通过直接比较坡长因子指数的大小来表示[3]。McCool等[14]通过对不同小区数据的总结得到,坡长指数一般变化于0~0.9之间,多集中于0.27~0.68间。国内学者在不同地区针对特定坡度和坡长小区,研究了地形因子与侵蚀量的量化关系。纵观国内相关研究,全国不同地区的坡长指数变化于0.14~0.46之间,在相同坡度级别条件下,中国学者得到的m值普遍低于美国所采用的坡长指数值,而且国内外的研究都得出坡长指数随坡度增加而增大的趋势[21]。而Govers采用的坡长指数为1.45,要大于绝大部分国外有关的研究数值。由此可见,对于坡面侵蚀而言,应用Govers算法的计算值要远远大于实际值,正如Govers所言,该算法更为适用于细沟侵蚀占比更高的坡面侵蚀预测[15]。
现有不同区域坡长与侵蚀量的试验研究,基本是在特定的坡度条件下进行,这也就意味着研究得出的坡长因子指数为定值,而如果坡度都采用定值的话,坡长因子则意味着土壤侵蚀只与坡长有关。从侵蚀机理来讲,坡度和坡长以及坡型坡向等地形因子共同决定了降水在汇集流动过程中能量转化能力。所以,如果就某一具体区域单纯从地形角度来讲,侵蚀机理分析可以看出,坡长因子指数采用与坡度有关的变值更为合理。当然,如果就不同区域而言,坡长指数m还要受到诸如土壤特性、地表植被类型和田间管理措施的影响[22],说明坡长指数存在着区域异质性和差异性。
信息技术的发展,使得运用DEM数据进行流域土壤侵蚀量预测成为现实。在具体应用中,计算是基于单个像元数据进行,而在整个流域中由于坡度存在非均一性,特别是对于面积有限而地形高差悬殊的流域来讲更是如此,这就使得应用定值坡长指数m的坡长因子计算受到限制。所以在对流域土壤流失量进行计算时,使用可变坡长指数m值计算坡长因子更为合理。
1) 在研究区坡长坡缓的地形条件下,基于单位汇水面积的地形因子计算值普遍要大于基于径流路径栅格累积的地形因子计算值。这也就意味着在其他因子相同的条件下,由前者计算得出的土壤侵蚀量要高于后者计算得到的侵蚀量。在现有坡长测量或计算具有不确定性和复杂性条件下,展开单位汇水面积与侵蚀量关系的试验研究尤为必要。
2) 坡度因子和坡长因子分别来看,研究区不同算法计算得到的坡度因子差别不大,与之相比,坡长因子则差异明显。这说明在研究区坡长坡缓的地形条件下,坡长因子对LS因子算法响应更为敏感。
3) 从不同算法坡长因子计算值来看,坡长因子指数为变值的坡长因子计算值间的差别不大,而对于坡长因子指数相对较大并为定值的Govers算法而言,其计算值则要远远大于其他算法的计算值。侵蚀机理分析认为,在应用DEM进行流域尺度地形因子计算时,坡长指数采用与坡度有关的变值更为合理。
The authors have declared that no competing interests exist.
| [1] |
Degree and length of land slope as it affects soil loss in runoff [J].
Doubling the degree of slope increased the total soil loss in run-on 2.61 times. Doubling the horizontal length of slope increased the total soil loss in run-off 3.03 times.
|
| [2] |
Weesies G A et al. PrediSoil Erosion by Water: A Guide to Conservation Planning with the Revised Universal Soil Loss Equation (RUSLE) [M]. |
| [3] |
Shi P J et al. Slope length effects on soil loss for steep slopes [J]. |
| [4] |
D D Smith. Predicting Rainfall Erosion Losses - A Guide to Conservation Planning. Agriculture Handbook No. 537 [M]. |
| [5] |
|
| [6] |
Slope angle and slope length solutions for GIS [J].https://doi.org/10.1080/00690805.2000.9714334 URL [本文引用: 1] 摘要
The Universal Soil Loss Equation has been used for a number of years to estimate soil erosion. One of its parameters is slope length, however, slope length has traditionally been estimated for large areas rather than calculated. Using data from regular grid DEMs, a method is described in this paper for calculating the cumulative downhill slope length. In addition, methods for calculating slope angle and downhill direction (aspect) are defined. Details of the algorithm and its associated advantages and disadvantages are discussed.
|
| [7] |
Estimating the LS factor for RUSLE through iterative slope length processing of digital elevation data within ArcInfo grid [J].https://doi.org/10.1080/00690805.2001.9714133 URL [本文引用: 2] 摘要
ABSTRACT A limitation of using the USLE and RUSLE soil erosion models at regional landscape scales has been the difficulty in obtaining an LS-factor grid suitable for use in GIS applications. Previous work resulted in an Arclnfo GRID AML program that allows the creation of a USLE-based LS factor grid using a DEM elevation dataset. This paper describes the additions and modifications applied to the previous AML code to produce a RUSLE-based version of the LS factor grid. These alterations included replacing the USLE algorithms with their RUSLE counterparts and redefining some of the assumptions made regarding slope characteristics. In areas of the Western USA where it was tested, the RUSLE-based AML program has produced LS values that are roughly comparable to those listed in the RUSLE Handbook guidelines.
|
| [8] |
区域土壤侵蚀定量评价中的坡长因子尺度变换方法 [J].
区域土壤侵蚀研究中,坡度、坡长只能基于中低分辨率DEM提取,但提取的坡度发生衰减,坡长发生扩张。以陕西省延安市及周边地区为研究区,利用国家测绘局生产的1∶25万数字地形图和研究区内典型地区1∶5万数字地形图,在ANUDEM软件支持下,建立了研究区50m分辨率和典型地区10 m分辨率的水文地貌关系正确DEM,利用直方图匹配原理对50m分辨率DEM上提取的坡度、坡长进行变换,并对变换前后坡度、坡长对土壤侵蚀强度的影响进行了评价分析。结果表明,经变换后的坡度整体变陡,坡长整体变短,变换后坡长平均值和累积频率曲线与高分辨率(10m)坡长均较接近,且其空间格局基本保持不变。利用中国土壤流失方程计算坡度坡长均不变换、只对坡度变换、只对坡长变换和坡度坡长均变换4种情况下的土壤侵蚀强度研究结果表明,只对坡长变换时土壤侵蚀强度有所减小,而只对坡度变换和坡度、坡长均变换时土壤侵蚀强度增大,且前者增大幅度较大。说明坡度衰减比坡长扩张对土壤侵蚀评价结果的影响更大,在实际应用中有必要对坡度和坡长都进行变换,以期为土壤侵蚀定量评价提供更加准确的数据支持。
Cheng Lin et al. Re-scaling method of slope length factor in the soil erosion assessment of regional scale.
区域土壤侵蚀研究中,坡度、坡长只能基于中低分辨率DEM提取,但提取的坡度发生衰减,坡长发生扩张。以陕西省延安市及周边地区为研究区,利用国家测绘局生产的1∶25万数字地形图和研究区内典型地区1∶5万数字地形图,在ANUDEM软件支持下,建立了研究区50m分辨率和典型地区10 m分辨率的水文地貌关系正确DEM,利用直方图匹配原理对50m分辨率DEM上提取的坡度、坡长进行变换,并对变换前后坡度、坡长对土壤侵蚀强度的影响进行了评价分析。结果表明,经变换后的坡度整体变陡,坡长整体变短,变换后坡长平均值和累积频率曲线与高分辨率(10m)坡长均较接近,且其空间格局基本保持不变。利用中国土壤流失方程计算坡度坡长均不变换、只对坡度变换、只对坡长变换和坡度坡长均变换4种情况下的土壤侵蚀强度研究结果表明,只对坡长变换时土壤侵蚀强度有所减小,而只对坡度变换和坡度、坡长均变换时土壤侵蚀强度增大,且前者增大幅度较大。说明坡度衰减比坡长扩张对土壤侵蚀评价结果的影响更大,在实际应用中有必要对坡度和坡长都进行变换,以期为土壤侵蚀定量评价提供更加准确的数据支持。
|
| [9] |
采用最大溯源径流路径法估算RUSLE模型中地形因子探讨 [J].
<p>采用基于AML的提取坡长值的新方法——最大溯源径流路径法,对贵州省毕节地区5个不同范围区域的DEM数据进行坡长值、地形因子的提取,并与基于AML的迭代累计坡长法和基于C<sup>++</sup>的迭代累计坡长法对提取坡长值的时间消耗、地形因子值进行了比较.结果表明:基于AML的最大溯源径流路径法能够实现修正的通用土壤流失模型(RUSLE)中坡长值、地形因子的提取,可达到与迭代累计坡长法相同的效果;与基于AML的迭代累计坡长法相比,该方法计算效率较高,大大减少了提取坡长值的时间消耗,可实现基于AML的坡长值、地形因子提取在大范围区域上的扩展;与基于C<sup>++</sup>的迭代累计坡长法相比,该方法计算时效和结果相当,程序编写简单,容易修改和调试,能更普遍应用于GIS用户.</p>
Liu Wenjun et al. Estimation of topographical factors in revised universal soil loss model based on maximum upstream flow path.
<p>采用基于AML的提取坡长值的新方法——最大溯源径流路径法,对贵州省毕节地区5个不同范围区域的DEM数据进行坡长值、地形因子的提取,并与基于AML的迭代累计坡长法和基于C<sup>++</sup>的迭代累计坡长法对提取坡长值的时间消耗、地形因子值进行了比较.结果表明:基于AML的最大溯源径流路径法能够实现修正的通用土壤流失模型(RUSLE)中坡长值、地形因子的提取,可达到与迭代累计坡长法相同的效果;与基于AML的迭代累计坡长法相比,该方法计算效率较高,大大减少了提取坡长值的时间消耗,可实现基于AML的坡长值、地形因子提取在大范围区域上的扩展;与基于C<sup>++</sup>的迭代累计坡长法相比,该方法计算时效和结果相当,程序编写简单,容易修改和调试,能更普遍应用于GIS用户.</p>
|
| [10] |
Landscape assessment of soil erosion and nonpoint source pollution [J]. |
| [11] |
169- |
| [12] |
A GIS procedure for automatically calculating the USLE LS factor on topographically complex landscape units [J].https://doi.org/10.1061/(ASCE)0733-9437(1996)122:5(319.2) URL [本文引用: 1] 摘要
A computer algorithm to calculate the USLE and RUSLE LS-factors over a two-dimensional landscape is presented. When compared to a manual method, both methods yield broadly similar results in terms of relative erosion risk mapping. However there appear to be important differences in absolute values. Although both method-yield similar slope values, the use of the manual method leads to an underestimation of the erosion risk because the effect of flow convergence is not accounted for. The computer procedure has the obvious advantage that it can easily be linked to GIS software. If data on land use and soils are available, specific K, C and P-values can be assigned to each land unit so that predicted soil losses can then be calculated using a simple overlay procedure. The algorithm leaves the user the choice to consider land units as being hydrologically isolated or continuous. A comparison with soil data showed a reasonably good agreement between the predicted erosion risk and the intensity of soil truncation observed in the test area.
|
| [13] |
Evaluating irregular slopes for soil loss prediction [J].https://doi.org/10.13031/2013.36846 URL [本文引用: 1] 摘要
ABSTRACT The effects of slope irregularities on soil erosion by water were analyzed on the basis of recent progress in mathematical simulation of the basic erosion processes. The report presents the analysis and extends it to field application. A technique is proposed for evaluating the universal soil-loss equation's topographic factor for irregular field or construction-site slopes. The technique also provides a means of evaluating the effects of differences in soil erodibility that may be associated with changes in slope steepness.
|
| [14] |
Revised slope length factor for the Universal Soil Loss Equation [J].https://doi.org/10.13031/2013.30576 URL [本文引用: 2] 摘要
ABSTRACT
|
| [15] |
Rill erosion on arable land in Central Belgium: Rates, controls and predictability [J].https://doi.org/10.1016/0341-8162(91)90013-N URL [本文引用: 2] 摘要
A survey was set up in Central Belgium in order to assess rill erosion rates on arable land. Mean rill erosion rate for all fields in the survey during a three year period was 0.36 kg/m2. Statistical analysis of the data allowed to calculate mean estimates for the slope and length exponent of 1.45 and 0.75 respectively. These results agree well with other data. Mean values should be used with caution as a rather important variation in slope and length exponents was found which could not be explained. Apart from topography, vegetation cover is by far the most important control on between-field variations in rill erosion rate. Other significant factors are soil texture, aggregate stability and, for silty soils, the state of the surface layer.
|
| [16] |
A single,continuous function for slope steepness influence on soil loss [J].https://doi.org/10.2136/sssaj1997.03615995006100030029x URL [本文引用: 1] 摘要
ABSTRACT Recently proposed relationships for the effect of slope steepness on soil loss by water are linear functions of the sine of the slope angle. The Revised Universal Soil Loss Equation (RUSLE) uses two such functions: one for slopes 9%. Recent research indicates that yet a different linear function is necessary for slopes greater than approximately 22%. The objective of this study was to develop a single slope steepness function that is representative of the data for all slopes. The resultant equation takes the form of a logistic function. It closely follows the RUSLE relationships for the slope steepness factor for slopes up to 22%, and also fits existing data for slopes greater than those from which the RUSLE relationships were derived.
|
| [17] |
Chevallier P et al. The prediction of hillslope flow paths for distributed hydrological modelling using digital terrain models [J]. |
| [18] |
|
| [19] |
Revised slope steepness factor for the Universal Soil Loss Equation [J].https://doi.org/10.13031/2013.30576 URL [本文引用: 1] 摘要
ABSTRACT A reanalysis of historical and recent data from both natural and simulated rainfall soil erosion plots has resulted in new slope steepness relationships for the Universal Soil Loss Equation. For long slopes on which both interrill and rill erosion occur, the relationships consist of two linear segments with a breakpoint at 9% slope. These relationships predict less erosion than current relationships on slopes steeper than 9% and slopes flatter than about 1%. A separate equation is proposed for the slope effect on short slopes where only interrill erosion is present. For conditions where surface flow over thaw-weakened soil dominates the erosion process, two relationships with a breakpoint at 9% slope are presented.
|
| [20] |
Meyer L, onstad C. A runoff erosivity factor and variable slope length exponents for Soil loss estimates [J]. |
| [21] |
|
| [22] |
Evaluation of factors in the soil-loss equation [J]. |

/
| 〈 |
|
〉 |