吴健生 , 毛家颖, 林倩
Wu Jiansheng, Mao Jiaying, Lin Qian
中图分类号: F292
文献标识码: A
文章编号: 1000-0690(2017)01-0028-09
通讯作者:
收稿日期: 2016-02-23
修回日期: 2016-05-26
网络出版日期: 2017-01-15
版权声明: 2017 《地理科学》编辑部 本文是开放获取期刊文献,在以下情况下可以自由使用:学术研究、学术交流、科研教学等,但不允许用于商业目的.
基金资助:
作者简介:
作者简介:吴健生(1965-),男,湖南新化人,教授,博导,主要从事城市化与生态环境研究。E-mail: wujs@pkusz.edu.cn
展开
摘要
基于“生态优先”理念,提出一种利用生境质量评估策略的城市增长边界划定方法。结合ArcGIS和InVEST模型,通过综合评估生境自身及其在威胁情境下的质量,模拟各市独立规划、建设用地指标再分配及区域一体化发展的三类建设用地扩张情景,分别划定2024和2034年的长三角地区城市增长边界。结果表明:研究区生境质量总体呈南高北低格局,平均生态系统服务价值密度为10 770.604元/(hm2·a),高质生境位于西南地区;根据指标再分配及一体化发展情景模拟的2024年研究区建设用地总量分别为10 583.273 km²和10 489.090 km²,2034年达到13 603.535 km²和13 252.370 km²;模拟的建设用地集中在东部沿海地区,并向北部及环杭州湾区域拓展;建设用地指标再分配能从整体上减少建设用地对优质生境的占用,区域一体化发展则能进一步降低城市发展造成的生态压力。
关键词:
Abstract
The world’s natural ecosystem provides products of 15 trillion pounds annually, but with the universal urban expansion caused by economic development, ecological balance is gradually disrupted. Therefore, it’s critical to maintain ecosystem stability in the identification of urban growth boundary, which is regarded as an effective tool to control urban sprawl. However, very few methods, currently, have taken ecosystem into their account. With the concept that “ecology goes first”, this article put forward a method to identify the urban growth boundary based on the evaluation of habitat quality. Using the platform of ArcGIS and InVEST model, two aspects of habitat quality were considered in the assessment: the quality of habitat itself and the quality under threats. As a representative of the former quality, ecosystem service value of each cell was calculated. As to the latter one, InVEST model was used to assess cells’ threatened degree. In the prediction of the amount of future construction land, three scenarios were developed. The first scenario was based on the assumption that cities had separate development and urban planning. The second scenario assumed that in spite of the separate planning, it’s possible to conduct the redistribution of construction land index. The third scenario ignored the boundaries of administrative jurisdiction and regarded the study area as a single. By selecting districts with lower habitat quality as construction land, the simulated urban growth boundary of the Yangtze River Delta in 2024 and 2034 were determined. The conclusions showed that habitat quality in the south of the Yangtze River Delta was overall higher than that in the north and the average density of ecosystem service values was 10 770.6 yuan/(hm²•yr). Habitat with higher quality was located in the southwest area, while the lower one was in the eastern district and Round Hangzhou Bay. By 2024, the predicted quantity of construction land have been to 10 583.27 km² (scenario 1 and 2) and 10 489.09 km² (scenario 3), and then have been to 13 603.53 km² (scenario 1 and 2) and 13 252.37 km² (scenario 3) by 2034. East coastal area would be the center of construction land, and the northern districts and Round Hangzhou Bay were considered to be the main expansion area. In order to avoid the occupation of construction land on habitats with higher quality as a whole, 9 cities were classified as emigration region of construction land index, and 5 cities were categorized as immigration area, and the left 2 cities were transition regions. Moreover, regional integration of the Yangtze River Delta could also helpfully mollify the contradictions between urban development and ecological protection. Policy recommendations on the identification of urban growth boundary were proposed at the end, while possible innovations and inadequacies of this article were also concluded.
Keywords:
随着城市化进程的不断加快,土地资源供需矛盾突出,城市边界无序扩张,生态系统服务能力的削弱和退化[1,2]已成为制约城市可持续发展的重要因素之一[3],因此如何确定适度的城市增长规模是当前城市研究的热点话题。其中,以“精明增长”和“新城市主义”为理论基础的城市增长边界(Urban Growth Boundary,UGB)备受关注,它是指通过划定城市土地和农村土地之间的界线,将合法的城市开发限定在一定区域内,从而控制城市的无序蔓延,在某种程度上是一种“不发展政策”[4,5]。自20世纪30年代英国伦敦的“绿带”政策,该理念已在多国得到了实践推广,如美国波特兰大都市区规划、日本“划线制度”、南非“城市藩篱”等[6~8]。中国对城市增长边界的引介可追溯至20世纪90年代末[9],研究重点由国外经验介绍转移至城市增长边界的中国化效能[10,11],并衍生出“规划七线”、“四区边界”、“城镇建设用地边界”等类似概念[12]。目前城市增长边界的两类划定方法,无论是基于人口预测和用地标准设定规模指标及进行空间布局[13,14],还是基于CA、Sleuth等模型进行城市增长的空间模拟[15~17],或只考虑经济、政策等非生态因素,或只以人均建设用地面积指标对“生态适宜性”原则进行侧面反映,对生态系统自身反馈的关注明显不足。因而,亟需将生态效应纳入城市规划实践,这不仅凸显了城市规划的全局综合效应,而且对维持城市复合系统的自然保育功能和实现可持续发展至关重要。
生态系统服务是指生态系统与生态过程中,人类赖以生存和发展的自然环境条件和效用[18~20],作为连接生态系统和人类福祉的桥梁,将其与城市增长边界划定相衔接,是生态研究接轨城市发展必不可少的一步。当前研究侧重于生态系统服务价值评估方法[21~23]、服务分类[24,25]、服务空间布局[26~28]及服务的形成和变化机理[29~31]等,大多关注生态系统服务本身的协调权衡及规划的生态效应评价,缺乏生态研究在城市规划中的先导性应用。本文从生态系统服务视角研究城市增长边界,构建基于“生态优先”理念的城市增长“生态边界”的划定方法,从而探讨生境质量影响最小化情境下的城市扩展路径,为长三角地区及全国其他类似区域的城市可持续发展提供科学支撑。
长三角地区是长江中下游平原的重要组成部分,选取经济地理意义上的狭义长三角地区为研究区,总面积约为115 399.31 km²,包含苏、浙、沪的16个城市[32](东经119°20′~122°32′,北纬28°14′~33°25′)。长三角地区地处北亚热带季风气候,地貌以平原为主体,在西部和南部间有低丘散布[33]。总体来看,南部主要分布为林地和草地,北部则以耕地居多,河网密布于整个区域,耕地、林地、草地和水域分别占研究区面积的52%、25%、3%和9%。作为中国第一大经济区及率先跻身于世界级城市群的地区,长三角地区的城市蔓延不仅挤占了生态用地,加剧了生境破碎化程度,还导致了一系列环境问题的产生,部分地区生态承载力已全面超载。城市增长累积的诸多负面效应已严重威胁长三角地区生态环境,并成为了地区可持续发展的主要障碍。
综合生境自身及在威胁情境下的质量,在生境质量评估基础上,分别设定2024、2034年城市建设用地需求情景,划定城市增长边界。
1.3.1 生境质量评估
1) 基于自身的生境质量定量评估
一般而言,生态系统服务价值量高的地类能为物种提供较好生境[34],故以生态系统服务价值量表征生境自身质量。参照中国生态系统服务价值当量因子表[35],以CPI指数修正后的460.67元/hm2作为单位当量因子的经济价值量,并针对研究区进行生物量因子修正[36],设定长三角地区与全国农田生态系统之比为1.76∶1.00,计算得到研究区林地、草地、耕地、水域等生态系统的单位面积生态服务价值量。生态用地存在集聚效应[37],基于GIS块状分析统计300 m×300 m栅格研究单元的生态系统服务价值量,生成研究区生境自身质量评价图。生物量因子修正公式如下:
式中,
2) 基于威胁的生境质量定量评估
生境质量一般随附近人类土地利用及其强度的加大而降低[38],故基于生境所受威胁的综合分析,采用InVEST(Integrated Valuation of Ecosystem Services and Tradeoffs)模型,评估生境在威胁情境下的质量。InVEST模型常用于生态系统服务定量评估,其中,生境质量(Habitat Quality)的衡量包含4个要素:各威胁的相对影响、各生境对各威胁因子的相对敏感性、生境与威胁源距离及土地受合法保护的水平。生境对威胁因子的敏感度越高,该因子对生境退化的影响越大,假定栅格x处的用地或生境类型为j,则该点受到的总威胁指数(Dxj)可表示为:
式中,r为威胁因子,R为威胁因子总量,y为威胁因子r栅格图层中的单个栅格,
式中,z和k为尺度常数,z=2.5,k为半饱和常数;
假定土地的法律保护处于有效状态,基于2010年30 m×30 m土地利用/植被覆盖图(Current Land Cover Map),界定耕地、林地、草地、水域为生态用地,提取建设用地、铁路、主要公路、次要公路、港口和航道等6类威胁因子图层(Threat Layers),结合文献查阅及专家访谈[39],确定威胁因子权重、威胁源对生态用地的最大影响距离(Threats Data)及生态用地对威胁因子的敏感度(Sensitivity of Land Cover Types to Each Threat)(表1)。
表1 长三角地区威胁数据表
Table 1 The threat data in the Yangtze River Delta
| 威胁源 | 权重 | 敏感度 | 最大影响距离(km) | |||
|---|---|---|---|---|---|---|
| 耕地 | 林地 | 草地 | 水域 | |||
| 建设用地 | 1 | 0.4 | 0.75 | 0.45 | 0.8 | 10 |
| 铁路 | 0.8 | 0.3 | 0.65 | 0.25 | 0.65 | 3 |
| 主要公路 | 1 | 0.2 | 0.55 | 0.15 | 0.55 | 5 |
| 次要公路 | 0.6 | 0.1 | 0.45 | 0.1 | 0.45 | 1 |
| 港口 | 1 | 0.4 | 0.8 | 0.45 | 0.8 | 10 |
| 航道 | 0.8 | 0.2 | 0.7 | 0.25 | 0.7 | 3 |
3) 生境质量综合评估
对以上两类评估结果分别进行极差标准化,以生境自身质量为基数,以生境在威胁情境下的质量表征生态用地受外部胁迫后的质量保存系数,通过乘积运算生成生境综合质量评价图。
1.3.2 情景设定及城市增长边界划定
建设用地量预测是城市增长边界划定的基础。以2006~2014年为基准,假定规划期内城乡人口比以指数模式增长,城乡人口比增长率与人口总规模增长率与历史平均增速保持一致,利用城乡人口增长率差法[40]和综合增长率法[41],分别模拟城市化率及常住总人口,结合人均城市建设用地量,预测2024及2034年城市建设用地量:
式中,
根据长三角地区一体化发展程度及建设用地指标再分配情况,设定三类规划情景。情景一:研究区一体化发展程度低,各市独立发展,在各市范围内分别进行建设用地量预测及用地分配,仅实现城市间边界的小范围融合;情景二:研究区一体化发展程度较低,各市仍独立发展,但可通过建设用地指标再分配方式调整城市边界,分别预测各市建设用地量,汇总后在长三角范围内进行用地分配;情景三:研究区一体化发展程度高,经济人口要素自由流动,基于长三角整体发展趋势进行建设用地总量预测,并在长三角范围内实现用地分配。
以不同情景的城市建设用地预测结果为阈值,选取生境质量低值斑块为建设用地。城市发展存在自身规律,为体现建设用地的空间集聚效应,同时模拟城市间边界融合现象,经建设用地结果矢量化及面积统计,剔除小于10 hm2的破碎化区域[46],并结合滤波分析,以八邻域的加权平均值重新定义中心栅格属性,对城市边界进行细微调整。
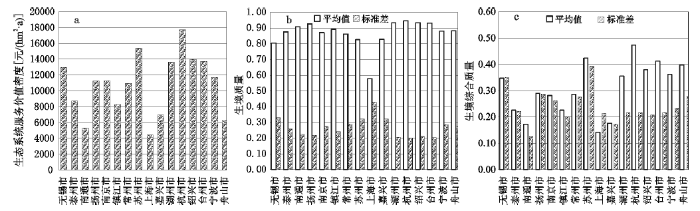
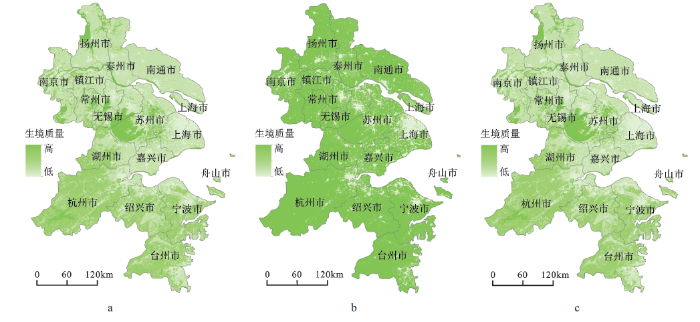
长三角地区平均生态系统服务价值密度(即单位面积的生态价值量)为10 770.6元/(hm2·a),并呈现显著的空间异质性(图1),其中杭州价值密度最高[17 694.3元/(hm2·a)],上海最低[4 417.28元/(hm2·a)](图1a),而受北耕南林的土地利用格局影响,南部生境自身质量普遍较高,水域集中地的生态集聚效应突出(图2a)。生境受威胁区域则主要分布在环杭州湾及东部沿海地区,低质生境呈现“块网结合”模式(图2b),相较而言,上海、无锡、苏州、嘉兴的建设、交通用地等生境威胁因子布局紧凑,生境受威胁程度较高,且内部异质性明显,而上海低质生境比例最大(图1b)。总体来看,长三角地区生境综合质量呈现南高北低态势,低质生境主要分布在西北及环杭州湾区域,高质生境则位于西南地区(图2c),杭州、苏州、台州的生境质量整体较高,上海生境质量最低,南通生境均质化程度最高,苏州生境质量分布最为不均(图1c)。
图1 生态系统服务价值密度(a)、基于威胁的生境质量(b)及生境综合质量(c)统计
Fig.1 Statistical graphs of ecosystem service values’ density (a), threatened-habitat quality (b) and comprehensive habitat quality (c)
图2 生境基于自身质量(a)、威胁质量(b)及综合质量(c)空间分布
Fig.2 Spatial distribution of self-habitat quality (a), threatened-habitat quality (b) and comprehensive habitat quality (c)
模拟建设用地扩张的3类情景分别以各市建设用地量、各市汇总后建设用地量及长三角建设用地量为阈值,相应的城市建设用地预测量如表2所示。2014~2024年,情景二和情景三的建设用地增加量分别为2 546.644 km²和2 452.462 km²,年均增长率为3.106%和3.003%,2024~2034年增加量上升为3 020.262 km²和2 763.280 km²,年均增长率则下降为2.829%和2.632%。20 a间,情景一的各市建设用地增长量有较大差异,其中上海市扩张最多(分别为691.578 km²和907.599 km²),而苏州市扩张最快(年均增长率分别为5.214%和4.752%)。
表2 3类情景下城市建设用地需求量预测
Table 2 The predicted urban construction land under three scenarios
| 情景 | 区域 | 2024年城市建设 用地需求量(km²) | 2034年城市建设 用地需求量(km²) | 情景 | 区域 | 2024年城市建设 用地需求量(km²) | 2034年城市建设 用地需求量(km²) |
|---|---|---|---|---|---|---|---|
| 情景一 | 上海 | 2864.578 | 3772.177 | 情景一 | 无锡 | 609.556 | 745.237 |
| 杭州 | 865.583 | 1097.031 | 常州 | 411.636 | 506.986 | ||
| 南京 | 831.589 | 1025.493 | 镇江 | 254.929 | 298.485 | ||
| 宁波 | 736.942 | 961.495 | 苏州 | 1238.989 | 1881.625 | ||
| 舟山 | 94.939 | 116.762 | 扬州 | 334.810 | 381.189 | ||
| 嘉兴 | 378.285 | 496.456 | 泰州 | 350.377 | 400.938 | ||
| 绍兴 | 387.417 | 477.447 | 南通 | 562.589 | 645.837 | ||
| 湖州 | 215.216 | 262.478 | 情景二 | 长三角地区 | 10583.273 | 13603.535 | |
| 台州 | 445.837 | 533.898 | 情景三 | 长三角地区 | 10489.090 | 13252.370 |
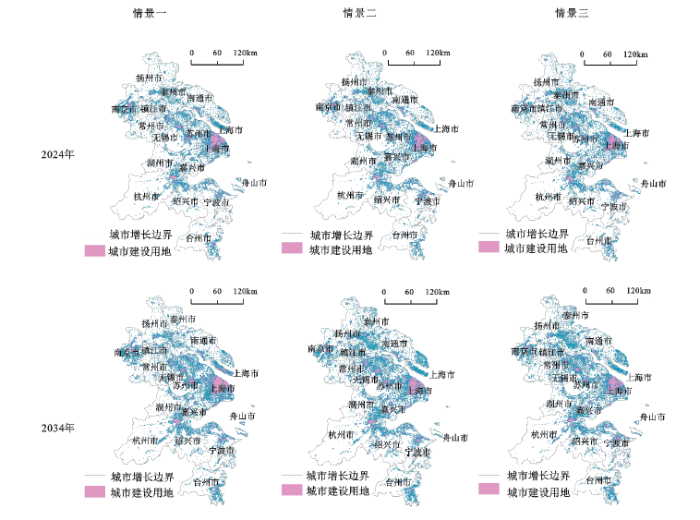
根据3类情景模拟的2024、2034年城市增长边界如图3所示,城市建设用地集中分布在东部沿海地区,并主要向北部及环杭州湾区域拓展。上海作为长三角枢纽城市,建设用地比例及集聚度显著高于其余各市。以省级行政边界为界的长三角北翼的建设用地规模明显高于南翼,但基于Fragstats4平台的建设用地破碎程度(PD、ED、AREA_MN、CONTAG)计算结果表明,南部地区破碎化程度较低,建设用地内部联系紧密,有利于产生聚集经济,促进城市公共物品的供给和土地利用结构的优化,推动城市的长远发展。江苏和浙江省内部建设用地同样呈现明显的分异特征,集聚程度与人口经济情况呈正相关,整体来看,苏南、浙北地区的建设用地比例及集聚度远高于苏中、浙南地区。在市域尺度上,上海市建设用地比例最高,南通最低,上海、常州、无锡、南京等市的城市发展均较为集聚。
图3 长三角地区不同规划情景下2024、2034年城市增长边界
Fig.3 The simulated urban growth boundary of the Yangtze River Delta in 2024 and 2034 under three scenarios
与情景一相比,情景二的边界模拟结果考虑各市生境质量差异,实现了长三角地区生态均衡状态下的建设用地布局,整体上降低了建设用地的生态负面影响。对比不同情景用于划定建设用地的生态门槛,可将长三角地区划分为建设用地指标迁出区、迁入区及迁出-迁入过渡区,进行建设用地指标的再分配。情景二的生态门槛由2024年的0.045上升到2034年的0.083,表明建设用地需求量的增加使生态压力不断加大。而情景一中,上海、杭州、南京、舟山、苏州等5市的生态门槛始终超过同期情景二取值,舟山高达0.174,说明在该区域进行建设用地布局需以更多的优质生境为代价,为缓解建设用地指标与生态保护的矛盾,应将其划为建设用地指标迁出区;宁波、嘉兴、绍兴、湖州、镇江、无锡、常州、扬州、泰州等9市的生态门槛则持续低于同期情景二结果,以嘉兴最低(由2024年的0.006上升至2034年的0.024),说明该区可作为建设用地指标迁入区,进行建设用地的大规模拓展,其中嘉兴市拓展潜力最大;台州、南通两市则随建设用地需求的扩大,由指标迁出区转变为迁入区。情景三基于长三角一体化发展理念,所需建设用地总量最少,且同样实现了指标的再分配,降低了生态负面总效应,说明人口经济要素的自由流动能够进一步缓解生态压力。
研究以长三角地区为例,结合生态系统服务价值量、InVEST模型生境质量模块和GIS技术,基于生境质量评价结果,分别划定了2024和2034年3类规划情境下的研究区城市增长边界。结果表明,长三角地区平均生态系统服务价值密度为10 770.604元/(hm2·a),生境质量总体呈南高北低格局,内部异质性显著,高质生境位于西南地区,低质生境则以“块网结合”模式位于西北及环杭州湾区域。根据情景二和情景三模拟得到2024年长三角建设用地总量分别为10 583.273 km²和10 489.090 km²,并在2034年达到13 603.535 km²和13 252.370 km²,建设用地集中分布在东部沿海地区,并向北部及环杭州湾区域拓展,研究区北部建设规模较大,但南部集聚效应更为明显,苏南、浙北的建设用地规模及集聚度远高于苏中、浙南地区。而由于各地经济发展与生态保护的矛盾存在空间差异,通过建设用地指标再分配的方式,从整体上减少建设用地对优质生境的占用,将嘉兴、宁波、绍兴、湖州、镇江、无锡、常州、扬州、泰州等9市划为建设用地指标迁入区,上海、杭州、南京、舟山、苏州等5市为指标迁出区,并设定台州和南通两市为指标的迁出-迁入过渡区。在此基础上,推动长三角一体化发展、实现人口及经济要素在空间上的自由流动能够进一步降低建设用地需求量,从而缓解城市发展造成的生态压力。
城市发展与生态保护历来是研究热点话题,本文尝试基于“生态优先”理念划定城市增长边界,避免了政策及招商引资等随机事件的反向控制,较传统边界划定方法而言更符合城市增长边界的概念内核。而结合InVEST模型及生态系统服务价值量修正策略,方法还为在大尺度上定量化识别生态重点保育区域提供了可能,突破了传统经验主义识别的尺度局限性,且提高了评估准确度。研究所得的生境质量及边界划定的可视化结果能够为长三角地区制定大范围的生态保护政策及城市发展规划提供科学支撑,在此基础上的建设用地指标再分配及长三角一体化发展情景的模拟与对比则进一步探讨了“更优的”城市扩展路径。然而,研究模拟的规划情景均为理想状态,在实际边界划定过程中,跨省用地协调显然困难重重,因此亟需配合开展更为深入的地区协调发展研究,结合经济、人口等相关配套政策,保障和加快要素的自由流动。
作为“一带一路”政策的重要战略区域,长三角地区的城市建设用地布局将随国家重大基础设施分布而进行动态调整,因此将政策这一要素纳入情景模拟中,形成更具弹性的城市增长边界,将更符合城市实际发展情景。本文从城市建设用地“开源”问题出发,探讨的是如何避免建设用地对“优质生境”的占用,从而降低城市发展的生态负面效应,但事实上,更重要的举措在于控制建设用地需求量及提高土地利用效率,促进城市的“精明增长”。此外,本研究将维持生态完整性视作城市发展的先决条件,设定生境质量为建设用地量化的主导要素,而值得注意的是,城市扩张与生态保护常处于一种博弈状态,当生态环境保护抑制了社会经济发展时,生态必然让步。因此,如何从科学决策角度出发,在保障重点生态区域的基础上,构建同时融合多重要素的量化模型,从而协调出一种实现社会、经济、生态综合效益最大化的优化格局,仍需不断探索。
The authors have declared that no competing interests exist.
| [1] |
太湖流域重污染区土地利用变化对生态系统服务价值的影响 [J].
通过对太湖流域重污染区1999 年、2007 年遥感影像数据解译结果的分析,获取了太湖流域重污染区主要土地利用类型的信息,分析了8 a 来研究区内土地利用与覆被变化趋势,对区域土地利用类型的生态系统服务价值进行评估。结果表明,1999~2007 年,太湖流域重污染区内耕地面积从2 033.53 km<sup>2</sup>减少到1 401.04 km<sup>2</sup>,而林地、建设用地、园地、水域总体呈增加的趋势,其中减少的耕地主要转化为建设用地。1999~2007 年太湖流域重污染区的生态系统服务价值呈减少趋势,土地利用变化使研究区生态资产减少了2.40 亿元,除气体调节和原材料以外,各单项服务功能的价值量均呈现递减的趋势。
Effects of Land Use Change on Ecosystem Service Value in the Heavy Polluted Area in Taihu Lake Basin.
通过对太湖流域重污染区1999 年、2007 年遥感影像数据解译结果的分析,获取了太湖流域重污染区主要土地利用类型的信息,分析了8 a 来研究区内土地利用与覆被变化趋势,对区域土地利用类型的生态系统服务价值进行评估。结果表明,1999~2007 年,太湖流域重污染区内耕地面积从2 033.53 km<sup>2</sup>减少到1 401.04 km<sup>2</sup>,而林地、建设用地、园地、水域总体呈增加的趋势,其中减少的耕地主要转化为建设用地。1999~2007 年太湖流域重污染区的生态系统服务价值呈减少趋势,土地利用变化使研究区生态资产减少了2.40 亿元,除气体调节和原材料以外,各单项服务功能的价值量均呈现递减的趋势。
|
| [2] |
白洋淀流域生态系统服务评估及其调控 [J].https://doi.org/10.5846/stxb201203270417 Magsci [本文引用: 1] 摘要
政策制定者在制定土地利用相关政策时需要权衡各方面的利益关系,协调资源保护和经济发展之间的关系。由于缺乏有效的评价与权衡办法,目前对这方面研究还较少。采用InVEST模型,评价了白洋淀流域7种服务功能指标,分析了其空间分布特征。通过情景(政策情景与保护情景)分析,较好的反映了农业直接经济收入与服务功能之间的关系。结果表明:生物多样性、水源涵养、土壤保持和固碳重要区域主要分布在流域西部、北部和流域中部山区;水质保护和授粉重要区域主要分布于流域东部、南部和中部平原区。政策情景下,产水量第二,农业产出有所下降,固碳能力较保护模式差,N/P输出最少。保护情景下产水量最大,农田产出价值不变,氮磷保持与政策情景差不多,但固碳效果最好。通过权衡不同情景下服务功能得失,筛选既不损害流域居民实际经济收入,又能使得水文服务功能得到提高的管理模式。研究表明InVEST模型可以很好的用于对自然资本评估和空间化特征分析,通过建立不同情景,评价结果可以用于权衡不同管理策略下服务功能得失,是一种评价和预测自然资本变化的有效方法,对政策制定和策略筛选具有重要的指导意义。
Ecosystem services valuation and its regulation in Baiyangdian basin: Based on InVEST model. https://doi.org/10.5846/stxb201203270417 Magsci [本文引用: 1] 摘要
政策制定者在制定土地利用相关政策时需要权衡各方面的利益关系,协调资源保护和经济发展之间的关系。由于缺乏有效的评价与权衡办法,目前对这方面研究还较少。采用InVEST模型,评价了白洋淀流域7种服务功能指标,分析了其空间分布特征。通过情景(政策情景与保护情景)分析,较好的反映了农业直接经济收入与服务功能之间的关系。结果表明:生物多样性、水源涵养、土壤保持和固碳重要区域主要分布在流域西部、北部和流域中部山区;水质保护和授粉重要区域主要分布于流域东部、南部和中部平原区。政策情景下,产水量第二,农业产出有所下降,固碳能力较保护模式差,N/P输出最少。保护情景下产水量最大,农田产出价值不变,氮磷保持与政策情景差不多,但固碳效果最好。通过权衡不同情景下服务功能得失,筛选既不损害流域居民实际经济收入,又能使得水文服务功能得到提高的管理模式。研究表明InVEST模型可以很好的用于对自然资本评估和空间化特征分析,通过建立不同情景,评价结果可以用于权衡不同管理策略下服务功能得失,是一种评价和预测自然资本变化的有效方法,对政策制定和策略筛选具有重要的指导意义。
|
| [3] |
Spatial congruence between biodiversity and ecosystem services in South Africa [J].https://doi.org/10.1016/j.biocon.2008.11.009 URL [本文引用: 1] 摘要
Ecosystems services sustain humans all over the world. The unsustainable use of ecosystem services around the world has led to widespread degradation which now threatens human health and livelihoods. Although the maintenance of ecosystem services is often used to justify biodiversity conservation actions, it is still unclear how ecosystem services relate to different aspects of biodiversity and...
|
| [4] |
Defining and characterizing urban boundaries:A fractal analysis of the theoretical cities and Belgian cities [J].https://doi.org/10.1016/j.compenvurbsys.2013.07.003 URL [本文引用: 1] 摘要
Abstract In this paper we extract the morphological boundaries of urban agglomerations and characterize boundary shapes using eight fractal and nonfractal spatial indexes. Analyses were first performed on six archetypal theoretical cities, and then on Belgium 18 largest towns. The results show that: (1) the relationship between the shape of the urban boundary (fractal dimension, dendricity, and compactness) and the built morphology within the urban agglomeration (fractal dimension, proportion of buildings close to the urban boundary) is not straightforward; (2) each city is a unique combination of the morphological characteristics considered here; (3) due to their different morphological characteristics, the planning potential of Flemish and Walloon cities seems to be very different.
|
| [5] |
Evaluating the effectiveness of urban growth boundaries using human mobility and activity records [J].https://doi.org/10.1016/j.cities.2015.05.001 URL [本文引用: 1] 摘要
Abstract We proposed a methodology to evaluate the effectiveness of Beijing’s Urban Growth Boundaries (UGBs) using human mobility and activity records (big data). The research applied data from location check-in, transit smart card, taxi trajectory, and residential travel survey. We developed four types of measures to evaluate the effectives of UGBs in confining human activities and travel flows, to examine the conformity of urban activities with the planned population, and to measure the activity connections between UGBs. With the large proportions of intra- and inter-boundary travel flows and an overwhelming majority of check-ins inside the UGBs, the research concluded that Beijing’s UGBs were effective in containing human mobility and activity. However, the connections between UGBs, indicated by the spatial differentiation of the travel flows, were not consistent with the plan’s intention and strategy. It indicated the potential underdevelopment of the public transit serving several new cities.
|
| [6] |
The effects of Portland's urban growth boundary on housing prices [J].https://doi.org/10.1080/01944360608976742 URL [本文引用: 1] 摘要
Abstract Unlike previous studies, which used metropolitan level data, this study uses spatially disaggregated data (block group data from the U.S. Census) to statistically test the effects of Portland's urban growth boundary (UGB) on housing prices. This analysis shows no evidence of a significant difference between housing prices inside and outside the UGB, suggesting that both inside and outside the UGB are parts of a single housing market.
|
| [7] |
Impacts of urban growth boundary versus exclusive farm use zoning agricultural land use [J].https://doi.org/10.1177/1078087407302235 URL 摘要
ABSTRACT This study compares net impacts of developmental potentials, externalities, and uncertainties associated with the urban growth boundary (UGB) with those of certainty and tax savings in the exclusive farm use (EFU) districts on land values in Portland, OR, using a hedonic Thünian econometric model. Using a geographic information systems—based data set of Christmas tree and horticultural farms, value effects of the urban growth boundary were found to vary by farm size, land use, and proximity to urban activities. The results suggested that proximity to negative externalities associated with urban activities had strong impacts on farming within the UGB. These impacts overweighed advantages associated with tax savings and increasing certainty within EFU districts.
|
| [8] |
An urban growth boundary model using neural networks, GIS and radial parameterization: An application to Tehran, Iran [J].https://doi.org/10.1016/j.landurbplan.2010.10.007 URL [本文引用: 1] 摘要
Urban growth boundaries (UGBs) are common tools employed by planners to constrain urban expansion in order to increase density of urban services and protect surrounding rural landscapes. Planners could use models that estimate future urban growth boundaries based on those factors that drive urban expansion. Unfortunately, few models have been developed that simulate the urban growth boundary. This paper presents an urban growth boundary model (UGBM) which utilizes artificial neural networks (ANN), geospatial information systems (GIS) and remote sensing (RS) to simulate the complex geometry of the urban boundary of Tehran, Iran. Raster-based predictive variables are used as inputs to the ANNs parameterized using vector routines. ANNs were used to train on seven predictor variables of urban boundary geometry for Tehran: roads, green spaces, slope, aspect, elevation, service stations, and built-area. We show that our UGBM can predict urban growth boundaries with urban area with 80 84% accuracy. The model predicts urban boundaries in all cardinal directions equally well. We use the model to predict urban growth to the year 2012. We summarize the use of UGBs in planning around the world and describe how this model can be used to assist planners in developing future urban growth boundaries given the need to understand those factors that contribute toward urban expansion.
|
| [9] |
|
| [10] |
城市增长边界的理论探讨与应用 [J].
本书分为6章,内容包括:城市增长边界的内涵及运行机制、城市增长边界的相关理论、城市增长边界的划定和调整方法、城市增长边界的实施评价、城市增长边界扩展的机制选择。
Wei Shichuan et al. Research on urban growth boundary: Theoretical analysis and its application in China.
本书分为6章,内容包括:城市增长边界的内涵及运行机制、城市增长边界的相关理论、城市增长边界的划定和调整方法、城市增长边界的实施评价、城市增长边界扩展的机制选择。
|
| [11] |
关于新版《城市规划编制办法》中城市增长边界的思考 [J].https://doi.org/10.3969/j.issn.1006-0022.2008.06.003 URL [本文引用: 1] 摘要
2006年新版的《城市规划编制办法》明确提出在城市总体规划纲要及中心城区规划中要划定“城市增长边界”,用以限制城市的发展规模和划定城市的建设范围。划定城市增长边界是西方国家在对城市蔓延式发展反思过程中提出的一种技术解决措施和空间政策响应,当前已成为美国控制城市蔓延发展最成功的技术手段和政策工具之一。我国与美国在发展阶段、土地制度、政治制度方面均存在差异,为了确保城市增长边界概念引入后与现有规划体制相适应,应坚持区域统筹发展原则,选择合理的城市发展模式,改变传统城市建设用地边界线的确定模式,保障城市增长边界的实效性。
Reflection on urban growth boundary in the new urban planning formulation means. https://doi.org/10.3969/j.issn.1006-0022.2008.06.003 URL [本文引用: 1] 摘要
2006年新版的《城市规划编制办法》明确提出在城市总体规划纲要及中心城区规划中要划定“城市增长边界”,用以限制城市的发展规模和划定城市的建设范围。划定城市增长边界是西方国家在对城市蔓延式发展反思过程中提出的一种技术解决措施和空间政策响应,当前已成为美国控制城市蔓延发展最成功的技术手段和政策工具之一。我国与美国在发展阶段、土地制度、政治制度方面均存在差异,为了确保城市增长边界概念引入后与现有规划体制相适应,应坚持区域统筹发展原则,选择合理的城市发展模式,改变传统城市建设用地边界线的确定模式,保障城市增长边界的实效性。
|
| [12] |
|
| [13] |
基于非建设用地的城市用地规模及布局 [J].https://doi.org/10.3969/j.issn.1000-3363.2008.04.012 URL [本文引用: 1] 摘要
采取先从划定非建设用地入手的规划方法,尽可能全面涵盖和明确城市非建设用地的范围,反推有限土地可以承载的人口规模,这种方法取得了较为实际的理想效果。它除了应用在城市总体规划编制中,还丰富了城市规划理论,可供城市总规修编时参考。
The scale and allocation of urban land use based on land unfit for construction. https://doi.org/10.3969/j.issn.1000-3363.2008.04.012 URL [本文引用: 1] 摘要
采取先从划定非建设用地入手的规划方法,尽可能全面涵盖和明确城市非建设用地的范围,反推有限土地可以承载的人口规模,这种方法取得了较为实际的理想效果。它除了应用在城市总体规划编制中,还丰富了城市规划理论,可供城市总规修编时参考。
|
| [14] |
中国当前非城市建设用地规划研究的进展与思考 [J].https://doi.org/10.3969/j.issn.1000-3363.2007.01.008 URL [本文引用: 1] 摘要
非城市建设用地规划与城市增长管理是一个问题的两个方面.在总结 中国多个城市非城市建设用地规划的实践进展的同时,从概念、目标、内容、方法以及实施等角度归纳当前关于非城市建设用地的相关研究成果.进而对当前非城市 建设用地规划与研究的总体进展进行分析、评价,并深入思考研究的进一步发展方向与内容.
The total progress on the planning study for the land out of urban constructing in China. https://doi.org/10.3969/j.issn.1000-3363.2007.01.008 URL [本文引用: 1] 摘要
非城市建设用地规划与城市增长管理是一个问题的两个方面.在总结 中国多个城市非城市建设用地规划的实践进展的同时,从概念、目标、内容、方法以及实施等角度归纳当前关于非城市建设用地的相关研究成果.进而对当前非城市 建设用地规划与研究的总体进展进行分析、评价,并深入思考研究的进一步发展方向与内容.
|
| [15] |
基于多智能体系统的城市增长时空动态模拟——以江苏省连云港市为例 [J].Simulation of Spatio-temporal Dynamical Change of Urban Growth Based on Multi-agent System: Case Study of Lianyungang City, China. |
| [16] |
基于空间模型和CA的城市用地扩展模拟研究——以大庆市为例 [J].URL 摘要
基于ArcGIS空间分析建模工具,将城市发展适宜性模块、邻域影响模块、约束影响模块、随机影响模块进行集成,实现CA模型的构建,并以大庆市为例对城市建设用地未来发展进行模拟。研究认为:(1)将GIS空间分析和CA模型集成,模型结构清晰,避免二次程序开发;(2)根据大庆市特点,考虑资源开发因素对城市发展的影响和人口增长对随机因素的影响;(3)大庆市2015、2020年城市面积将继续扩展,城市重心将明显向北移动,并具有向东移动的趋势。
Urban Expansion Simulation Using GIS Spatial Analysis and Cellular Automata—A Case Study in Daqing City. URL 摘要
基于ArcGIS空间分析建模工具,将城市发展适宜性模块、邻域影响模块、约束影响模块、随机影响模块进行集成,实现CA模型的构建,并以大庆市为例对城市建设用地未来发展进行模拟。研究认为:(1)将GIS空间分析和CA模型集成,模型结构清晰,避免二次程序开发;(2)根据大庆市特点,考虑资源开发因素对城市发展的影响和人口增长对随机因素的影响;(3)大庆市2015、2020年城市面积将继续扩展,城市重心将明显向北移动,并具有向东移动的趋势。
|
| [17] |
基于Logistic-CA-Markov的土地利用景观格局变化——以京津冀都市圈为例 [J].
以京津冀都市圈为例,运用马尔科夫转移矩阵、景观格局指数和Logistic-CA-Markov耦合模型等,对各地类转移情况、景观格局特征、影响因子和未来变化趋势进行分析和多情景模拟。结果表明:①景观水平上,总体景观破碎化程度加大。类型水平上,耕地、草地和林地是主导优势地类。②1985~2000年之间,耕地主要流向城乡居民点及工矿用地、水域和林地;城乡居民点及工矿用地的增加主要来自于耕地、草地、林地。③各个地类的分布均与原有地类的距离密切相关。④对土地利用变化设置三个模拟情景,按情景1,1985~2030年耕地、林地、草地、未利用地均不同程度减少;城乡居民点及工矿用地、水域明显增加,表明这期间城市化进程明显加快,建设用地不断占用周围的耕地。
The Changes of Land Use and Landscape Pattern Based on Logistic-CA-Markov Model—A Case Study of Beijing-Tianjin-Hebei Metropolitan Region.
以京津冀都市圈为例,运用马尔科夫转移矩阵、景观格局指数和Logistic-CA-Markov耦合模型等,对各地类转移情况、景观格局特征、影响因子和未来变化趋势进行分析和多情景模拟。结果表明:①景观水平上,总体景观破碎化程度加大。类型水平上,耕地、草地和林地是主导优势地类。②1985~2000年之间,耕地主要流向城乡居民点及工矿用地、水域和林地;城乡居民点及工矿用地的增加主要来自于耕地、草地、林地。③各个地类的分布均与原有地类的距离密切相关。④对土地利用变化设置三个模拟情景,按情景1,1985~2030年耕地、林地、草地、未利用地均不同程度减少;城乡居民点及工矿用地、水域明显增加,表明这期间城市化进程明显加快,建设用地不断占用周围的耕地。
|
| [18] |
|
| [19] |
Change in ecosystem service values in the San Antonio area,Texas [J].https://doi.org/10.1016/S0921-8009(01)00250-6 URL 摘要
San Antonio is one of the fastest growing metropolitan areas in the USA. Urban sprawl may significantly impact ecosystem services and functions but such effects are difficult to quantify and watershed-level estimates are seldom attempted. The objective of the study reported here was to determine whether LANDSAT MSS could be used to quantify changes in land-use and ecosystem services due to urban sprawl in Bexar County, TX, in which San Antonio is centered. The size of six land cover categories in the summer of 1976, 1985, and 1991 were estimated in the 141?671 ha of three watersheds in Bexar County. Coefficients published by Costanza and co-workers in 1997 [Nature 387 (1997) 253] were used to value changes in ecosystem services delivered by each land cover category, and a sensitivity analysis was conducted to determine the effect of manipulating these coefficients on the estimated values. Although we estimated that there was a 65% decrease in the area of rangeland and a 29% increase in the area of urbanized land use between 1976 and 1991, there appeared to be only a 4% net decline in the estimated annual value of ecosystem services in the study area (i.e. $5.58 haper year, with a 15-year cumulative total value of $6.24 million for the whole study area). This relatively small decline could be attributed to the neutralizing effect of the estimated 403% increase in the area of the woodlands, which were assigned the highest ecosystem value coefficient. When we assumed that the shift of rangelands to woodlands produced no net change in the value of ecosystem services per hectare, the estimated annual ecosystem service value declined by 15.4% ($23.22 haper year) between 1976 and 1991. When conducting time-series studies of ecosystem services, it is important to identify parallel changes in land cover types in order to quantify the potentially neutralizing influence of positive land cover changes on the negative effects of urban sprawl on ecosystem services.
|
| [20] |
The evolution of ecosystem services: A time series and discourse-centered analysis [J].https://doi.org/10.1016/j.envsci.2015.04.025 URL [本文引用: 1] 摘要
The concept of ecosystem services is becoming increasingly influential in environmental research and policy reshaping human nvironment interactions. In this paper, we trace the rapid growth of ecosystem services across academic disciplines and amongst organizations at the boundary of science and policy. We approach ecosystem services as an evolving discourse and track its evolution across key institutional time frames. The review shows how the concept emerged in the United States as an economic and ecological response to ecosystem degradation, and has since expanded to incorporate a wide array of disciplinary perspectives across multiple countries. A discursive-institutional analysis identifies four key moments when ideas and initiatives from academia and policy became institutionalized. Using a spiral metaphor, we argue such moments shape subsequent research, policy and practice. The foundations of economics and ecology remain dominant, however there are emerging opportunities for other disciplines who have been marginal to this discourse up until now to contribute to what is becoming an increasingly powerful and global concept. We argue that social scientists must become more involved to ensure issues of poverty, justice, equality, differentiated wellbeing, governance, rights, and marginality are to influence the next institutional spiral of this important and influential discourse.
|
| [21] |
Assessing, valuing, and mapping ecosystem services in Alpine forests [J].https://doi.org/10.1016/j.ecoser.2015.03.001 URL [本文引用: 1] 摘要
Forests support human economy and well-being with multiple ecosystem services. In this paper, the ecosystem services generated in a mountainous forest area in North Italy were assessed in biophysical and monetary units. GIS was used to analyze and visualize the distribution and provision of different services. The assessment of ecosystem services in biophysical units was an important step to investigate ecosystem functions and actual service flows supporting socio-ecological systems. The Total Economic Value (TEV) of all the investigated ecosystem services was about 3302M/yr, corresponding to 82002/ha/yr. The provisioning services represented 40% of the TEV while the regulating and cultural services were 49% and 11%. The service of hydrogeological protection, particularly important in areas characterized by a high risk of avalanches and landslides, showed a major importance among the regulating services (81%) and within the TEV (40%). Results from mapping ecosystem services were useful in identifying and visualizing priority areas for different services, as well as exploring trade-offs and synergies between services. Finally, we argue that while a biophysical perspective can ensure a solid accounting base, a comprehensive economic valuation of all categories of forest ecosystem services can facilitate communication of their importance to policy makers.
|
| [22] |
Assessment of ecosystem integrity and service gradients across Europe using the LTER Europe network [J].
|
| [23] |
基于GIS-Markov区域生态安全时空演变研究——以大连市甘井子区为例 [J].
以大连市甘井子区为例,基于压力-状态-响应(P-S-R)框架构建区域生态安全评价体系,利用研究区1990年、2000年和2009年3期TM遥感影像数据,在GIS格网技术下量化多源数据,创建区域生态安全格网数据库,采用加权综合评价方法进行生态安全状态评价。以评价结果为基础,构建区域生态安全GIS-Markov模型,通过计算区域生态安全状态转移矩阵,揭示区域生态安全时空演变特点。研究结果表明①1990~2009年甘井子区各街道生态安全指数逐年增加,其中1990~2000年生态安全变化较大的地区集中于甘井子北部和中部,西部和南部地区生态安全变化较小;2000~2009年除泉水街道与南关岭街道外,其他地区生态安全状况均大幅好转。②区域背景在生态安全空间演变趋同过程中起着重要的作用。甘井子区生态安全演变的可能性受邻域的影响,安全等级较高的邻域对生态安全等级转移起到正面作用,而安全等级较低的邻域则产生负向影响。1990~2000年,甘井子区生态安全状态受较高安全等级邻域的影响,安全状态好转的面积较大,营城子街道北部及革镇堡街道西部的农村地区受较低安全等级邻域的影响,安全状态变差。2000~2009年,甘井子区生态安全总体向好的方面转变,受邻域的影响较小,只有泉水街道及营城子街道与红旗街道交界处受不安全邻域影响,其生态安全状况转差。
Spatial-temporal Evolution of Regional Eco-security Based on GIS-Markov Model—A Case Study of Ganjingzi District in Dalian, Liaoning Province.
以大连市甘井子区为例,基于压力-状态-响应(P-S-R)框架构建区域生态安全评价体系,利用研究区1990年、2000年和2009年3期TM遥感影像数据,在GIS格网技术下量化多源数据,创建区域生态安全格网数据库,采用加权综合评价方法进行生态安全状态评价。以评价结果为基础,构建区域生态安全GIS-Markov模型,通过计算区域生态安全状态转移矩阵,揭示区域生态安全时空演变特点。研究结果表明①1990~2009年甘井子区各街道生态安全指数逐年增加,其中1990~2000年生态安全变化较大的地区集中于甘井子北部和中部,西部和南部地区生态安全变化较小;2000~2009年除泉水街道与南关岭街道外,其他地区生态安全状况均大幅好转。②区域背景在生态安全空间演变趋同过程中起着重要的作用。甘井子区生态安全演变的可能性受邻域的影响,安全等级较高的邻域对生态安全等级转移起到正面作用,而安全等级较低的邻域则产生负向影响。1990~2000年,甘井子区生态安全状态受较高安全等级邻域的影响,安全状态好转的面积较大,营城子街道北部及革镇堡街道西部的农村地区受较低安全等级邻域的影响,安全状态变差。2000~2009年,甘井子区生态安全总体向好的方面转变,受邻域的影响较小,只有泉水街道及营城子街道与红旗街道交界处受不安全邻域影响,其生态安全状况转差。
|
| [24] |
The value of the world's ecosystem services and natural capital [J]. |
| [25] |
|
| [26] |
Quantifying and mapping multiple ecosystem services change in West Africa [J].https://doi.org/10.1016/j.agee.2012.12.001 URL [本文引用: 1] 摘要
Although ecosystem services have been identified to be declining over the previous decades, there is no clear methodology of evaluating the impacts of land use change on ecosystem services. This paper presents a methodology for quantifying and assessing changes in multiple ecosystems services as a result of land use change using the Integrated Valuation of Ecosystem Services and Tradeoffs (InVEST) model. The model was used to map and quantify biodiversity and four ecosystem services for Ghana and Cote d’Ivoire for 2000, 2005 and 2009 land use conditions: water yield, carbon storage, nutrient retention, and sediment retention. The study developed a suite of indices to analyze land use change impacts on the status, change and spatial patterns of multiple ecosystem services. On a national scale, the results show a mix of increases in service (water yield, N retention and P retention in Ghana, and, N and P retention in Cote d’Ivoire), little change in services (sediment retention in Ghana and sediment retention and water yield in Cote d’Ivoire) and decreases in services (biodiversity and carbon storage in both countries) from 2000 to 2009. The assessment illustrates a methodology that can be employed by land managers in exploring multiple management scenarios and their implications for multiple ecosystem services change.
|
| [27] |
Evolution of ecosystem services in the Chinese Loess Plateau under climatic and land use changes [J].https://doi.org/10.1016/j.gloplacha.2012.12.014 URL 摘要
Abstract Due to the lengthy historic land use by humans and the climate change characterized by warming and drying, the Loess Plateau has been plagued by ecosystem degradation for a long time. A series of ecological conservation projects launched since the 1970s altered the land use pattern greatly, and exerted a profound influence on the ecosystem services. Based on the Integrated Valuation of Ecosystem Services and Tradeoffs (InVEST) and Carnegie–Ames–Stanford Approach (CASA) models, we assessed the historical fluctuation of sediment control, water yield, and net primary production (NPP) in the Loess Plateau. The results showed that sediment retention was greatly consolidated indicated by the sharp decrease of sediment export. Water yield decreased at first and increased later. Both sediment export and water yield showed an increasing ‘spatial homogenization’ tendency during the period. NPP was steady between 1990 and 2000, and then increased greatly after 2000. Ecosystem services are interlinked closely and complexly. Correlation analyses indicated a positive relationship between the difference in sediment export and water yield (r2 = 0.7766868) from 1975 to 2008, with negative correlations between the difference of NPP and water yield (r2 = 61 0.4226868)/sediment export (r2 = 61 0.24068) from 1990 to 2008. This, to some extent, implies that there are tradeoffs between the services of water yield and sediment control/NPP, and there is synergy between sediment control and NPP. Climatic and land use changes are the major drivers on ecosystem services fluctuation. Correlation analyses showed that the decrease of precipitation significantly hindered water yield (r2 = 0.9806868) and sediment export (r2 = 0.7916868). The increase of temperature exerted a slight negative influence on water yield (r2 = 61 0.3506868). A spatial concordance existing between the ‘cropland to grass/woodland’ area and the high sediment control (r2 = 0.3136868)/NPP (r2 = 0.4886868) area indicated that the land use change from cropland to woodland/grassland significantly consolidated sediment control and NPP production. The observed spatio-temporal variation of ecosystem services and their correlations provide an operable criterion for land use management policies.
|
| [28] |
三峡库区生态屏障区土地利用规划生态效应评估 [J].
以地处三峡库区腹心地带的重庆市云阳县为例,基于土地利用多功能性,以Costanza等的生态系统服务价值测算方法及谢高地等制定的生态服务价值系数为基础,构建不同土地利用类型生态服务价值修正系数,从生态系统服务价值以及景观格局视角定量估算三峡库区生态屏障区土地利用规划生态效应.结果表明,以土地生态功能建设为导向的土地利用规划能够快速提升生态屏障区生态系统服务价值,增强屏障区调节气候、保持土壤、维护生物多样性等方面能力,云阳县三峡库区生态屏障区生态系统服务总价值从2010年的15.53亿元提升到2020年的19.98亿元,年均变化率达到2.87%;至2020年云阳县三峡库区生态屏障区初步构建一个以"林地为骨架,耕地、园地、草地为补充"的生态系统服务格局;同时,云阳县三峡库区生态屏障区生态系统服务价值及其调节服务和支持服务价值表现出显著地空间分异特征,其中磨刀溪流域生态系统服务价值提升幅度最大,澎溪河流域次之,长江沿岸生态服务系统价值保持稳定增长,而长滩河流域变化不大.
Evaluation of Ecological Effects in Land Use Planning: A Case Study of Ecological Barrier Zone of Three Gorges Reservoir Area.
以地处三峡库区腹心地带的重庆市云阳县为例,基于土地利用多功能性,以Costanza等的生态系统服务价值测算方法及谢高地等制定的生态服务价值系数为基础,构建不同土地利用类型生态服务价值修正系数,从生态系统服务价值以及景观格局视角定量估算三峡库区生态屏障区土地利用规划生态效应.结果表明,以土地生态功能建设为导向的土地利用规划能够快速提升生态屏障区生态系统服务价值,增强屏障区调节气候、保持土壤、维护生物多样性等方面能力,云阳县三峡库区生态屏障区生态系统服务总价值从2010年的15.53亿元提升到2020年的19.98亿元,年均变化率达到2.87%;至2020年云阳县三峡库区生态屏障区初步构建一个以"林地为骨架,耕地、园地、草地为补充"的生态系统服务格局;同时,云阳县三峡库区生态屏障区生态系统服务价值及其调节服务和支持服务价值表现出显著地空间分异特征,其中磨刀溪流域生态系统服务价值提升幅度最大,澎溪河流域次之,长江沿岸生态服务系统价值保持稳定增长,而长滩河流域变化不大.
|
| [29] |
The impact of climate change on water provision under a low flow regime:A case study of the ecosystems services in the Francoli River basin [J].https://doi.org/10.1016/j.jhazmat.2013.07.049 URL PMID: 23958138 [本文引用: 1] 摘要
Abstract Mediterranean basin is considered one of the most vulnerable regions of the world to climate change and with high probability to face acute water scarcity problem in the coming years. Francol River basin (NE Spain), located in this vulnerable region is selected as a case study to evaluate the impact of climate change on the delivery of water considering the IPCC scenarios A2 and B1 for the time spans 2011-2040, 2041-2070 and 2071-2100. InVEST model is applied in a low flow river as a new case study, which reported successful results after its model validation. The studied hydrological ecosystem services will be highly impacted by climate change at Francol River basin. Water yield is expected to be reduced between 11.5 and 44% while total drinking water provisioning will decrease between 13 and 50% having adverse consequences on the water quality of the river. Focusing at regional scale, Prades Mountains and Brugent Tributary provide most of the provision of water and also considered highly vulnerable areas to climate change. However, the most vulnerable part is the northern area which has the lowest provision of water. Francol River basin is likely to experience desertification at this area drying Anguera and Vallverd tributaries.
|
| [30] |
Ecosystem services and economic development in Austrian agricultural landscapes-The impact of policy and climate change scenarios on trade-offs and synergies [J].https://doi.org/10.1016/j.ecolecon.2014.11.005 URL 摘要
We have developed an integrated modeling framework (IMF) to quantify indicators for ecosystem services (ES) and economic development (ED) in agricultural landscapes. Austria serves as a case study in which impacts, trade-offs, and synergies of ES and ED are assessed for different agricultural policy pathways and regional climate change scenarios. Agricultural intensification and incentivized use of provisioning ES (e.g. biomass production) lead to higher macro-economic output (e.g. GDP) but usually reduce ES related to regulation and maintenance (e.g. ecological integrity, climate regulation), as well as cultural services (landscape diversity). We revealed both synergies for certain ES (e.g. biomass production and soil organic carbon stocks) as well as large spatial deviations from the national mean across the heterogeneous agricultural landscapes in Austria. Climate change scenarios (i) lead to substantial variation in ES and ED indicators and (ii) usually amplify trade-offs by stimulating land use intensification. Our findings depict the complex relationship between different ES and ED indicators as well as the importance of considering spatial heterogeneity and regional climate change. This assessment can help to improve targeting of agri-environmental schemes in order to provide a more balanced and efficient supply of ES and to foster rural development.
|
| [31] |
Mapping potential carbon and timber losses from hurricanes using a decision tree and ecosystem services driver model [J].https://doi.org/10.1016/j.jenvman.2013.08.029 URL PMID: 24036093 [本文引用: 1] 摘要
Information on the effect of direct drivers such as hurricanes on ecosystem services is relevant to landowners and policy makers due to predicted effects from climate change. We identified forest damage risk zones due to hurricanes and estimated the potential loss of 2 key ecosystem services: aboveground storage and timber volume. Using land cover, plot-level forest inventory data, the Integrated Valuation of Ecosystem Services and Tradeoffs (InVEST) model, and a decision tree-based framework; we determined potential damage to subtropical forests from hurricanes in the Lower Suwannee River (LS) and Bay (PB) watersheds in Florida, US. We used biophysical factors identified in previous studies as being influential in forest damage in our decision tree and hurricane wind risk maps. Results show that 31% and 0.5% of the total aboveground storage in the LS and PB, respectively was located in high forest damage risk (HR) zones. Overall 15% and 0.7% of the total timber net volume in the LS and PB, respectively, was in HR zones. This model can also be used for identifying timber salvage areas, developing ecosystem service provision and management scenarios, and assessing the effect of other drivers on ecosystem services and goods.
|
| [32] |
长三角城市群城市经济联系及国际化空间发展战略 [J].
在经济全球化的今天,国际竞争已经更多地表现为城市群之间的竞争,积极推进长三角城市群城市 国际化,不仅对长三角地区发展,而且对整个国家的发展都有非常重要的战略意义。在相关概念辨析的基础上,对长三角城市群城市等级、经济联系、经济隶属度和 国际化程度进行计量分析;发现上海仍在长三角城市群中处于核心主导地位,但城市群内部的城市经济结构已经发生重构,杭州、苏州、宁波、无锡等城市组团和与 上海的联系不断加强,这种趋势将不断扩大。城市国际化异军突起,中小城市国际化充分彰显,是长三角城市群城市国际化发展的重要力量。在此基础上,提出了长 三角城市群整体及辐射区、次级核心城市和中小城市三重城市国际化的空间发展战略。
Urban economic contacting and internationalization spatial development strategy in Yangtze Delta Area urban agglomeration.
在经济全球化的今天,国际竞争已经更多地表现为城市群之间的竞争,积极推进长三角城市群城市 国际化,不仅对长三角地区发展,而且对整个国家的发展都有非常重要的战略意义。在相关概念辨析的基础上,对长三角城市群城市等级、经济联系、经济隶属度和 国际化程度进行计量分析;发现上海仍在长三角城市群中处于核心主导地位,但城市群内部的城市经济结构已经发生重构,杭州、苏州、宁波、无锡等城市组团和与 上海的联系不断加强,这种趋势将不断扩大。城市国际化异军突起,中小城市国际化充分彰显,是长三角城市群城市国际化发展的重要力量。在此基础上,提出了长 三角城市群整体及辐射区、次级核心城市和中小城市三重城市国际化的空间发展战略。
|
| [33] |
长江三角洲土地利用分类研究 [J].https://doi.org/10.3321/j.issn:1007-7588.2002.02.017 URL [本文引用: 1] 摘要
文中探讨了可持续利用目标下土地利用分类的必要性以及分类原则、依据和方法等问题。以长江三角洲地区为例 ,在对该区土地利用现状进行全面详细调查研究的基础上 ,提出“可持续利用、综合性、满足人类需求的适应性和系统性”四大分类原则 ,并以土地利用的形式与功能相结合的综合分类方式 ,将长江三角洲地区土地利用现状划分为四大零级系统、9个一级类别、39个二级类型和 4 3个三级类型 ,形成四级层次的分类体系。本方案是土地可持续利用理论与分类理论相互结合探讨的初步结果 ,可为长江三角洲土地利用与管理实践提供依据。
Bao Haosheng et al. Land use classification in Yangtze River Delta. https://doi.org/10.3321/j.issn:1007-7588.2002.02.017 URL [本文引用: 1] 摘要
文中探讨了可持续利用目标下土地利用分类的必要性以及分类原则、依据和方法等问题。以长江三角洲地区为例 ,在对该区土地利用现状进行全面详细调查研究的基础上 ,提出“可持续利用、综合性、满足人类需求的适应性和系统性”四大分类原则 ,并以土地利用的形式与功能相结合的综合分类方式 ,将长江三角洲地区土地利用现状划分为四大零级系统、9个一级类别、39个二级类型和 4 3个三级类型 ,形成四级层次的分类体系。本方案是土地可持续利用理论与分类理论相互结合探讨的初步结果 ,可为长江三角洲土地利用与管理实践提供依据。
|
| [34] |
深圳市景观生态安全格局源地综合识别 [J].https://doi.org/10.5846/stxb201208081123 URL [本文引用: 1] 摘要
城市生态安全格局是景观生态学研究的热点和重点之一,识别源地是构建生态安全格局的首要环节.在总结已有研究中重要斑块识别方法的基础上,提出了结合景观连通性分析、生物多样性服务评估和生境质量评估来提取重要斑块的方法.以深圳市为研究区,采用基于图论的景观连通性指数、生物多样性服务当量、InVEST模型生境质量评估模块和GIS技术相结合的方法识别生态用地重要斑块.结果表明:深圳市生态斑块依照连通性、生物多样性和生境质量的综合评估分为五级,其中最重要斑块主要分布在龙岗区、盐田区和罗湖区;现行基本生态控制线政策可以保护大部分重要斑块.
Peng Jian et al. The integrated recognition of the source area of the urban ecological security pattern in Shenzhen. https://doi.org/10.5846/stxb201208081123 URL [本文引用: 1] 摘要
城市生态安全格局是景观生态学研究的热点和重点之一,识别源地是构建生态安全格局的首要环节.在总结已有研究中重要斑块识别方法的基础上,提出了结合景观连通性分析、生物多样性服务评估和生境质量评估来提取重要斑块的方法.以深圳市为研究区,采用基于图论的景观连通性指数、生物多样性服务当量、InVEST模型生境质量评估模块和GIS技术相结合的方法识别生态用地重要斑块.结果表明:深圳市生态斑块依照连通性、生物多样性和生境质量的综合评估分为五级,其中最重要斑块主要分布在龙岗区、盐田区和罗湖区;现行基本生态控制线政策可以保护大部分重要斑块.
|
| [35] |
一个基于专家知识的生态系统服务价值化方法 [J].https://doi.org/10.11849/zrzyxb.2008.05.019 URL [本文引用: 1] 摘要
Costanza等提出的生态服务价值化评估方法在中国直接运用存在一些缺陷:低估或者忽略了某些生态系统服务价值。因此,笔者在其生态系统服务价值评估体系的基础上分别在2002年和2006年对中国700位具有生态学背景的专业人员进行问卷调查,得出了新的生态系统服务评估单价体系。通过对比发现,调查获得的基于专家知识的生态系统服务单价体系与基于物质量估算的生态系统服务价值之间具有较好的可比性。该基于专家知识的生态系统服务评估体系可以用于已知土地利用面积的生态系统服务价值估算,能在较短时间内获得较为精确的结果。
Expert knowledge based valuation method of ecosystem services in China. https://doi.org/10.11849/zrzyxb.2008.05.019 URL [本文引用: 1] 摘要
Costanza等提出的生态服务价值化评估方法在中国直接运用存在一些缺陷:低估或者忽略了某些生态系统服务价值。因此,笔者在其生态系统服务价值评估体系的基础上分别在2002年和2006年对中国700位具有生态学背景的专业人员进行问卷调查,得出了新的生态系统服务评估单价体系。通过对比发现,调查获得的基于专家知识的生态系统服务单价体系与基于物质量估算的生态系统服务价值之间具有较好的可比性。该基于专家知识的生态系统服务评估体系可以用于已知土地利用面积的生态系统服务价值估算,能在较短时间内获得较为精确的结果。
|
| [36] |
我国粮食生产的生态服务价值研究 [J].
试验研究证明农田生态系统产生生态服务价值,并在此基础上估算出我国农田生态系统因自然生态过程和人类种植业活动过程共同作用,为人类年提供19509.1亿元生态服务和经济产品总价值,其中41.9%是由农田生态系统自然过程提供和产生的,58.1%是由人类种植业活动过程产生的.目前我国统计系统计量的年度种植业总价值中仅计量了人类种植业活动过程产生的经济价值和部分由自然生态过程产生的生态服务价值,得到计量和反映的仅为64.7%,未计量的生态服务价值为35.3%,年达6881.06亿元.由于粮食生产过程中伴随产生的生态服务属公共服务范畴,国家应为粮食生产提供公共财政补贴的额度高限可达5140元/hm2·α.
Study on ecosystem services value of food production in China .
试验研究证明农田生态系统产生生态服务价值,并在此基础上估算出我国农田生态系统因自然生态过程和人类种植业活动过程共同作用,为人类年提供19509.1亿元生态服务和经济产品总价值,其中41.9%是由农田生态系统自然过程提供和产生的,58.1%是由人类种植业活动过程产生的.目前我国统计系统计量的年度种植业总价值中仅计量了人类种植业活动过程产生的经济价值和部分由自然生态过程产生的生态服务价值,得到计量和反映的仅为64.7%,未计量的生态服务价值为35.3%,年达6881.06亿元.由于粮食生产过程中伴随产生的生态服务属公共服务范畴,国家应为粮食生产提供公共财政补贴的额度高限可达5140元/hm2·α.
|
| [37] |
2000~2010年鄱阳湖地区生态系统服务价值空间格局及其动态演化 [J].
鄱阳湖地区是中国重要生态功能区和世界基金会划定的全球重要生态区。本文基于土地覆被遥感解译数据及其他辅助数据,运用基于专家知识的生态系统服务价值评估模型及相关分维、空间统计等分析方法,分析鄱阳湖地区2000-2010年生态系统服务价值空间格局及其动态演化。结果表明:1鄱阳湖地区生态系统服务价值总量较高,但价值净损失趋于加速,2000-2005年价值净损失1.10亿元,2005-2010年净损失2.47亿元;2生态系统服务价值空间格局的等级差异明显,中等价值单元分布均匀,高值单元分布集中,低值和较高值单元随机分布;3生态系统服务价值及其动态演化的空间自相关与高低值聚集现象明显,但其相关性与聚集程度趋于弱化;4"退耕还林"政策的实施促使生态系统服务价值增值并形成若干增值热点区,城市扩张与土地开发导致生态系统服务价值损失,并形成沿交通干线和水土资源富集区分布的价值损失冷点区。
Spatial patterns and dynamic evolution of ecosystem service values in Poyang Lake Region from 2000 to 2010.
鄱阳湖地区是中国重要生态功能区和世界基金会划定的全球重要生态区。本文基于土地覆被遥感解译数据及其他辅助数据,运用基于专家知识的生态系统服务价值评估模型及相关分维、空间统计等分析方法,分析鄱阳湖地区2000-2010年生态系统服务价值空间格局及其动态演化。结果表明:1鄱阳湖地区生态系统服务价值总量较高,但价值净损失趋于加速,2000-2005年价值净损失1.10亿元,2005-2010年净损失2.47亿元;2生态系统服务价值空间格局的等级差异明显,中等价值单元分布均匀,高值单元分布集中,低值和较高值单元随机分布;3生态系统服务价值及其动态演化的空间自相关与高低值聚集现象明显,但其相关性与聚集程度趋于弱化;4"退耕还林"政策的实施促使生态系统服务价值增值并形成若干增值热点区,城市扩张与土地开发导致生态系统服务价值损失,并形成沿交通干线和水土资源富集区分布的价值损失冷点区。
|
| [38] |
The effectiveness of different conservation policies on the security of natural capital [J].https://doi.org/10.1016/j.landurbplan.2008.10.003 URL [本文引用: 1] 摘要
The maintenance of ecosystem goods and services, i.e. natural capital, is the basic guarantee of environmental security that aims to evaluate the level of threats to the actual flux of natural capital. This research concerns a natural protected area in southern Italy and aims at (1) assessing the temporal dynamics of land-use and land-cover mosaics, and indirectly of the natural capital they support, using the economic valuation of ecosystem goods and services as surrogate; and (2) ascertaining whether all the past environmental conservation policies have fostered the natural capital, reducing or increasing its security. To these purposes, orthorectified aerial photos, referring to July 1954, 1987, 1997 and 2004, were used to analyze the landscape change trajectory and the consequent change of natural capital flux. Surprisingly the results showed that not all environmental conservation policies have played an equal role in fostering the maintenance of natural capital. This research highlighted that the recognition of the natural value of a site according to the European Directives is not sufficiently effective for the conservation of the natural capital, while the presence of a local management authority setting some limits on human activities that cause landscape changes, can increase the security of natural capital. This is of particular relevance considering that in each European partner country there is a great number of areas that are recognized for their natural value but that, at the moment, are not protected at a local level with any measure aimed at mitigating human impact.
|
| [39] |
GIS在流域生态环境质量评价中的应用 [D].The application of GIS in watershed ecological quality evaluation. |
| [40] |
中国人口城市化水平预测分析 [J].https://doi.org/10.3969/j.issn.1002-3291.2007.03.025 URL [本文引用: 1] 摘要
确定合意的城市化水平对中国的经济发展至关重要,城市化水平的预测模型与方法众多,这些模型与方法各有特点,结果迥异。因此,首先对现有城市化水平预测模型与方法进行评价与选择;其次采用Logistic增长模型预测中国未来的城市化水平,结果显示中国城市化水平在2030年将达到60%左右。根据中国的经济社会发展状况以及未来城市化发展趋势,60%左右的城市化水平是合意的,盲目快速赶超其他国家是不切实际的。
An Analysis of the Level of China's Urbanization. https://doi.org/10.3969/j.issn.1002-3291.2007.03.025 URL [本文引用: 1] 摘要
确定合意的城市化水平对中国的经济发展至关重要,城市化水平的预测模型与方法众多,这些模型与方法各有特点,结果迥异。因此,首先对现有城市化水平预测模型与方法进行评价与选择;其次采用Logistic增长模型预测中国未来的城市化水平,结果显示中国城市化水平在2030年将达到60%左右。根据中国的经济社会发展状况以及未来城市化发展趋势,60%左右的城市化水平是合意的,盲目快速赶超其他国家是不切实际的。
|
| [41] |
重庆市涪陵区城镇化水平驱动机制分析及预测 [J].
笔者在介绍重庆市涪陵区1998—2008年间城镇化水平现状的基础上,通过分析涪陵区城镇化发展的外在和内在驱动机制,对涪陵区城镇化趋势进行定性分析,最后再运用综合增长率法和剩余劳动力转移法分别预测出2015年和2020年的总人口和城镇常住人口,得出涪陵区在2015和2020年的城镇化水平。
Driving Forces and Forecasting of Urbanization in Fuling District of Chongqing City.
笔者在介绍重庆市涪陵区1998—2008年间城镇化水平现状的基础上,通过分析涪陵区城镇化发展的外在和内在驱动机制,对涪陵区城镇化趋势进行定性分析,最后再运用综合增长率法和剩余劳动力转移法分别预测出2015年和2020年的总人口和城镇常住人口,得出涪陵区在2015和2020年的城镇化水平。
|
| [42] |
国土资源部关于强化管控落实最严格耕地保护制度的通知 [J].https://doi.org/10.3969/j.issn.1672-321X.2014.05.010 URL [本文引用: 1] 摘要
正为贯彻落实党中央、国务院的决策部署,国土资源部在深入研究、总结实践经验基础上,制定下发了《关于强化管控落实最严格耕地保护制度的通知》(国土资发〔2014〕18号,以下简称《通知》),提出了新形势下进一步严格耕地保护的新目标、新要求和新举措,这是指导未来一个时期耕地保护工作的纲领性文件。
Notice of the Ministry of Land and Resources on Strengthening the Control and Implementation of the Most Stringent Farmland Protection System. https://doi.org/10.3969/j.issn.1672-321X.2014.05.010 URL [本文引用: 1] 摘要
正为贯彻落实党中央、国务院的决策部署,国土资源部在深入研究、总结实践经验基础上,制定下发了《关于强化管控落实最严格耕地保护制度的通知》(国土资发〔2014〕18号,以下简称《通知》),提出了新形势下进一步严格耕地保护的新目标、新要求和新举措,这是指导未来一个时期耕地保护工作的纲领性文件。
|
| [43] |
|
| [44] |
|
| [45] |
|
| [46] |
生态视角下的城市增长边界划定方法——以杭州市为例 [J].
以生境恶化和土地资源供需平衡两大现实问题为背景,针对当前城市增长边界划定方法存在的误区,在分析GIA与约束性CA模型的基础上,构建了生态视角下的GIA-CA空间模型.该模型将生态保护的传统被动防御转变为主动控制的模式,以城市存量土地“质”的生态分级和“量”的有限供给作为空间增长模拟的宏观约束条件,从而划定城市增长边界,达到控制城市蔓延和引导城市在适宜发展区域增长的目标.最后,杭州的实证研究证明,以GIA--CA模型划定城市增长边界能够破解当前城市蔓延相关问题,从而保障了健康城镇化的顺利进行.
Method of determining urban growth boundary from the view of ecology: A case study of Hangzhou.
以生境恶化和土地资源供需平衡两大现实问题为背景,针对当前城市增长边界划定方法存在的误区,在分析GIA与约束性CA模型的基础上,构建了生态视角下的GIA-CA空间模型.该模型将生态保护的传统被动防御转变为主动控制的模式,以城市存量土地“质”的生态分级和“量”的有限供给作为空间增长模拟的宏观约束条件,从而划定城市增长边界,达到控制城市蔓延和引导城市在适宜发展区域增长的目标.最后,杭州的实证研究证明,以GIA--CA模型划定城市增长边界能够破解当前城市蔓延相关问题,从而保障了健康城镇化的顺利进行.
|

/
| 〈 |
|
〉 |