郑江禹 , 张强, 史培军
Zheng Jiangyu, Zhang Qiang, Shi Peijun
中图分类号: P333.2
文献标识码: A
文章编号: 1000-0690(2017)02-0283-09
通讯作者:
收稿日期: 2016-03-3
修回日期: 2016-06-11
网络出版日期: 2017-02-25
版权声明: 2017 《地理科学》编辑部 本文是开放获取期刊文献,在以下情况下可以自由使用:学术研究、学术交流、科研教学等,但不允许用于商业目的.
基金资助:
作者简介:
作者简介:郑江禹(1993-),男,江西宜春人,硕士研究生,主要从事气象水文学研究。E-mail:zhengjy37@mail2.sysu.edu.cn
展开
摘要
基于珠江流域74个气象站点1952~2013年逐日降水和气温数据,采用POT抽样、Mann-Kendall(MK)趋势检验、泊松回归等方法,从降水量级、降水频率及发生时间等方面系统分析了珠江流域年、雨季及旱季3个时间尺度上的极端降水特征,并从降水对温度变化响应及ENSO影响等角度,探讨了极端降水变化特征的机理。研究表明:① 珠江流域极端降水年内分布不均,多发于4~9月,其中6月份发生频率最高;② 珠江流域极端降水频率在雨季及年际间分布较为均匀。但在旱季,珠三角地区极端降水在不同年份差异性较大;③ 在雨季及年际尺度上,极端降水年序列趋势性并不显著;而相对干旱季节,极端降雨量级、发生频次均随年份增加呈显著上升趋势,且发生时间提前。珠江流域农业以水稻(Oryzasativa)种植为主,旱季极端降水增加易导致冬汛及其引起的作物倒伏与农田渍涝等灾害,同时对秋冬防洪提出新的挑战,需要引起人们的关注;④ 温度升高和ENSO事件对珠江流域极端降水过程有显著影响。从ENSO影响的角度讲,在厄尔尼诺年,珠江流域西部极端降水量级和频率增加,而流域东部沿海区域极端降水量级减少,时间延后。
关键词:
Abstract
Daily precipitation and temperature data of 74 weather stations of the Pearl River Basin in 1952-2013 were analyzed to characterize spatiotemporal characteristics of extreme precipitation in terms magnitude, frequency and occurrence time by using the peaks-over-threshold approach (POT), Mann-Kendall test(MK) and Poisson Regression Model for the whole year, wet season(April-September) and dry season(October-March). In addition, causes behind extreme precipitation changes were investigated by relating spatiotemporal patterns of extreme precipitation to ENSO and large-scale moisture circulation. The results indicate that:1) Extreme precipitation over the Pearl River Basin is in uneven. Precipitation extreme mainly occurs from April to September and highest extreme precipitation regimes can be found in June; 2) The frequency of extreme precipitation across the Pearl River Basin during wet season and whole year is even. However, occurrence rates of extreme precipitation within the Pearl River Delta during dry season tends to be uneven with significant difference in annual frequency of extreme precipitation;3) Magnification of extreme precipitation can be observed during dry season with respect to precipitation magnitude and occurrence rates. Besides, occurrence timing of extreme precipitation regimes tends to be earlier. However, no significant trend can be identified in extreme precipitation during wet season and during the entire year. Winter flood has the potential to causeagriculturalloss. Therefore, wetting tendency of dry season can pose new challenges for regional water resources management; 4) Warming climate across the Pearl River Basin and variations of warm and cold episodes of ENSO have significant effects on extreme precipitation processes. From the perspective of the ENSO’s influence, magnitude and frequency of extreme precipitation over the west of the Pearl River Basin increases in El Niño years with decreased magnitude of extreme precipitation in the lower Pearl River Basin.
Keywords:
近几十年来,在气候暖化与人类活动共同影响下,全球及区域尺度水循环加剧,极端降水事件时空特征发生显著变异[1],旱涝灾害事件增多,给经济社会发展带来重要影响[2]。因此,极端降水过程时空特征及可能机理的研究引起了人们的广泛兴趣[3]。珠江流域是中国流域面积第三、流量第二的大河流域,对中国尤其是南部地区可持续发展有着举足轻重的作用。由于受气候变异和剧烈人类活动的双重影响,流域气象水文要素时空变异特征显著[4]。
以往研究对珠江流域极端降水已做了大量工作[4~8],但所用指标多为年或季节最大降水量来定义极端降水事件,在一定程度上限制了降水数据信息的挖掘,而超阈值抽样(POT)能够比年极端降水指标提供更多更丰富的极端降水过程信息[9]。另外,对于流域降水天数与降水强度变化,由于珠江流域纬度较低,夏季漫长,冬季很短,四季不分明,所以本文没有将珠江流域分为传统的四季进行研究,而是选择将珠江流域分为全年、雨季(4月到9月)和旱季(10月到次年3月)进行分析。同时越来越多的研究表明中国的极端天气事件与厄尔尼诺事件存在一定的联系[10],基于此,本文通过分析不同ENSO年水汽通量变化探讨珠江流域极端降水时空特征成因及机理[11]。目的在于探讨:① 珠江流域极端降水事件发生的年内和年际集聚性;② 基于POT抽样的珠江流域极端降水在量级、频率和发生时间上的趋势时空规律;③ ENSO事件(厄尔尼诺事件和拉尼娜事件)对珠江流域的极端降水量级、频率和发生时间的影响及潜在的机理分析。
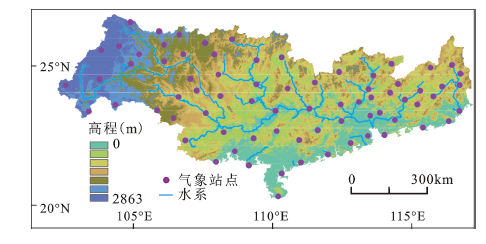
珠江流域(102°14'E~115°53'E,21°31'N~26°49'N)位于中国南方,横跨云南、贵州、广西、广东、湖南、江西6省,面积达4.52×10⁵km2。流域地形以山地和丘陵为主,占总流域面积的94.5%;平原面积小而分散,仅占5.5%。流域地势西北高而东南低。在气候上,珠江流域属亚热带季风气候,温和多雨。流域大部分地区年均温在20℃以上,年际变化不大,年降水量在1 000~2 200 mm之间。
本文所分析数据为珠江流域74个雨量站点逐日降水和气温序列(图1)。时间为1952~2013年共62 a的数据,数据由国家气候中心提供,数据质量经严格控制且用双累计曲线法检验数据的一致性。缺测数据采用Zhang等人提出的方法进行了插值处理[12]。
为避免丰枯水年的干扰,使用POT进行取样,通过设定某一值作为阈值,将各站点降水序列中超过该阈值的降水过程重新组成一个新的极端降水序列[13]。本文使用各站点非零降水值(日降水量大于1 mm)的95%分位数作为阈值,分别在年尺度、雨季和旱季尺度上进行了抽样。
2.2.1 Mann-Kendall检验
本研究趋势检验采用Mann-Kendall趋势检验法的改进法(MMK)[14]。该方法在研究气候及水文序列趋势方面得到广泛应用[15]。在本研究中,MMK用于检验POT序列的极端降水特征值变化趋势:① 极端降水的量级;② 极端降水在年内的发生时间;③ 流域各站点的温度。趋势的量化使用Sen趋势度进行评估,各趋势分别在年尺度和季节尺度上进行检测。
2.2.2 泊松回归模型
泊松回归模型是一种广义线性回归模型[16]。以k表示观测的某一事件发生频率,并假定随机变量Ni等于k的概率,则该泊松分布密度函数为:
则该泊松分布密度函数为:
式中
极端降水多(少)发月份可以通过每个月份极端降水发生次数的期望值比得到。在非季节模型中,极端降水的各月发生频率均相同,而在季节模型中极端降水在某些月份的发生频率会更高。由于各月份天数不同,首先将各个月份的极端降水频率进行修正,得到各月份修正频率FFm。假设极端降水无季节性分布,在任意月份极端降水事件的频率是1/12。所以,在非季节模型中,任意月份极端降水的概率等于1/12。在5%的显著性区间内,月频率变化的上下边界分别为
式中,
在POT序列中,每年极端降水发生次数一般假定遵循泊松分布[17],公式如下:
其中,P(m)为给定年份中超过阈值m次的概率。λ为每年超过阈值的次数的均值。假设不同年份超过阈值的次数是独立同分布,那么泊松过程中两次事件间隔时间遵循指数分布。考虑到在年尺度上,存在极端降水多发与少发期,从而破坏了齐次泊松过程假设。一个泊松过程的聚集和离散程度可用离散指数(D)表示,为极端降水序列每年发生次数相对于它的数学期望值的变化程度,即:
其中,Z(T)是时间窗口T下的年极端降水发生次数序列。对于泊松过程,D值应为零。D值为负代表低离散,表示大部分年份极端降水发生次数相近;D值为正值代表过离散,表示在年尺度上极端降水事件存在着时间聚集性。
D值显著性在5%的置信区间内用自由度为1的卡方分布的拉格朗日乘子法进行检验:
式中,LM为拉格朗日乘子检验的结果,大于0.05表示该序列不具统计显著性。反之,该序列具有统计显著性。λ为长度k的极端降水序列z中年极端降水发生的次数的均值。
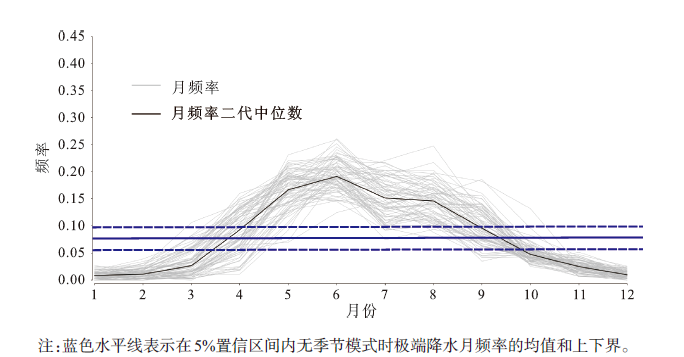
一年中存在极端降水多发或少发月份。在月时间尺度上,极端降水频率改变与降水产生机制密切相关。所以,对极端降水的年内分布进行分析,量化月尺度上极端降水发生频率具有重要意义。本文通过74个站点极端降水事件月频率中位数来分析珠江流域极端降水季节模式(图2),极端降水多发季节为每年4~9月。由于珠江流域降水主要受季风控制,这个时期来自太平洋的大量水汽开始从珠江流域由南向北移动;同时,此时降水事件发生的更加频繁。极端降水少发时期是10月~次年3月,与流域旱季时期吻合。
图2 珠江流域极端降水月发生频率
Fig.2 Monthly frequency of extreme precipitation in the Pearl River Basin
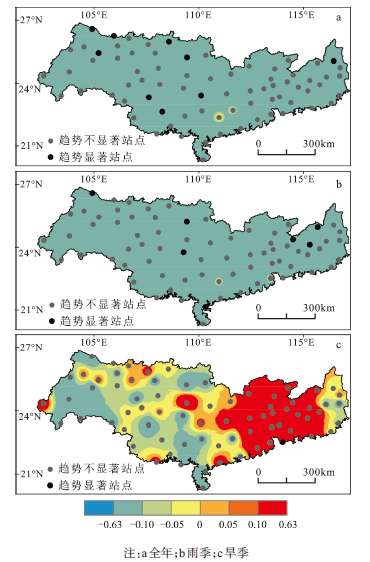
由图3a看出,在POT全年序列上,离散指数变化范围是-0.63~0.01。全年极端降水集聚性显著的站点占总站点数的12.2%;74个站点中有73个站点的离散指数为负值,绝大部分站点表现为低离散。9个具有统计显著性的站点都属于低离散,其中8个站点位于珠江流域的西部。雨季极端降水过程集聚性分析结果与全年相似,图3b中离散指数D值的变化范围是-0.63~0.01,流域绝大部分站点都表现为低离散,7个具有统计显著性的站点均属于低离散。而旱季仅有一个站点的极端降水具有显著集聚性,但是从空间上来讲,旱季极端降水集聚性较明显的区域主要集中于珠江流域中下游,特别是位于110°E~115°E的区域。从年和雨季上来看,在这两个时间尺度上极端降水发生次数在年际间的变化不大。POT旱季序列的结果与年和雨季的结果差异较大,离散指数D值的变化范围是-0.32~0.63,其中有38个站点的D值为正值,显示过离散,说明在旱季珠江流域年际间极端降水次数变化较大。
图3 珠江流域极端降水离散指数的空间分布
Fig.3 Spatial distribution of discrete index of extreme precipitation in three time-scale of the Pearl River Basin
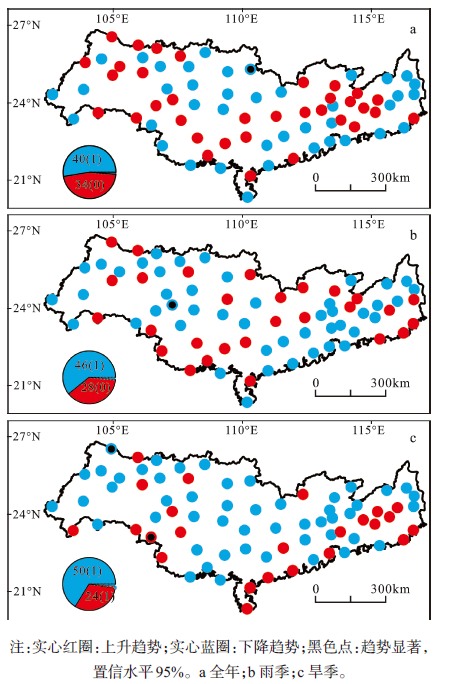
使用MMK法对基于POT采样的极端降水量进行趋势检验,在年、雨季、旱季3个尺度下进行(图4),发现珠江流域极端降水量在3个尺度上均呈显著增加趋势。具体来说:① 在年尺度上,有8个气象站点呈显著上升趋势,主要位于流域中部;4个气象站点呈显著下降趋势。不具有显著趋势的站点中,38个站点呈上升趋势,25个站点呈下降趋势。在年尺度上珠江流域极端降水的量级以上升趋势为主;② 在雨季,具有统计显著性的站点较少,其中2个站点呈显著下降趋势,1个站点呈显著上升趋势。不具有统计显著性的站点中,41个站点呈上升趋势,30个站点呈下降趋势。珠江流域在雨季极端降水量以增加趋势为主,但并不明显;③ 在旱季,有6个气象站点极端降水量呈显著增加趋势,其中3个站点位于珠三角地区。而极端降水量呈不显著变化的站点中,15个站点呈下降趋势,而有53个站点呈上升趋势。在旱季,珠江流域极端降水量呈明显上升趋势,进一步印证了之前的研究发现,即包括珠江流域在内的全国流域降水均存在季节性的变化,即旱季(本文主要指降水较少的冬季以及春与秋季的部分时段)降水呈增加趋势,而夏季降水呈不显著变化或呈微弱下降趋势[18,19]。同时值得注意的是,旱季极端降水量呈明显上升,且主要集中在珠三角地区,该区域是珠江流域的核心区域。极端降水作为一种灾害事件,其量级的显著增大应该引起足够的重视。
图4 珠江流域各站点1952~2013年间极端降水量级变化趋势的空间分布
Fig.4 Spatial distribution of the variation tendency of extreme precipitation magnitude in the Pearl River Basin in 1952-2013
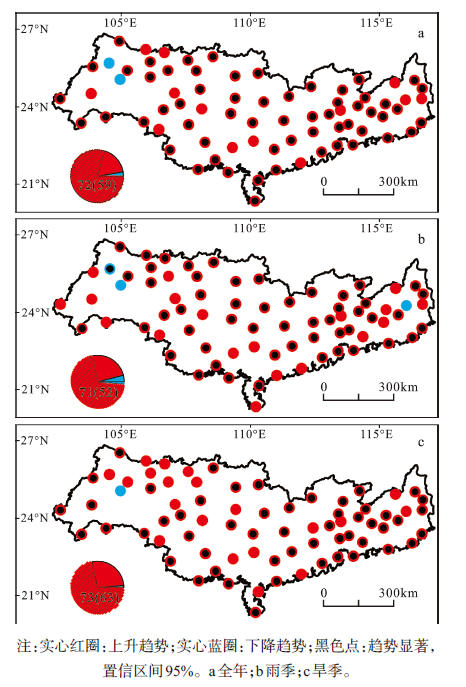
在年、雨季和旱季3个时间尺度,利用MMK法对每个站点极端降水年内发生时间变化趋势进行分析(图5)。由图5看出,在年、旱与雨季3个时间尺度上,极端降水发生时间具有显著变化趋势的站点均较少,但极端降水发生时间呈不显著提前的站点更多。具体来讲:①年尺度上54%的站点极端降水发生时间有提前趋势(图5a),仅有1个站点发生时间显著提前现象,没有发现极端降水发生时间有明显滞后现象的气象站点;②雨季极端降水发生时间以前移为主(图5b),有62%的站点发生时间提前,跟年尺度变化类似,在雨季仍没有发现极端降水发生时间有明显滞后的站点;③旱季极降水发生时间也以提前为主(图5c),其中有68%的站点其极端降水发生时间呈提前现象。由上述分析不难看出,珠江流域极端降水发生时间整体提前,极端降水事件在时间变化上的显著提前现象,对于珠江流域生态系统、农业生产管理、灌溉以及水资源管理等提出了新的亟待解决的问题。
图5 珠江流域各站点1952~2013年间极端降水年内发生时间变化趋势的空间分布
Fig.5 Spatial distribution of variation tendency of extreme precipitation time in the Pearl River Basin in 1952-2013
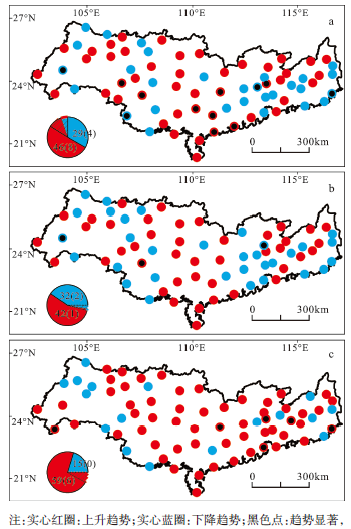
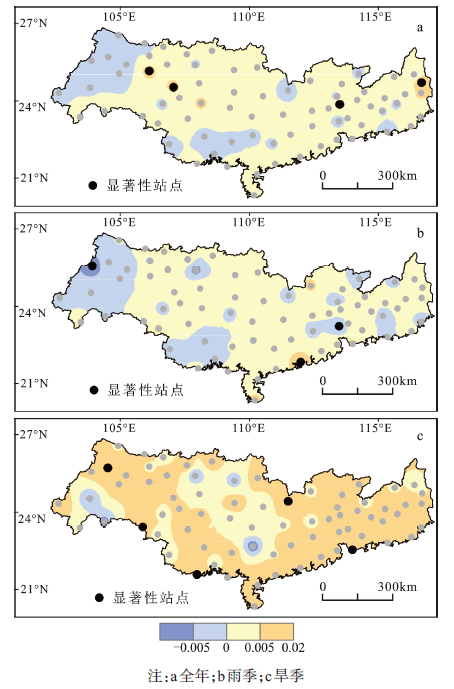
利用泊松回归模型对每个站点极端降水POT序列进行分析,用年发生次数和年份进行回归拟合,得到回归系数。对全年、雨季和旱季3个时间尺度的POT序列的回归系数进行空间分析(图6),由图6看出,3个时间尺度上,极端降水发生频率的变化趋势具有相同的变化特征,即随年份的增大而增大,具体来说:① 从全年尺度来讲,泊松回归参数变化范围是-0.005~0.008,极端降水发生频率以上升趋势为主,呈上升趋势站点占总站点的65%,其中有4个站点通过了显著性检验。下降趋势均不显著。② 在雨季,泊松回归参数变化范围是-0.008~0.009,通过显著性检验的站点较少。其中67%的站点呈上升趋势。呈下降趋势的站点大多位于流域西部。③ 在旱季,回归参数变化范围为-0.008~0.02,且93%的站点极端降水发生频率呈上升趋势,有5个站点上升趋势达到显著。从空间分布来看,极端降水发生频率呈上升趋势的站点多分布于珠江流域东部和南部,极端降水发生频率呈下降趋势的站点多位于珠江流域西部海拔较高的区域。
综上分析,珠江流域极端降水事件时空特征为:在极端降水事件在量级及发生频率上呈上增加趋势,发生时间提前。旱季极端降水事件增加趋势最为明显。从空间分布特征看,极端降水频次和量级上升区域主要为珠江流域东部和南部等低海拔地区,这些区域是珠江流域重要人口聚集区,尤其是珠三角地区,是中国经济最为发达的地区之一,旱季极端降水频次和量级的显著增加会导致该区域洪旱灾害风险增加,同时也会使旱季降水时间分布更趋不均,易致洪旱急转现象。
图6 珠江流域各站点1952~2013年间极端降水频率的泊松回归系数空间分布
Fig.6 Spatial distribution of Poisson Regression coefficient of extreme precipitation frequency in the Pearl River Basin in 1952-2013
气温上升会导致蒸发增加,空气饱和水汽压指数增加,从而造成空气中的水汽含量增加,而空气中水汽含量会直接影响降水量和降水频率。因此,气温变化可能是影响珠江流域极端降水变化的原因之一。通过MMK法,分别对流域年、雨季和旱季均温进行趋势分析(图7),在研究时段内3个时间尺度上气温升高趋势均非常显著:在年尺度上,气温呈上升趋势的站点占全部站点的97%,其中,82%的站点呈显著上升趋势,仅有2个站点呈下降趋势,均位于流域上游。在雨季,气温呈上升趋势的站点占全部站点的96%,其中,73%的站点呈显著上升趋势。仅有3个站点呈下降趋势。在旱季,气温呈上升趋势的站点占全部站点的99%,其中73%站点呈显著上升趋势。珠江流域在研究时段内年均温和季节均温呈显著上升趋势,只有流域上游海拔较高地区出现极少数气温呈下降趋势和不显著上升趋势的站点。而从极端降水量级、频率等趋势变化特征空间分布来看,极端降水量级及频率等显著上升的区域也主要在珠江流域下游,尤其是珠三角地区。两者在空间分布上有一致性,显著气温变化对极端降水的影响。
图7 珠江流域各站点1952~2013年间年均温变化趋势的空间分布
Fig.7 Spatial distribution of the variation tendency of mean annual temperature in the Pearl River Basin in 1952-2013
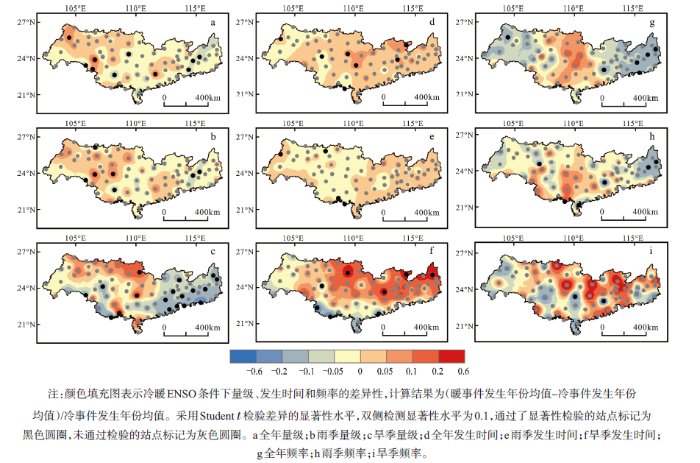
本文分析暖ENSO事件(厄尔尼诺事件)与冷ENSO事件(拉尼娜事件)对不同时间尺度下珠江流域极端降水量级、发生时间和频率影响的差异性,并采用Student t检验差异的显著性,置信区间为90%(图8)。由图8看出,当ENSO处于暖事件时,珠江流域上游极端降水量级都呈增加趋势,流域下游以及南部边缘极端降水量级减少,其中流域上游旱季极端降水减少趋势显著。珠江流域中下游极端降水发生时间在ENSO处于冷事件时滞后,珠江流域东北区旱季极端降水呈显著滞后。在全年和雨季尺度上,珠江流域中游区域极端降水发生次数在ENSO处于暖事件时增加,而其下游与上游地区极端降水事件发生频率则呈减少趋势,其中年尺度上流域下游极端降水发生频率减少趋势显著。而在旱季,流域下游地区呈增多趋势,表明珠江流域下游旱季极端降水过程呈加剧趋势。
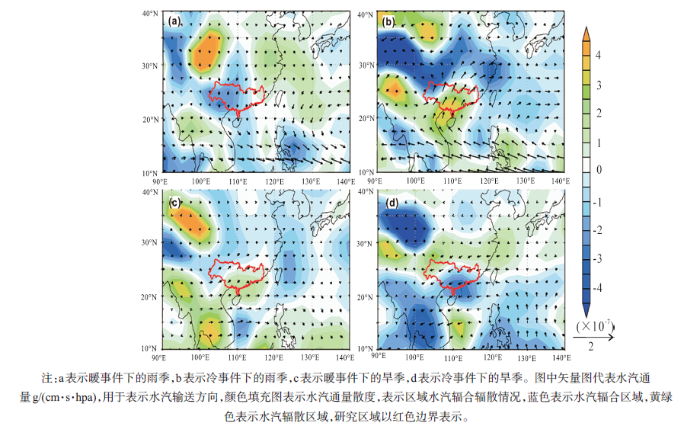
为进一步探讨珠江流域极端降水时空特征形成机理,本文进一步研究了不同冷暖ENSO过程中水汽通量变化(图9)。从图9看出,在雨季,ENSO暖事件下珠江流域西部出现明显的水汽辐合异常,该区大气中水汽含量增加,因此发生极端降水的风险也可能增加。而ENSO冷事件下流域西北表现为异常的水汽辐合,而流域中部表现出明显的水汽辐散异常,该区水汽含量减少,发生极端降水的量级也会相应减少,与图8b中表现的现象相一致。ENSO冷事件下,从珠江流域到江淮流域表现出明显的水汽输送异常,使江淮地区及中国中部地区水汽辐合增加。而在旱季,ENSO冷事件下,珠江流域的东南区域出现大量的水汽辐合,该去水汽含量增加,流域东南部发生极端降水的量级也在ENSO冷事件系下相应增加。从图8和图9的对比可以看出量级与水汽通量关系密切。
图8 暖冷ENSO事件对珠江流域极端降水量级、发生时间和频率的影响
Fig.8 The influence of different ENSO events for magnitude, frequency and occur time of extreme precipitation in the Pearl River Basin
图9 暖冷ENSO事件下珠江流域850 hPa水汽输送距平场
Fig.9 Moisture transmission field of 850 hPa in the Pearl River Basin under different ENSO events
本文利用POT抽样法进一步研究珠江流域74个气象站点1952~2013年极端降水在量级、频率和发生时间等3个方面的年及季节变化,并从气温、ENSO以及不同ENSO事件水汽通量的变化等多个角度全面探讨了珠江流域极端降水时空特征机理,得到以下结论:
1) 珠江流域极端降水过程存在年内聚集现象,该流域极端降水多发时期为每年4~9月,少发期为10月至次年3月。每年的6月极端降水发生频率最高。
2) 全年、雨季珠江流域极端降水事件在年际间均呈低离散,年际间极端降水发生次数差异不大。而在旱季,珠三角地区呈高离散现象,极端降水在年际上显著存在多发与少发年份,意味着更高的洪旱灾害风险。珠三角地区是中国经济最为发达的地区之一,且城镇化高度发达,人口密集,旱季的高洪旱灾害风险将对该区域水资源配置以及水资源应急管理提出了新的挑战与急需要解决的科学问题,应当引起重视。
3) 通过对极端降水量级、发生时间和频率变化趋势的分析,认为珠江流域极端降水整体上量级增大,发生时间提前,发生频率更趋频繁。在3个时间尺度上,旱季的变化趋势最为明显。从空间分布特征来看,极端降水频次和量级呈上升趋势的区域主要为珠江流域下游以及流域南部区域,而极端降水频次上升趋势不显著或呈下降趋势的区域主要位于流域上游高海拔区域.
4) 分析气温对极端降水过程影响,结果表明珠江流域大部分区域年均温在研究时段内呈显著上升趋势,气温呈不显著上升趋势甚至呈下降趋势的站点多分布于流域上游区域。温度变化趋势与极端降水频率变化在时空特征上具有相似性,气温变化可被认为是珠江流域极端降水过程加剧的重要因素之一。
5) ENSO处于暖事件易致珠江流域上游极端降水量级增加;而东部沿海区域极端降水量级显著下降;ENSO处于冷事件时,珠江流域上游地区极端降水发生时间提前,而东部沿海区域极端降水发生时间推后。ENSO处于暖事件时珠江流域的旱季极端降水频率显著增大。水汽通量是影响流域极端降水量级的主要因素。在ENSO冷暖事件的影响下,珠江流域会显示出不同的水汽辐合和辐散现象,进而来影响该年份极端降水的特性。
The authors have declared that no competing interests exist.
| [1] |
Atmospheric warming and the amplification of precipitation extremes [J]. |
| [2] |
Climate extremes: Observations modelingand impacts [J].https://doi.org/10.1126/science.289.5487.2068 URL PMID: 11000103 [本文引用: 2] 摘要
One of the major concerns with a potential change in climate is that an increase in extreme events will occur. Results of observational studies suggest that in many areas that have been analyzed, changes in total precipitation are amplified at the tails, and changes in some temperature extremes have been observed. Model output has been analyzed that shows changes in extreme events for future climates, such as increases in extreme high temperatures, decreases in extreme low temperatures, and increases in intense precipitation events. In addition, the societal infrastructure is becoming more sensitive to weather and climate extremes, which would be exacerbated by climate change. In wild plants and animals, climate-induced extinctions, distributional and phenological changes, and species' range shifts are being documented at an increasing rate. Several apparently gradual biological changes are linked to responses to extreme weather and climate events.
|
| [3] |
Asymmetry of tropical precipitation change under global warming [J].https://doi.org/10.1029/2007GL030327 URL [本文引用: 1] 摘要
ABSTRACT 1] A clear trend of tropical precipitation changes induced by global warming is found in hemispherical averages of most climate model simulations as well as from observation. It is observed that in response to global warming, an asymmetric pattern develops between tropical precipitation changes in the northern and southern hemispheres, and this asymmetry is locked with the seasonal cycle of tropical convection. In boreal summer (winter), the northern hemispherical average departure from tropical mean increases (decreases), while the departure of the southern hemispherical average decreases (increases). This implies an enhanced seasonal precipitation range between rainy and dry seasons and an increased precipitation difference.
|
| [4] |
Influence of ENSO on precipitation in the East River basin, South China [J].https://doi.org/10.1002/jgrd.50279 URL [本文引用: 2] 摘要
A majority of the literature analyzing the role of El Nio-Southern Oscillation (ENSO) and other teleconnections has focused on summer precipitation and on global and regional scales. Seasonal precipitation, occurring at local scale (<50,000 km; i.e., a size of one grid cell of a typical global climate model), is of considerable importance for flood mitigation, water supply, and water resources management. In view of the relative absence of studies exploring the forces driving local precipitation, the present study examines this precipitation regime (represented by monthly precipitation data for a period of 1956-2005 from 21 gauge stations in the East River basin) as a response to well-known determining factors, i.e., Southern Oscillation and sea surface temperature anomalies (SSTA) of To achieve the goal of the study, three types of ENSO events were defined: eastern Pacific warming (EPW), central Pacific warming (CPW), and eastern Pacific cooling (EPC). Mann-Whitney U test was applied to assess whether the probabilistic behavior of precipitation in the ENSO period was different from that in the normal period. The Pearson correlation coefficient was calculated to investigate the relations between areal precipitation in the East River basin and the above-mentioned ENSO indices. Results indicated that (1) EPW caused more precipitation in autumn and winter, but less precipitation in summer. EPW even brought about extremely heavy precipitation in summer and winter. (2) CPW caused less precipitation in spring, autumn, and the annual totals. Sometimes, CPW might bring about heavy precipitation. The precipitation pattern in summer in CPW was different from the normal years. (3) EPC caused more precipitation in autumn and less precipitation in spring and winter. The middle East River basin is the region where precipitation has decreased most severely due to EPC. (4) SSTA, SOI, and EMI had significant relations with areal precipitation from January to March. EMI is the only index having significant correlation with precipitation in April.
|
| [5] |
Changing properties of precipitation concentration in the pearl river basin,China [J].https://doi.org/10.1007/s00477-008-0225-7 Magsci 摘要
<a name="Abs1"></a>In this paper, precipitation concentrations across the Pearl River basin and the associated spatial patterns are analyzed based on daily precipitation data of 42 rain gauging stations during the period 1960–2005. Regions characterized by the different changing properties of precipitation concentration index (CI) are identified. The southwest and northeast parts of the Pearl River basin are characterized by lower and decreasing precipitation CI; the northwest and south parts of the study river basin show higher and increasing precipitation CI. Higher but decreasing precipitations CI are found in the West and East River basin. Comparison of precipitation CI trends before and after 1990 shows that most parts of the Pearl River basin are characterized by increasing precipitation CI after 1990. Decreasing precipitation CI after 1990 (compared to precipitation CI changes before 1990) is observed only in a few stations located in the lower Gui River and the lower Yu River. Significant increasing precipitation CI after 1990 is detected in the West River, lower North River and upper Beipan River. These changes of precipitation CI in the Pearl River basin are likely to be associated with the consequences of the well-evidenced global warming. These findings can contribute to basin-scale water resource management and conservation of ecological environment in the Pearl River basin.
|
| [6] |
珠江流域降雨特征研究 [J].https://doi.org/10.3969/j.issn.1001-9235.2012.05.003 URL 摘要
采用珠江流域42个站点1960-2005年46年间的日降雨资 料,定义了关于降雨的三大类指标:基本降雨指标、极端降雨指标和连续降雨指标,运用MMK法对降雨序列的变化趋势进行显著性检验,以此从不同角度全面的剖 析了珠江流域降雨的变化特征,为深入理解珠江流域降雨的变化规律提供一些视角,也为科学理解洪旱灾害与降雨规律的内在成因提供事实基础,同时也有利于全球 气候变化与人类活动作用影响下,珠江流域水资源的有效管理与利用.
Changing properties of precipitation regimes over the Pearl River Basin. https://doi.org/10.3969/j.issn.1001-9235.2012.05.003 URL 摘要
采用珠江流域42个站点1960-2005年46年间的日降雨资 料,定义了关于降雨的三大类指标:基本降雨指标、极端降雨指标和连续降雨指标,运用MMK法对降雨序列的变化趋势进行显著性检验,以此从不同角度全面的剖 析了珠江流域降雨的变化特征,为深入理解珠江流域降雨的变化规律提供一些视角,也为科学理解洪旱灾害与降雨规律的内在成因提供事实基础,同时也有利于全球 气候变化与人类活动作用影响下,珠江流域水资源的有效管理与利用.
|
| [7] |
近50a来珠江流域降水变化趋势分析 [J].https://doi.org/10.11849/zrzyxb.2014.01.008 URL Magsci 摘要
全球气候变化和人类活动影响下,近年来珠江流域降水时空分布变化显著。论文利用珠江流域62 个站点1959—2009 年逐日降水序列,选取Mann-Kendall 统计检验方法和有序聚类法,研究了该流域16 个降水特征指数的趋势变化和变异特征,得到如下结论:①流域全年、春季、冬季降水量呈微弱上升趋势,秋季降水量为稳定下降趋势,夏季降水量无明显变化趋势。夏季降水变化趋势对全年降水变化趋势的空间分布影响最大,春秋次之,冬季最小;②流域春、冬两季降水占全年降水比例呈上升趋势,夏、秋两季降水占全年降水比例呈下降趋势;③流域全年降水日数和小雨日数呈显著下降趋势,中雨日数没有明显变化趋势,大雨、暴雨日数和95 百分位值降水日数均呈上升趋势。全年、小雨和暴雨降水日数显著突变时段发生在20 世纪90 年代初;④流域日平均降水量呈稳定上升趋势,降水时段趋于集中化。
https://doi.org/10.11849/zrzyxb.2014.01.008 URL Magsci 摘要
全球气候变化和人类活动影响下,近年来珠江流域降水时空分布变化显著。论文利用珠江流域62 个站点1959—2009 年逐日降水序列,选取Mann-Kendall 统计检验方法和有序聚类法,研究了该流域16 个降水特征指数的趋势变化和变异特征,得到如下结论:①流域全年、春季、冬季降水量呈微弱上升趋势,秋季降水量为稳定下降趋势,夏季降水量无明显变化趋势。夏季降水变化趋势对全年降水变化趋势的空间分布影响最大,春秋次之,冬季最小;②流域春、冬两季降水占全年降水比例呈上升趋势,夏、秋两季降水占全年降水比例呈下降趋势;③流域全年降水日数和小雨日数呈显著下降趋势,中雨日数没有明显变化趋势,大雨、暴雨日数和95 百分位值降水日数均呈上升趋势。全年、小雨和暴雨降水日数显著突变时段发生在20 世纪90 年代初;④流域日平均降水量呈稳定上升趋势,降水时段趋于集中化。
|
| [8] |
Detecting changes in extreme precipitation and extreme streamflow in the Dongjiang River Basin in southern China [J].https://doi.org/10.5194/hess-12-207-2008 URL [本文引用: 1] 摘要
Abstract Extreme hydro-meteorological events have become the focus of more and more studies in the last decade. Due to the complexity of the spatial pattern of changes in precipitation processes, it is still hard to establish a clear view of how precipitation has changed and how it will change in the future. In the present study, changes in extreme precipitation and streamflow processes in the Dongjiang River Basin in southern China are investigated with several nonparametric methods, including one method (Mann-Kendall test) for detecting trend, and three methods (Kolmogorov–Smirnov test, Levene’s test and quantile test) for detecting changes in probability distribution. It was shown that little change is observed in annual extreme precipitation in terms of various indices, but some significant changes are found in the precipitation processes on a monthly basis, which indicates
|
| [9] |
新疆塔河流域洪水量级、频率及峰现时间变化特征、成因及影响 [J].https://doi.org/10.11821/dlxb201509003 Magsci [本文引用: 1] 摘要
<p>采用塔里木河流域(塔河流域)8个水文站及相应气象站数据,全面分析了洪水发生量级、频率和峰现时间等特征,研究洪水发生成因及其影响。结果表明:1980s中后期塔河流域气温与降水持续增加,整个塔河流域年及季节洪峰流量普遍呈上升趋势,大部分在1980s中后期发生突变。1980s中期以后塔河流域年及季节洪峰流量呈持续增加或者显著增加趋势,量级位于整个观测时期均值之上,处于洪水“丰富”期。“丰富”期暴雨型和升温型洪水发生次数及造成的灾害损失均呈显著增加趋势,引起严重洪灾损失的洪水也集中在这一时期,且多由暴雨型洪水引发。大量级洪水(最大三场洪水及重现期大于10年的洪水)多集中发生在1990年之后,并且易引发多个水文站点同时出现。</p>
Magnitude, frequency and timing of floods in the Tarim River,Xinjiang:Characteristics, causes and impacts. https://doi.org/10.11821/dlxb201509003 Magsci [本文引用: 1] 摘要
<p>采用塔里木河流域(塔河流域)8个水文站及相应气象站数据,全面分析了洪水发生量级、频率和峰现时间等特征,研究洪水发生成因及其影响。结果表明:1980s中后期塔河流域气温与降水持续增加,整个塔河流域年及季节洪峰流量普遍呈上升趋势,大部分在1980s中后期发生突变。1980s中期以后塔河流域年及季节洪峰流量呈持续增加或者显著增加趋势,量级位于整个观测时期均值之上,处于洪水“丰富”期。“丰富”期暴雨型和升温型洪水发生次数及造成的灾害损失均呈显著增加趋势,引起严重洪灾损失的洪水也集中在这一时期,且多由暴雨型洪水引发。大量级洪水(最大三场洪水及重现期大于10年的洪水)多集中发生在1990年之后,并且易引发多个水文站点同时出现。</p>
|
| [10] |
Influence of ENSO on precipitation in the East River basin, SouthChina [J].https://doi.org/10.1002/jgrd.50279 URL [本文引用: 1] 摘要
A majority of the literature analyzing the role of El Ni帽o-Southern Oscillation (ENSO) and other teleconnections has focused on summer precipitation and on global and regional scales. Seasonal precipitation, occurring at local scale (<50,000 km; i.e., a size of one grid cell of a typical global climate model), is of considerable importance for flood mitigation, water supply, and water resources management. In view of the relative absence of studies exploring the forces driving local precipitation, the present study examines this precipitation regime (represented by monthly precipitation data for a period of 1956-2005 from 21 gauge stations in the East River basin) as a response to well-known determining factors, i.e., Southern Oscillation Index (SOI),Modoki index (EMI), and sea surface temperature anomalies (SSTA) of.To achieve the goal of the study, three types of ENSO events were defined: eastern Pacific warming (EPW), central Pacific warming (CPW), and eastern Pacific cooling (EPC). Mann-Whitney U test was applied to assess whether the probabilistic behavior of precipitation in the ENSO period was different from that in the normal period. The Pearson correlation coefficient was calculated to investigate the relations between areal precipitation in the East River basin and the above-mentioned ENSO indices. Results indicated that (1) EPW caused more precipitation in autumn and winter, but less precipitation in summer. EPW even brought about extremely heavy precipitation in summer and winter. (2) CPW caused less precipitation in spring, autumn, and the annual totals. Sometimes, CPW might bring about heavy precipitation. The precipitation pattern in summer in CPW was different from the normal years. (3) EPC caused more precipitation in autumn and less precipitation in spring and winter. The middle East River basin is the region where precipitation has decreased most severely due to EPC. (4) SSTA, SOI, and EMI had significant relations with areal precipitation from January to March. EMI is the only index having significant correlation with precipitation in April.
|
| [11] |
Observed changes of drought/wetness episodes in the Pearl River basin, China, using the standardized precipitation index and aridity index [J].https://doi.org/10.1007/s00704-008-0095-4 URL [本文引用: 1] 摘要
Monthly precipitation data of 42 rain stations over the Pearl River basin for 1960-2005 were analyzed to classify anomalously wet and dry conditions by using the standardized precipitation index (SPI) and aridity index (1) for the rainy season (April-September) and winter (December-February). Trends of the number of wet and dry months decided by SPI were detected with Mann-Kendall technique. Furthermore, we also investigated possible causes behind wet and dry variations by analyzing NCAR/NCEP reanalysis dataset. The results indicate that: (1) the Pearl River basin tends to be dryer in the rainy season and comes to be wetter in winter. However, different wetting and drying properties can be identified across the basin: west parts of the basin tend to be dryer; and southeast parts tend to be wetter; (2) the Pearl River basin is dominated by dry tendency in the rainy season and is further substantiated by aridity index (1) variations; and (3) water vapor flux, moisture content changes in the rainy season and winter indicate different influences of moisture changes on wet and dry conditions across the Pearl River basin. Increasing moisture content gives rise to an increasing number of wet months in winter. However, no fixed relationships can be observed between moisture content changes and number of wet months in the rainy season, indicating that more than one factor can influence the dry or wet conditions of the study region. The results of this paper will be helpful for basin-scale water resource management under the changing climate.
|
| [12] |
Regional frequency analysis of droughts in China: a multivariate perspective [J].https://doi.org/10.1007/s11269-014-0910-x URL [本文引用: 1] 摘要
Joint probability behavior of droughts is important for China due to the fact that China is the agricultural country with the largest population in the world and it is particularly the case in the backdrop of intensifying weather extremes in a warming climate. In this case, regionalization of droughts is done using Fuzzy C- Means (FCM) clustering technique and also multivariate L-moment method. Besides, copula is used to estimate regional joint probability in terms of drought duration and severity. Evaluation of uncertainty in the joint probability curves is done using the Bootstrap resampling technique. The results indicate that: (1) five homogenous regions of droughts are subdivided. Regionalization in this study clarified the changing properties or nature of droughts, i.e., the blurred or ambiguous boundaries of the drought-impacted regions; (2) droughts in the northwest China are characterized by longer drought duration and larger drought severity, and the occurrence of the droughts in the northwest China is subject to be higher due to longer waiting time between drought events. Adverse is found for changes of droughts in the southeast China. The droughts in the north China are moderate in terms of drought duration and severity and also waiting time between drought events when compared to those in the northwest and southeast China; (3) the regional joint frequency curves are obtained with respect to drought duration and severity using the bivariate copula functions. Then the joint probabilities of droughts can be calculated using the regional probability curves and also results of mean drought duration, drought severity and waiting time between drought events. Furthermore, droughts in the regions without meteorological data can also be estimated in terms of joint probability using index-drought method proposed in this study. This study will provides theoretical and practical grounds for development and enhancement of human mitigation to drought hazards in China, and is of great importance in terms of planning and management of water resources and agricultural activities in the backdrop of intensifying weather extremes under the influences of warming climate. Copyright Springer Science+Business Media Dordrecht 2015
|
| [13] |
基于POT模型建立大坝服役性态预警指标 [J].
借助预警指标实时辨识大坝服役性态是大坝安全监控的重要手段。传统多依据大坝服役性态效应量测值序列的年极值为分析子样来估计预警指标。本文基于极值理论中的POT(Peaks over Threshold)模型,通过阈值的设定,以超限数据序列作为建模分析的对象,利用广义帕累托分布拟合超限数据子样,结合大坝的失事概率实现预警指标的估计。该方法不研究效应量测值序列的整体分布情况,只关注序列的超限值分布情况;充分考虑了所有较大测值出现的可能,更好地体现了数据样本的分布特征,因此得到的预警指标能更客观地反映工程实际。
Early-warning index for dam service behavior based on POT model.
借助预警指标实时辨识大坝服役性态是大坝安全监控的重要手段。传统多依据大坝服役性态效应量测值序列的年极值为分析子样来估计预警指标。本文基于极值理论中的POT(Peaks over Threshold)模型,通过阈值的设定,以超限数据序列作为建模分析的对象,利用广义帕累托分布拟合超限数据子样,结合大坝的失事概率实现预警指标的估计。该方法不研究效应量测值序列的整体分布情况,只关注序列的超限值分布情况;充分考虑了所有较大测值出现的可能,更好地体现了数据样本的分布特征,因此得到的预警指标能更客观地反映工程实际。
|
| [14] |
A modified Mann-Kendall trend test for autocorrelated data [J].https://doi.org/10.1016/S0022-1694(97)00125-X URL [本文引用: 1] 摘要
One of the commonly used tools for detecting changes in climatic and hydrologic time series is trend analysis. A number of statistical tests exist to assess the significance of trends in time series. One of the commonly used non-parametric trend tests is the Mann-Kendall trend test. The null hypothesis in the Mann-Kendall test is that the data are independent and randomly ordered. However, the existence of positive autocorrelation in the data increases the probability of detecting trends when actually none exist, and vice versa. Although this is a well-known fact, few studies have addressed this issue, and autocorrelation in the data is often ignored. In this study, the effect of autocorrelation on the variance of the Mann-Kendall trend test statistic is discussed. A theoretical relationship is derived to calculate the variance of the Mann-Kendall test statistic for autocorrelated data. The special cases of AR(1) and MA(1) dependence are discussed as examples. An approximation to the theoretical relationship is also presented in order to reduce computation time for long time series. Based on the modified value of the variance of the Mann-Kendall trend test statistic, a modified non-parametric trend test which is suitable for autocorrelated data is proposed. The accuracy of the modified test in terms of its empirical significance level was found to be superior to that of the original Mann-Kendall trend test without any loss of power. The modified test is applied to rainfall as well as streamflow data to demonstrate its performance as compared to the original Mann-Kendall trend test.
|
| [15] |
Climate change [M]. |
| [16] |
泊松回归模型[A] .Poisson regression model. |
| [17] |
Changing frequency of heavy rainfall over the central United States [J].https://doi.org/10.1175/JCLI-D-12-00043.1 Magsci [本文引用: 1] 摘要
Records of daily rainfall accumulations from 447 rain gauge stations over the central United States (Minnesota, Wisconsin, Michigan, Iowa, Illinois, Indiana, Missouri, Kentucky, Tennessee, Arkansas, Louisiana, Alabama, and Mississippi) are used to assess past changes in the frequency of heavy rainfall. Each station has a record of at least 50 yr, and the data cover most of the twentieth century and the first decade of the twenty-first century. Analyses are performed using a peaks-over-threshold approach, and, for each station, the 95th percentile is used as the threshold. Because of the count nature of the data and to account for both abrupt and slowly varying changes in the heavy rainfall distribution, a segmented regression is used to detect changepoints at unknown points in time. The presence of trends is assessed by means of a Poisson regression model to examine whether the rate of occurrence parameter is a linear function of time (by means of a logarithmic link function). The results point to increasing trends in heavy rainfall over the northern part of the study domain. Examination of the surface temperature record suggests that these increasing trends occur over the area with the largest increasing trends in temperature and, consequently, with an increase in atmospheric water vapor.
|
| [18] |
Regionalization and spatial changing properties of droughts across the Pearl River basin ,China [J].https://doi.org/10.1016/j.jhydrol.2012.09.054 URL [本文引用: 1] 摘要
ABSTRACT In frequency analysis for droughts, the absence of lengthy records usually limits the reliability of statistical estimates. To overcome this limitation, a “regional” analysis approach is often used. Hydrological events typically have multivariate characteristics; therefore it is logical to jointly consider these characteristics when carrying out a multivariate regional frequency analysis for these events. This study presents a method for regional frequency analysis in the Pearl River basin using the multivariate L-moments homogeneity test. Results indicate that the Pearl River basin can be categorized into five homogeneous regions in terms of drought variation, and the Plackett copula fits well for all of the homogeneous regions. The frequency analysis of all sites in each homogeneous region shows that the Pearl River Delta is characterized by a high drought risk, while a relatively lower drought risk in the west and northeast parts of the Pearl River basin. Results of this study will be useful for basin-scale water resources management across the Pearl River basin.
|
| [19] |
Statistical behaviors of precipitation regimes in China and their links with atmospheric circulation 1960-2005 [J].https://doi.org/10.1002/joc.2193 Magsci [本文引用: 1] 摘要
In this study, we comprehensively analysed daily precipitation time series of 590 rain stations in China covering 1960-2005. Ten indices were defined to evaluate changing patterns of precipitation regimes and trend detection was performed using Mann-Kendall trend test and linear regressive technique. For the sake of better understanding of underlying causes behind changing properties of precipitation regimes, we also investigated spatial and temporal variations of atmospheric circulation of water vapour flux. The results revealed different changing properties of precipitation events across China. Generally, wet tendency was identified in the south China and dry tendency in north China. Besides, slight wet tendency could be found in northwest China. In addition, increasing precipitation intensity could be observed mainly in the lower Yangtze River basin and the Pearl River basin. Remarkable seasonal shifts of wet/dry conditions were also detected in China: wet tendency in winter and dry tendency in summer. Furthermore, this study revealed good agreement between spatial distribution of precipitation regimes and water vapour flux, showing tremendous influences of water vapour flux on the precipitation changes across China. Regions east to 100 E were dominated by increasing water vapour flux in winter. Weaker East Asian Summer Monsoon was the main cause responsible for decreasing northward propagation of water vapour flux, causing different wet (dry) tendency in south (north) China. This study can provide theoretical evidence for effective water resource management and sound arrangement of agriculture activities on river basin scale under the changing environment across China. Copyright. (C) 2010 Royal Meteorological Society
|

/
| 〈 |
|
〉 |