陆晴 , 吴绍洪
, 吴绍洪
Lu Qing, Wu Shaohong
中图分类号: K903
文献标识码: A
文章编号: 1000-0690(2017)02-0292-09
收稿日期: 2016-03-25
修回日期: 2016-07-5
网络出版日期: 2017-02-25
版权声明: 2017 《地理科学》编辑部 本文是开放获取期刊文献,在以下情况下可以自由使用:学术研究、学术交流、科研教学等,但不允许用于商业目的.
基金资助:
作者简介:
作者简介:陆晴 (1986-),女,江西高安人,博士研究生,研究方向为综合自然地理及气候变化等。E-mail:luqing_0920@126.com
展开
摘要
利用GIMMS NDVI数据和地面气象站台观测数据,对青藏高原1982~2013年高寒草地覆盖时空变化及其对气象因素的响应进行研究,结果表明:青藏高原高寒草地生长季NDVI表现为从东南到西北逐渐减少的趋势,近32 a来,整个高原草地生长季NDVI呈上升趋势,增加速率为0.000 3/a (p<0.05);高寒草地生长季NDVI年际变化具有空间异质性,整体为增加趋势,呈增加趋势的面积约占研究区域面积的75.3%,其中显著增加的占26.0% (p<0.05),类型主要为分布在青藏高原东北部地区的高寒草甸;比例为4.7%,草地类型主要为高寒草原,主要分布在高原西部地区;基于生态地理分区的分析显示,青藏高原草地与降水、温度的相关关系具有明显的空间差异,高寒草地生长季NDVI均值与降水呈显著正相关,对降水的滞后效应显著;高原东北部温度较高,热量条件较好,降水为高寒草地生长季NDVI变化的主导因子;东中部地区降水充沛,温度则为高寒草地生长的制约因子;南部地区降水和温度都较适宜,均与高寒草地生长季NDVI相关性显著(p< 0.05),共同作用于草地的生长;中部和西部地区,气候因子与高寒草地生长季NDVI关系均不显著。
关键词:
Abstract
The response of structure and function of terrestrial ecosystem to global climate change has become a major point. Vegetation is an essential component of the terrestrial ecosystem which has proved to be sensitive to climate change. Normalized Difference Vegetation Index (NDVI) is widely recognized as a good indicator of vegetation coverage and productivity, has been widely used to indicate vegetation activity and dynamics, also vegetation growth, ecosystem structure and functions respond to climate change. Climate warming has important influence on the vegetation coverage, and alpine grassland is one of the most significant vegetation type on the Qinghai-Tibet Plateau. This study used GIMMS NDVI data sets and climate data from 40 meteorological stations to investigate spatial and temporal variations of alpine grassland cover and the response of NDVI to climatic variables on the Qinghai-Tibet Plateau in 1982-2013. The results showed that the average growing season NDVI is high in the southeast and low in the northwest. As a whole, the alpine grassland cover tended to increase on the Qinghai-Tibet Plateau, with the rate of 0.000 3/a (p<0.05) in the past 32 years. Spatially, the tendency of alpine grassland NDVI showed great heterogeneity, with the significantly NDVI increased mainly distributed in the northeastern part of Qinghai-Tibet Plateau dominated by alpine meadow which approximates to 26.0% (p<0.05) of the total study area. The area with significantly decreased area accounted for 4.7%, mainly emerged in the western part where the grassland was dominated by alpine steppe. In the regional scale, the variation in alpine grassland cover was more closely related to precipitation than other climate factors. The spatial characteristics of the relationship between growing season NDVI and climatic variables were analyzed based on the eco-geographical regions. Significant lagged correlations between precipitation and seasonal NDVI were found for the alpine steppe. The results suggested that precipitation was the key limit variable in the northeastern part of Qinghai-Tibet Plateau with higher annual mean temperature. But in the eastern and central eco-regions with the more rainfall, temperature could limit the growth of grassland vegetation. In the southern plateau with more precipitation and higher temperature compared with other regions, the correlations between alpine grassland cover and climatic factors were significant positive. The change of alpine grassland cover was not significantly relevant to climatic variables in the middle and western part of Qinghai-Tibet Plateau.
Keywords:
全球气候变化在一定程度上改变着陆地生态系统的结构、功能等特征,进而对社会经济和人类生产环境产生严重影响,因此成为许多科学家、政治家以及普通民众关注的焦点问题之一[1,2]。已有的观测资料表明,近百年来全球平均地表温度升高了0.85℃[0.65~1.06℃],到2100年将升高0.3~4.8℃[3]。青藏高原平均海拔超过4 000 m,是地球上一个独特的地形单元,平均温度明显低于同纬度其它地区,被称为地球的“第三极”。青藏高原不仅是气候变化的敏感区域,而且对周边地区乃至全球的气候具有强烈影响,因此,青藏高原又被称为是全球气候变化的触发器和放大器[4]。以气候变暖为主要特征的气候变化对青藏高原的土地覆盖变化具有重要影响,而高寒草地变化是受气候变化影响最为显著的植被类型之一[5]。青藏高原高寒草地面积广阔,约占中国草地总面积的1/3[6],是中国最大的草地畜牧业基地,同时也是气候变化和人类活动影响的敏感区域,因此,研究青藏高原高寒草地覆盖变化及其与气候的关系对草地畜牧业可持续发展和草地生态系统服务功能的提高具有重要意义。
归一化植被指数 (Normalized difference vegetation index, NDVI) 与植物吸收的光合有效辐射[7]、叶面积指数[8]、潜在光合作用[9]及生物量[10]等紧密相关,经常被用于植被生长状况、覆盖等方面的研究,并且在全球[11]、欧亚大陆[12]、中国[13]以及青藏高原[14]等不同尺度区域得到了应用。在植被的气候变化响应研究中,NDVI时间序列数据常用来分析植被覆盖特征[11,15]及其与气候因子之间的关系[7,16]。NDVI在青藏高原的应用主要集中在植被、草地覆盖年际、季节变化及其与气候因素的关系[17~21],但当前的研究,很多并未区分不同植被类型对气候变化响应的差异,此外,即使同一植被类型在不同的环境条件下对气候变化的响应也不尽相同。青藏高原面积大,草地分布广、类型多样,因此在植被覆盖对气候变化的响应研究中,应考虑植被类型和环境条件的差异所导致响应方式和方向的不同。
本研究基于1982~2013年的GIMMS (The Global Inventory Modeling and Mapping Studies) 每15 d合成的NDVI数据和地面气象站台观测数据,分析青藏高原草地 (高寒草甸和高寒草原) 生长季NDVI均值年际变化趋势,并在生态地理区划的基础上,探讨不同区域生长季NDVI均值与降水、温度等气象因子的相关关系,了解草地覆盖变化的主要驱动因子,以期为气候变化背景下未来高寒草地覆盖变化趋势提供依据。
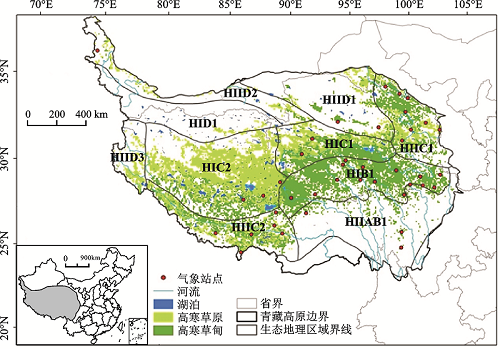
青藏高原地域辽阔,位于中国西南部,西起帕米尔高原,东至横断山脉,南自喜马拉雅山脉南缘,北迄昆仑山—祁连山北麓,范围为26°00′12″N~39°46′50″N,73°18′52″E~104°46′59″E(图1),南北纵贯约13个纬度,约1 532 km,东西横跨约31个经度,约2 945 km,总面积为2.57×10⁶km2,占中国陆地总面积的26.8%[22]。在行政区划上青藏高原包括6个省区,即西藏自治区和青海省大部,以及四川、云南、甘肃省和新疆维吾尔自治区的部分地区。青藏高原平均海拔在4 000 m以上,总体地势西北高,东南低,高原上耸立着一系列巨大山系和群峰,由于其特高地势而被喻为“世界屋脊”、“地球第三极”[6]。青藏高原高亢的地势、广袤的幅员和中低纬度的位置决定着其自然环境的基本特征,气候特征表现为太阳辐射强、气温低、气温日较差和年较差大等;土壤发育仍处于新的成土过程中,广布于高原上的高山草甸土和高山寒漠土等大部分具有土层薄、粗骨性强、风化程度较低等特点;植被类型多样,包括了除属极地冻原以外的中国大部分主要植被类型,主要表现为高山草甸、草原和高寒荒漠景观,自然植被一般具有抗风、耐盐等生态特征;由于自然条件和社会历史原因,人类活动对青藏高原自然环境影响较弱,主要表现为人类开发历史短、人口分布稀疏、畜牧业和种植业较粗放等特点[23]。
图1 研究区位置及草地类型、气象站点和生态地理区域分布
Fig.1 Location of the study area, grassland types, meteorological stations and eco-geographical regions
1) 本研究采用的NDVI数据为Global Inventory Modeling and Mapping Studies (GIMMS)提供的时间序列为1982~2013年的数据集,时间分辨率为15 d,空间分辨率为8 km[24],该数据为目前最长时间序列的NDVI数据。原始数据经过了一系列的预处理来消除非植被因素的干扰,包括辐射校正、几何校正、除坏线、除云、消除卫星轨道漂移影响及不同卫星数据之间的标定等处理,使得GIMMS NDVI数据具有较高精度、误差小,在全球及区域大尺度植被覆盖变化的研究中已得到广泛应用[12,13,21]。为了进一步消除大气气溶胶、云、阴影、太阳高度角等对数据的影响[12],本文采用最大合成法MVC(Maximum Value Composites)生成月尺度NDVI值。春冻 (日均温<0℃) 后6 d温度的均值大于5℃的第一天作为起始日期,10 d均温小于5℃的第一天作为最后1 d,这期间的日期被定义为生长季[25]。结合前人研究成果,本研究将生长季定义为每年的5~9月[26]。
2) 选取1982~2013年青藏高原地区40个气象站点 (见图1) 的日均温、月降水气象数据。该数据主要来源于中国气象数据网的中国地面国际交换站气候资料日值数据集和中国地面国际交换站气候资料月值数据集(http://data.cma.cn/)。依据气象数据得到生长季 (5~9月) 降水量 (P) 和温度月均值 (T)、大于5℃积温 (AT5)、温度大于5℃日数 (D5)、降水量最大月值 (Pmax)、最大月均温 (Tmax)及水热系数 (Hydrothermic coefficent, HC)等数据。本文水热系数为生长季降水量和大于5℃积温之比。
3) 植被类型数据植被数据主要来源于中国科学院中国植被图编辑委员会编纂的1:100万中国植被图[27]。
4) 生态地理分区青藏高原生态分区图采用的是郑度等的中国生态地理区域图[23]。根据中国生态地理区划,青藏高原可以划分为10个自然地区(图1和表1),主要包括高原严寒带 (HI) 和高原温带 (HII) 2个温度带,以及湿润/半湿润、半湿润、半干旱和干旱地区4个干湿地区 (表1)。青藏高原高寒草地主要包括高寒草甸和高寒草原。从图1可以看出,青藏高原高寒草地大部分分布在HIB1、HIC1、HIC2、HIIC1和HIIC2这5个生态区中。根据生态区内主要植被类型,将HIB1、HIC1划分为高寒草甸区,HIC2、HIIC1和HIIC2为高寒草原区。将不同区域内多个气象站点的生长季NDVI均值、降水和均温进行求平均,得到某一区域的多年生长季数据。
表1 青藏高原生态地理区
Table 1 The eco-geographical regions of Qinghai-Tibet Plateau
| 温度带 | 干旱地区 | 生态分区 |
|---|---|---|
| HI 高原 亚寒带 | B 半湿润地区 | HІB1果洛那曲高原山地高寒灌丛草甸区 |
| C 半干旱地区 | HІC1青南高原宽谷高寒草甸草原区 | |
| HІC2羌塘高原湖盆高寒草原区 | ||
| D 干旱地区 | HІD1昆仑山高原高寒荒漠区 | |
| HII高原 温带 | A/B 湿润/半 湿润地区 | HIIA/B1川西藏东高山深谷针叶林区 |
| C 半干旱地区 | HIIC1祁连青东高山盆地针叶林、草原区 | |
| HIIC2藏南高山谷地灌丛草原区 | ||
| D 干旱地区 | HIID1柴达木盆地荒漠区 | |
| HIID2昆仑北翼山地荒漠区 | ||
| HIID3阿里山地荒漠区 |
1) 草地NDVI像元值筛选。NDVI值在0~1范围内,数值越大,表明植被的覆盖程度越高,人们通常采用年或月均NDVI为0.1作为阈值,来排除非植被因素的影响[28]。由于青藏高原植被类型数据存在不确定性,为了消除裸地、稀疏植被和常绿林的影响,本文中高寒草地NDVI像元值应满足4个条件[17]:① 5~9月NDVI均值应大于0.1;② NDVI月最大值应超过0.15;③ 月最大值应出现在7~9月间;④ 冬季NDVI均值应小于0.4。
2) 分析方法。采用一元线性回归方法求变化速率,利用相关和偏相关方法分析不同高寒草地类型及生态地理区域生长季NDVI均值与气候因子的相关程度。
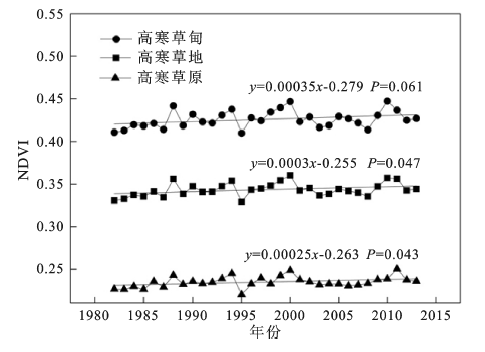
1982~2013年,青藏高原不同草地类型生长季NDVI均值均呈波动增加趋势(图2)。从整个高寒草地生长季NDVI均值来看,其值在0.33~0.36之间波动,增加趋势为0.000 3/a (p=0.047),变异系数为2.27%;高寒草甸和高寒草原的生长季NDVI均值变化范围分别为0.41~0.45、0.22~0.25,高寒草甸的增加趋势为0.000 35 /a (p=0.061),大于高寒草原的0.000 25 /a (p=0.043),高寒草甸的多年生长季NDVI均值要明显高于高寒草原;高寒草原生长季NDVI均值的变异系数比高寒草甸较高,分别为2.72%和2.28%。
图2 1982~2013年不同草地类型生长季NDVI均值年际变化趋势
Fig. 2 Interannual variations of average NDVI in growing season for different grassland types in 1982-2013
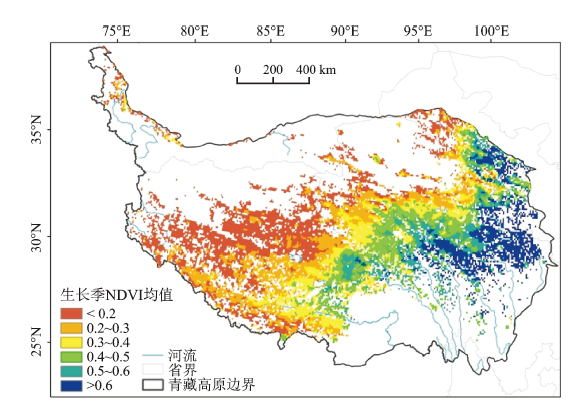
1982~2013年青藏高原生长季NDVI均值在空间上呈现明显的带状分布特征,从西北到东南表现为逐渐增加趋势(图3)。空间上各个像元生长季NDVI均值的范围在0.10~0.80之间。和图1进行对比,可以发现,生长季NDVI均值大于0.4的像元大部分属于高寒草甸。
图3 1982~2013年青藏高原高寒草地生长季NDVI均值空间分布特征
Fig.3 The distribution of average NDVI in growing season for alpine grassland in Qinghai-Tibet Plateau in 1982-2013
由于不同草地类型整体的生长季NDVI均值只能反映某一草地类型的覆盖度,因此,通过每个像元32 a来的一元线性回归结果来表征高寒草地覆盖的空间变化特征。从图4a中得出,青藏高原高寒草地大部分生长季NDVI均值呈现增加趋势,呈增加趋势的面积约占整个高寒草地总面积的75.3%,且其中约26.0%通过显著性检验 (p< 0.05),而显著减少的约占4.7% (见图4b)。显著增加的区域主要为高寒草甸,增加趋势基本都大于0.001/a,主要分布在青藏高原的东北部;发生显著减少的草地大部分为高寒草原,主要分布在青藏高原的西部,减少最大可达0.005/a,说明青藏高原高寒草原局部区域面临退化的风险。
图4 1982~2013年青藏高原生长季NDVI均值线性变化趋势(a)及显著性水平(b)空间分布特征
Fig.4 Spatial distribution of NDVI mean value trend(a) and significance level(b) in growing season of Qinghai-Tibet Plateau in 1982-2013
2.3.1 站点尺度的NDVI与温度、降水的关系
基于1982~2013年40个气象站点的生长季NDVI均值、降水及均温数据集,将NDVI与降水、温度数据分别进行一元线性回归,图5a表示生长季NDVI均值随着降水的增加而增加,随着均温的上升而减少 (图5b)。生长季NDVI均值与生长季降水的相关系数为0.68,与生长季均温的为-0.26,表明在区域尺度上降水对高寒草地生长的影响要高于温度。
图5 1982~2013年高寒草地生长季NDVI均值与生长季降水(a)、均温(b)的相关关系
Fig.5 The relationship between annual average NDVI in growing season and precipitation(a), temperature (b) for alpine grassland in 1982-2013
2.3.2 基于生态地理区划的生长季NDVI均值与气候因子的关系
为了分析草地生长对气候因子的响应及其滞后效应[19],本研究对生长季NDVI均值及同期气候因子和4~8月降水、温度进行了相关、偏相关分析(表3)。高寒草甸生长季NDVI均值与同期气候因子的关系均不显著,而与4~8月均温温度呈极显著正相关,说明高寒草甸的草地生长对温度具有一定的滞后效应。除水热系数 (HC) 外,高寒草原生长季NDVI均值与同期、4~8月各类气候因子均呈显著正相关,与温度为极显著相关(p< 0.01),与温度的相关性略高于降水。不同生态地理区域草地生长季NDVI均值与同期、4~8月气候因子的相关系数和偏相关系数见表3,HIB1区域生长季NDVI均值与温度各类因子(T、Tmax、AT5和D5)均为显著正相关(p< 0.05),与降水相关性较弱,与水热系数为显著负相关,该区降水量大,温度为主要限制因子。HIC1和HIC2与同期各气候因子的相关性均不强,HIC1与温度表现为负相关(不显著),而HIC2为正相关(不显著);而与4~8月降水量为极显著正相关,表明该区域对降水的滞后效应较大。在HIIC1区域,在相关分析结果中,NDVI除与Tmax、HC不相关外,与其他各气候因子均为显著正相关(P< 0.05);进一步进行偏相关分析,表明HIIC1地区草地生长主要受降水限制作用较强(p< 0.01),与温度较弱(0.05 <p< 0.1),而对温度的滞后性较强。HIIC2区域的NDVI与P、T 、AT5和D5均为显著正相关(p<0.05),与Tmax为极显著正相关(p<0.01),和Pmax、HC不相关,4~8月降水为该区域草地生长的主要影响因子。
表3 不同区域生长季NDVI均值与气候因子的相关及偏相关系数
Table 3 The correlation coefficients and partial correlation coefficients between average NDVI in growing season and climate factors in different regions
| 相关系数 | 偏相关系数 | |||||||||||||
|---|---|---|---|---|---|---|---|---|---|---|---|---|---|---|
| 不同区域 | P (5~9月) | P (4~8月) | T (5~9月) | T (4~8月) | Pmax | Tmax | AT5 | D5 | HC | P (5~9月) | T (5~9月) | P (4~8月) | T (4~8月) | |
| 高寒草甸 | 0.076 | 0.03 | 0.242 | 0.43* | -0.073 | 0.280 | 0.254 | 0.221 | -0.25 | -0.004 | 0.231 | -0.109 | 0.462** | |
| 高寒草原 | 0.439* | 0.845** | 0.559** | 0.591** | 0.425* | 0.633** | 0.634** | 0.469** | -0.167 | 0.392* | 0.529** | 0.372* | 0.424* | |
| HIB1 | -0.012 | -0.238 | 0.376* | 0.446* | 0.055 | 0.357* | 0.386* | 0.386* | -0.386* | -0.078 | 0.383* | -0.063 | 0.443* | |
| HIC1 | 0.113 | 0.773** | -0.011 | 0.027 | -0.148 | 0.171 | 0.094 | -0.097 | -0.026 | 0.125 | -0.055 | 0.141 | -0.014 | |
| HIC2 | 0.126 | 0.673** | 0.015 | 0.072 | -0.198 | 0.360 | 0.062 | -0.050 | -0.051 | 0.128 | 0.028 | 0.138 | 0.063 | |
| HIIC1 | 0.602** | 0.574** | 0.361* | 0.41* | 0.591** | 0.195 | 0.382* | 0.466** | 0.122 | 0.595** | 0.343 | 0.57** | 0.404* | |
| HIIC2 | 0.362* | 0.726** | 0.398* | 0.384* | 0.320 | -0.598** | 0.410* | 0.422* | -0.046 | 0.447* | 0.475** | 0.443* | 0.379* | |
本研究从区域整体、草地类型和生态分区3个方面分析了NDVI变化与气候之间的关系,研究发现,整个区域草地NDVI变化与降水的相关性大于温度;高寒草甸NDVI变化与降水、温度的相关性均较弱,而高寒草原的则对降水、温度均呈显著正相关,对温度的敏感性更强;从不同生态地理分区来看,在降水较丰沛区域,温度为主要制约因子,而在温度较适宜区域,草地生长季NDVI均值变化与降水呈显著正相关,两者均较适宜区域,则与草地生长季NDVI均值变化的相关性均较显著。
气候变化对陆地植被活动的年际变化具有重要影响。青藏高原地区温度上升速率明显大于中国其他地区,其中部分地区高达0.3~0.5°C/10a,降水也呈增加趋势[29]。本研究得出青藏高原草地气候整体为暖湿化发展趋势,降水和温度的增加速率分别为0.96 mm/a和0.047°C/a,Shi等[30]和周伟等[5]也得出了类似结论。通过对1982~2013年青藏高原草地GIMMS NDVI数据的分析结果表明,高原草地生长季NDVI均值呈增加趋势,这与前人的研究结果基本一致[5,18,31];Zhang等[31]对2000~2009年青藏高原的高寒草地系统研究结果显示,NDVI的增加速率为0.036/a,而本研究的增加速率为0.0003/a,明显偏低,表明21世纪以来高原草地覆盖改善趋势较大,特别是高原的东北部地区,由于降水增加而使20世纪90年代的植被覆盖明显高于80年代[26]。杨元合和朴世龙[19]分析了1982~1999年青藏高原高寒草地的生长季NDVI变化趋势为0.0041/a,高于本研究的结果,其主要原因在于数据处理过程中,本研究采用了4个条件来限制生长季NDVI均值的值域以有效地消除裸地、稀疏植被和常绿林的干扰,而他们的研究只限制了生长季NDVI均值大于0.1,此外,本研究所选时段也明显长于他们的结果。生长季NDVI均值增加的主要因素是生长季提前和生长季生长加速[19]。虽然高原草地整体呈现增加趋势,但是在区域上具有不平衡性,显著增加的主要为高寒草甸,大部分在高原东北部,显著减少则为高寒草原,主要集中在高原西部、东部部分地区。东北部地区气候变暖变湿,促进植被生长,西部地区变暖导致相对变干,草地生产力减少[32]。随着气候变暖,青藏高原地区冻土退化较显著[33],冻土退化导致土壤水分含量、营养元素减少,从而影响植被物种组成及覆盖[34]。因此,东、西部地区,虽然降水量增多,但生长季NDVI减少,冻土退化可能为其主要原因。
通过生长季NDVI均值与降水、温度之间的相关系数可得知,青藏高原高寒草地生长季NDVI均值与降水呈显著正相关,而与温度呈显著负相关[35],高原草地与气候因子相关关系的结论与Zhang等[31]的相似,但程度不一;而张戈丽[21]等研究表明,高原植被年际变化与温度的相关性要高于降水,其研究对象为整个高原植被,而本研究对象为草地,因此与气候变化的相关性有一定的偏差。青藏高原草地分布面积广,气候变化的空间差异也比较大,因此本研究分析了不同生态地理区域内草地生长季NDVI均值与气候因子的关系,结果显示高寒草地东北部 (HIIC1) 地区与降水为极显著正相关,该区域温度和降水均呈上升趋势,与其他区域相比,温度较高,降水一般,因此降水的增加会促进该区域草地生长;HIB1区域大部分为高寒草甸,覆盖度高,降水量多,多年生长季降水均值达484.6 mm,该区降水量较充沛,因此温度为其主要限制气候因子;HIIC2地区温度与HIIC1相似,温度较高,降水与整个草地平均相当,且降水、温度均为上升趋势,降水和温度共同作用该区的草地生长;HIC1区域降水量少,多年生长季均值仅约276 mm,温度上升显著,Zhao等[36]对未来高寒植被分布特征的模拟结果显示,气候的暖干化将会导致植被的退化,并且Zhao等[16]指出降水减少会消弱升温对草原的影响,因此该区域与生长季降水、温度的相关性均不显著,但是该区草地生长对降水的滞后效应显著。草地覆盖变化除了受气候因子的影响外,与人类活动也有着密切的关系。Chen等[32]对1982~2011年青藏高寒草地NPP变化的影响因素表明,前20 a草地NPP增加主要影响因素为气候变化,后10 a则人类活动为主导因素。因此,在研究青藏高原草地覆盖变化的过程中,需引入人类活动影响因素,进一步探讨其驱动机制并更好地理解气候变化对青藏高原草地覆盖的影响。
青藏高原地域辽阔,但是气象观测站点却相对稀少,主要集中在高原的中东部,比如在本研究的HIC2区域,面积为所有分区中的最大,却仅有3个气象站点,且都分布在该区域内的东部,因此,根据气象站点数据来分析整个高原草地或不同生态地理分区草地NDVI变化及其对气候因子的响应可能不够全面。基于青藏高原现有的气象站点,开发适合该地区复杂环境的插值方法至关重要,以期更好地反映气候要素对草地覆盖变化的影响。
基于1982~2013年GIMMS NDVI数据集和站点气象观测数据,分析青藏高原不同草地类型生长季NDVI均值时空变化特征,并根据生态地理区划系统探讨不同分区草地生长与降水和温度的相关关系。主要得出以下结论:
1) 高原尺度上草地生长季NDVI均值呈增加趋势,增加速率为0.000 3/a (p< 0.05),高寒草甸的增加幅度明显高于高寒草原;从空间分布特征来看,高原草地生长季NDVI均值具有明显的空间异质性,总体上表现为东南高西北低的特征。
2) 从高原草地的空间变化趋势来看,整体表现为增加趋势,高原草地东北部、东部、中东部及西南地区生长季NDVI均值增加趋势较显著;高原草地西部、中西部地区表现为草地的退化,且在高原的中东偏北地区呈现为显著的退化趋势。
3) 研究区总体上,高寒草地生长季NDVI均值与降水呈显著正相关,对降水的滞后效应显著。在生态地理区域水平上,降水较多的区域,温度是草地生长的主控因素;温度高而降水较为缺乏地区,降水的增加会促进草地的生长;在温度和降水都较适宜的区域,两者对草地变化影响相近,且对草地生长季NDVI均值具有叠加效应;降水增加速率较大的区域草地生长对其滞后效应较强。
4) 青藏高原中等覆盖草地变化与降水具有较好的相关性,气候的暖干化会抑制草地的生长,从而使得草地覆盖度降低。
The authors have declared that no competing interests exist.
| [1] |
The scientific consensus on climate change [J].https://doi.org/10.1126/science.1103618 URL PMID: 15576594 [本文引用: 1] 摘要
Roland Granqvist's main concern with our study is that it did not include more specific questions about the causes and severity of global warming. In fact, our Eos article presented a snapshot of the full study [Kendall Zimmerman, 2008] in which we did ask about causes of warming, and in which we also explained that the survey was designed to have only a few key questions in order to maximize response. Granqvist also questioned our response rate, but as we explained in the report (with references), our response rate is typical for this type of survey. We actually were thrilled to receive more than 3000 responses, given that scientists are generally very busy. We also did not claim “there are no differences between the scientists.” Our data clearly show some differences, especially across subdisciplines, and we concluded there was “largely” no debate among the scientists most qualified to have an informed opinion on the topic.
|
| [2] |
中国气候与环境演变评估(I):中国气候与环境变化及未来趋势 [J].https://doi.org/10.3969/j.issn.1673-1719.2005.01.002 URL Magsci [本文引用: 1] 摘要
近百年来,全球气候正经历着一次以变暖为主要特征的显著变化,全球气候与环境的重大变化对中国的气候与环境演变也产生了重大影响.来自气候、环境、海洋和经济社会科学等领域的百余位专家和学者对中国气候与环境的演变及其对自然生态系统和社会经济部门的影响进行了评估,在此基础上,提出了适应和减缓气候变化的对策.本文主要阐述在全球气候变化背景下中国气候与环境的演变,并对未来气候变化的趋势做出了预测.
Assessment of climate and environment changes in China(II):climate and environment changes in China and their projection. https://doi.org/10.3969/j.issn.1673-1719.2005.01.002 URL Magsci [本文引用: 1] 摘要
近百年来,全球气候正经历着一次以变暖为主要特征的显著变化,全球气候与环境的重大变化对中国的气候与环境演变也产生了重大影响.来自气候、环境、海洋和经济社会科学等领域的百余位专家和学者对中国气候与环境的演变及其对自然生态系统和社会经济部门的影响进行了评估,在此基础上,提出了适应和减缓气候变化的对策.本文主要阐述在全球气候变化背景下中国气候与环境的演变,并对未来气候变化的趋势做出了预测.
|
| [3] |
|
| [4] |
全球气候变化的驱动机与放大器:Ⅲ.青藏高原隆起对气候变化的影响 [J].
新生代出现的几次重大气候变化事件与青藏高原形成过程中经历的几次强烈构造运动在发生年代上的良好对应关系表明两者存在紧密的联系.或许正是青藏高原的隆起导致了气候的巨大变化和现代东亚季风的形成及加强.高大的高原对大气系统有两个重要影响,热力作用和动力作用.它们在亚洲冬季形成蒙古高压、夏季形成印度低压,从而导致东亚季风出现.青藏高原越高,其对大气的作用越显著,形成的蒙古高压、印度低压和东亚季风越强大.因此,东亚季风的形成和加强是青藏高原隆起的结果.东亚季风的加强和高原动力作用使西风带波动增加,造成冰期极地冷空气不断南侵、气候波动变大.青藏高原抬升和季风造成的化学风化增强还使大气CO2含量降低、气候变冷.因此,青藏高原隆起是控制新生代气候变化的重要因素.
Qinghai-Tibetan plateau:a driver and amplifier of the global climate change:Ⅲ.the effects of the uplift of Qinghai-Tibetan plateau on climatic changes.
新生代出现的几次重大气候变化事件与青藏高原形成过程中经历的几次强烈构造运动在发生年代上的良好对应关系表明两者存在紧密的联系.或许正是青藏高原的隆起导致了气候的巨大变化和现代东亚季风的形成及加强.高大的高原对大气系统有两个重要影响,热力作用和动力作用.它们在亚洲冬季形成蒙古高压、夏季形成印度低压,从而导致东亚季风出现.青藏高原越高,其对大气的作用越显著,形成的蒙古高压、印度低压和东亚季风越强大.因此,东亚季风的形成和加强是青藏高原隆起的结果.东亚季风的加强和高原动力作用使西风带波动增加,造成冰期极地冷空气不断南侵、气候波动变大.青藏高原抬升和季风造成的化学风化增强还使大气CO2含量降低、气候变冷.因此,青藏高原隆起是控制新生代气候变化的重要因素.
|
| [5] |
1982-2010年中国草地覆盖度的时空动态及其对气候变化的响应 [J].https://doi.org/10.11821/dlxb201401002 Magsci [本文引用: 3] 摘要
基于1982-2006 年的GIMMS NDVI 数据和2001-2010 年的MODIS NDVI 数据反演中国草地覆盖度的空间格局和变化趋势,结合1982-2010 年中国气象站点气温和降水数据,分别从不同时空尺度和不同草地类型上分析中国草地覆盖度的年际和月际变化对气候变化的响应。结果表明:(1) 1982-2010 年间中国草地分布区气温呈上升趋势(0.04 ℃/年),降水量呈减少趋势(-0.39 mm/年),西北干旱区气候暖湿化趋势明显。(2) 中国草地覆盖度空间上呈现东南高西北低的特征,29 年间草地覆盖度平均值为34%,坡面草地覆盖度最高为61.4%,荒漠草地覆盖度最低为17.1%。(3) 29 年间中国草地覆盖度总体呈现上升趋势,平均为0.17%/年,西北干旱和青藏高原地区草地覆盖度增加趋势明显。坡面草地覆盖度增加趋势最明显,平均值为0.27%/年,平原草地和草甸增加趋势较小,平均值仅为0.11%/年和0.10%/年。总体上,中国草地覆盖度呈极显著增加(46.03%) 和显著增加的面积比例(11%)大于极显著减少(4.1%)和显著减少的面积比例(3.24%)。(4) 从年际变化上,草地覆盖度与气温和降水量均呈不显著正相关(R = 0.21;R = 0.1);从不同草地类型上,荒漠草地和平原草地覆盖度受降水量影响较大,而高山亚高山草甸、高山亚高山草地、坡面草地和草甸覆盖度与温度相关性较大。(5) 从月际变化上,草地覆盖度与当月气温、降水量具有显著的相关性(R = 0.80;R = 0.76),表明水热因子的季节波动对牧草生长的影响更大;并且所有类型植被覆盖度与前一月气温和降水量的相关系数最大,表现出明显的时滞效应。
Spatial-temporal dynamics of grassland coverage and its response to climate change in China during 1982-2010. https://doi.org/10.11821/dlxb201401002 Magsci [本文引用: 3] 摘要
基于1982-2006 年的GIMMS NDVI 数据和2001-2010 年的MODIS NDVI 数据反演中国草地覆盖度的空间格局和变化趋势,结合1982-2010 年中国气象站点气温和降水数据,分别从不同时空尺度和不同草地类型上分析中国草地覆盖度的年际和月际变化对气候变化的响应。结果表明:(1) 1982-2010 年间中国草地分布区气温呈上升趋势(0.04 ℃/年),降水量呈减少趋势(-0.39 mm/年),西北干旱区气候暖湿化趋势明显。(2) 中国草地覆盖度空间上呈现东南高西北低的特征,29 年间草地覆盖度平均值为34%,坡面草地覆盖度最高为61.4%,荒漠草地覆盖度最低为17.1%。(3) 29 年间中国草地覆盖度总体呈现上升趋势,平均为0.17%/年,西北干旱和青藏高原地区草地覆盖度增加趋势明显。坡面草地覆盖度增加趋势最明显,平均值为0.27%/年,平原草地和草甸增加趋势较小,平均值仅为0.11%/年和0.10%/年。总体上,中国草地覆盖度呈极显著增加(46.03%) 和显著增加的面积比例(11%)大于极显著减少(4.1%)和显著减少的面积比例(3.24%)。(4) 从年际变化上,草地覆盖度与气温和降水量均呈不显著正相关(R = 0.21;R = 0.1);从不同草地类型上,荒漠草地和平原草地覆盖度受降水量影响较大,而高山亚高山草甸、高山亚高山草地、坡面草地和草甸覆盖度与温度相关性较大。(5) 从月际变化上,草地覆盖度与当月气温、降水量具有显著的相关性(R = 0.80;R = 0.76),表明水热因子的季节波动对牧草生长的影响更大;并且所有类型植被覆盖度与前一月气温和降水量的相关系数最大,表现出明显的时滞效应。
|
| [6] |
|
| [7] |
Optical remote sensing of vegetation:modeling,caveats,and algorithms [J].https://doi.org/10.1016/0034-4257(94)00073-V URL [本文引用: 2] 摘要
ABSTRACT The state-of-the-art on radiative transfer modeling in vegetation canopies arul the application of such models to the interpretation and analysis of remotely sensed optical data is summarized. Modeling of top-of-the-atmosphere and top-of-the-canopy radiance field is developed as boundary value problems in radiative transfer. The parameterization of the constituent functions with simple models and/or empirical data is outlined together with numerical solution methods and examples of results of model validation. Caveats in the assignment of signal characteristics to surface properties are itemized and discussed with example results. Algorithms to estimate surface properties from remote observations are classified as spectral vegetation indices, model inversion, expert systems, neural networks, and genetic algorithms. Their applicability is also discussed.
|
| [8] |
Increased plant growth in the northern high latitudes from 1981 to 1991 [J]. |
| [9] |
A large Carbon sink in the woody biomass of northern forests [J]. |
| [10] |
Climate-driven increases in global terrestrial net primary production from 1982 to 1999 [J].https://doi.org/10.1126/science.1082750 URL PMID: 12791990 [本文引用: 1] 摘要
Abstract Recent climatic changes have enhanced plant growth in northern mid-latitudes and high latitudes. However, a comprehensive analysis of the impact of global climatic changes on vegetation productivity has not before been expressed in the context of variable limiting factors to plant growth. We present a global investigation of vegetation responses to climatic changes by analyzing 18 years (1982 to 1999) of both climatic data and satellite observations of vegetation activity. Our results indicate that global changes in climate have eased several critical climatic constraints to plant growth, such that net primary production increased 6% (3.4 petagrams of carbon over 18 years) globally. The largest increase was in tropical ecosystems. Amazon rain forests accounted for 42% of the global increase in net primary production, owing mainly to decreased cloud cover and the resulting increase in solar radiation.
|
| [11] |
Global trends in seasonality of normalized difference vegetation index (NDVI), 1982-2011 [J].https://doi.org/10.3390/rs5104799 Magsci [本文引用: 2] 摘要
A 30-year series of global monthly Normalized Difference Vegetation Index (NDVI) imagery derived from the Global Inventory Modeling and Mapping Studies (GIMMS) NDVI3g archive was analyzed for the presence of trends in changing seasonality. Using the Seasonal Trend Analysis (STA) procedure, over half (56.30%) of land surfaces were found to exhibit significant trends. Almost half (46.10%) of the significant trends belonged to three classes of seasonal trends (or changes). Class 1 consisted of areas that experienced a uniform increase in NDVI throughout the year, and was primarily associated with forested areas, particularly broadleaf forests. Class 2 consisted of areas experiencing an increase in the amplitude of the annual seasonal signal whereby increases in NDVI in the green season were balanced by decreases in the brown season. These areas were found primarily in grassland and shrubland regions. Class 3 was found primarily in the Taiga and Tundra biomes and exhibited increases in the annual summer peak in NDVI. While no single attribution of cause could be determined for each of these classes, it was evident that they are primarily found in natural areas (as opposed to anthropogenic land cover conversions) and that they are consistent with climate-related ameliorations of growing conditions during the study period.
|
| [12] |
Changes in satellite-derived vegetation growth trend in temperate and boreal Eurasia from 1982 to 2006 [J].https://doi.org/10.1111/j.1365-2486.2011.02419.x Magsci [本文引用: 3] 摘要
Monitoring changes in vegetation growth has been the subject of considerable research during the past several decades, because of the important role of vegetation in regulating the terrestrial carbon cycle and the climate system. In this study, we combined datasets of satellite-derived Normalized Difference Vegetation Index (NDVI) and climatic factors to analyze spatio-temporal patterns of changes in vegetation growth and their linkage with changes in temperature and precipitation in temperate and boreal regions of Eurasia (>23.5 degrees N) from 1982 to 2006. At the continental scale, although a statistically significant positive trend of average growing season NDVI is observed (0.5 x 10(-3) year (1), P = 0.03) during the entire study period, there are two distinct periods with opposite trends in growing season NDVI. Growing season NDVI has first significantly increased from 1982 to 1997 (1.8 x 10(-3) year(-1), P < 0.001), and then decreased from 1997 to 2006 (-1.3 x 10(-3) year(-1), P = 0.055). This reversal in the growing season NDVI trends over Eurasia are largely contributed by spring and summer NDVI changes. Both spring and summer NDVI significantly increased from 1982 to 1997 (2.1 x 10(-3) year(-1), P = 0.01; 1.6 x 10(-3) year(-1) P < 0.001, respectively), but then decreased from 1997 to 2006, particularly summer NDVI which may be related to the remarkable decrease in summer precipitation ( 2.7mm yr(-1), P = 0.009). Further spatial analyses supports the idea that the vegetation greening trend in spring and summer that occurred during the earlier study period 1982-1997 was either stalled or reversed during the following study period 1997-2006. But the turning point of vegetation NDVI is found to vary across different regions.
|
| [13] |
Recent change of vegetation growth trend in China [J].https://doi.org/10.1088/1748-9326/6/4/044027 URL [本文引用: 2] 摘要
Using satellite-derived normalized difference vegetation index (NDVI) data, several previous studies have indicated that vegetation growth significantly increased in most areas of China during the period 1982–99. In this letter, we extended the study period to 2010. We found that at the national scale the growing season (April–October) NDVI significantly increased by 0.000702yrfrom 1982 to 2010, but the increasing trend in NDVI over the last decade decreased in comparison to that of the 1982–99 period. The trends in NDVI show significant seasonal and spatial variances. The increasing trend in April and May (AM) NDVI (0.001302yr) is larger than those in June, July and August (JJA) (0.000302yr) and September and October (SO) (0.000802yr). This relatively small increasing trend of JJA NDVI during 1982–2010 compared with that during 1982–99 (0.001202yr) (Piao 2003 024401) implies a change in the JJA vegetation growth trend, which significantly turned from increasing (0.003902yr) to slightly decreasing (0261020.000202yr) in 1988. Regarding the spatial pattern of changes in NDVI, the growing season NDVI increased (over 0.002002yr) from 1982 to 2010 in southern China, while its change was close to zero in northern China, as a result of a significant changing trend reversal that occurred in the 1990s and early 2000s. In northern China, the growing season NDVI significantly increased before the 1990s as a result of warming and enhanced precipitation, but decreased after the 1990s due to drought stress strengthened by warming and reduced precipitation. Our results also show that the responses of vegetation growth to climate change vary across different seasons and ecosystems.
|
| [14] |
Altitude and temperature dependence of change in the spring vegetation green-up date from 1982 to 2006 in the Qinghai-Xizang Plateau [J].https://doi.org/10.1016/j.agrformet.2011.06.016 URL Magsci [本文引用: 1] 摘要
Research in phenology change has been one heated topic of current ecological and climate change study. In this study, we use satellite derived NDVI (Normalized Difference Vegetation Index) data to explore the spatio-temporal changes in the timing of spring vegetation green-up in the Qinghai-Xizang (Tibetan) Plateau from 1982 to 2006 and to characterize their relationship with elevation and temperature using concurrent satellite and climate data sets. At the regional scale, no statistically significant trend of the vegetation green-up date is observed during the whole study period (R-2 = 0.00, P = 0.95). Two distinct periods of green-up changes are identified. From 1982 to 1999, the vegetation green-up significantly advanced by 0.88 days year(-1) (R-2 = 0.56, P < 0.001). In contrast, from 1999 to 2006, a marginal delaying trend is evidenced (R-2 = 0.44. P = 0.07), suggesting that the persistent trend towards earlier vegetation green-up in spring between 1980s and 1990s was stalled during the first decade of this century. This shift in the tendency of the vegetation green-up seems to be related to differing temperature trends between these two periods. Statistical analysis shows that the average onset of vegetation green-up over the Qinghai-Xizang Plateau would advance by about 4.1 days in response to 1 degrees C increase of spring temperature. In addition, results from our analysis indicate that the spatial patterns of the vegetation green-up date and its change since 1982 are altitude dependent. The magnitude of the vegetation green-up advancement during 1982-1999, and of its postponement from 1999 to 2006 significantly increases along an increasing elevation gradient. (C) 2011 Elsevier B.V. All rights reserved.
|
| [15] |
An evaluation of time-series smoothing algorithms for land-cover classifications using MODIS-NDVI multi-temporal data [J].https://doi.org/10.1016/j.rse.2015.12.023 URL [本文引用: 1] 摘要
Abstract In this study we compared the Savitzky-Golay, asymmetric Gaussian, double-logistic, Whittaker smoother, and discrete Fourier transformation smoothing algorithms (noise reduction) applied to Moderate Resolution Imaging Spectroradiometer (MODIS) Normalized Difference Vegetation Index (NDVI) time-series data, to provide continuous phenology data used for land-cover (LC) classifications across the Laurentian Great Lakes Basin (GLB). MODIS 16-day 250. m NDVI imagery for the GLB was used in conjunction with National Land Cover Database (NLCD) from 2001, 2006 and 2011, and the Cropland Data Layers (CDL) from 2011 to 2014 to conduct classification evaluations. Inter-class separability was measured by Jeffries-Matusita (JM) distances between selected cover type pairs (both general classes and specific crops), and intra-class variability was measured by calculating simple Euclidean distance for samples within cover types. For the GLB, we found that the application of a smoothing algorithm significantly reduced image noise compared to the raw data. However, the Jeffries-Matusita (JM) measures for smoothed NDVI temporal profiles resulted in large inconsistencies. Of the five algorithms tested, only the Fourier transformation algorithm and Whittaker smoother improved inter-class separability for corn-soybean class pair and significantly improved overall classification accuracy. When compared to the raw NDVI data as input, the overall classification accuracy from the Fourier transformation and Whittaker smoother improved performance by approximately 2-6% for some years. Conversely, the asymmetric Gaussian and double-logistic smoothing algorithms actually led to degradation of classification performance.
|
| [16] |
Satellite-indicated long-term vegetation changes and their drivers on the Mongolian Plateau [J].https://doi.org/10.1007/s10980-014-0095-y URL [本文引用: 2] 摘要
ABSTRACT The Mongolian Plateau, comprising the nation of Mongolia and the Inner Mongolia Autonomous Region of China, has been influenced by significant climatic changes and intensive human activities. Previous satellite-based analyses have suggested an increasing tendency in the vegetation cover over recent decades. However, several ground-based observations have indicated a decline in vegetation production. This study aimed to explore long-term changes in vegetation greenness and land surface phenology in relation to changes in temperature and precipitation on the Plateau between 1982 and 2011 using the normalized difference vegetation index (NDVI). Across the Plateau, a significantly positive trend in the growing season (May鈥揝eptember) NDVI was observed from 1982 to 1998, but since that time, the NDVI has not shown a persistent increase, thus causing an insignificant trend over the entire study period. For the steppe vegetation (a major vegetation type on the Plateau), the NDVI increased significantly in spring but decreased in summer. Precipitation was the dominant factor related to changes in steppe vegetation. Warming in spring contributed to earlier vegetation green-up only in meadow steppe vegetation, implying that water deficiency in typical and desert steppe vegetation may eliminate the effect of warming. Our results also suggest a combined effect of climatic and non-climatic factors and highlight the need to examine the role of regional human activities in the control of vegetation dynamics.
|
| [17] |
. Evaporative cooling over the Tibetan Plateau induced by vegetation growth [J].https://doi.org/10.1073/pnas.1504418112 URL PMID: 26170316 [本文引用: 2] 摘要
In the Arctic, climate warming enhances vegetation activity by extending the length of the growing season and intensifying maximum rates of productivity. In turn, increased vegetation productivity reduces albedo, which causes a positive feedback on temperature. Over the Tibetan Plateau (TP), regional vegetation greening has also been observed in response to recent warming. Here, we show that in contrast to arctic regions, increased growing season vegetation activity over the TP may have attenuated surface warming. This negative feedback on growing season vegetation temperature is attributed to enhanced evapotranspiration (ET). The extra energy available at the surface, which results from lower albedo, is efficiently dissipated by evaporative cooling. The net effect is a decrease in daily maximum temperature and the diurnal temperature range, which is supported by statistical analyses of in situ observations and by decomposition of the surface energy budget. A daytime cooling effect from increased vegetation activity is also modeled from a set of regional weather research and forecasting (WRF) mesoscale model simulations, but with a magnitude smaller than observed, likely because the WRF model simulates a weaker ET enhancement. Our results suggest that actions to restore native grasslands in degraded areas, roughly one-third of the plateau, will both facilitate a sustainable ecological development in this region and have local climate cobenefits. More accurate simulations of the biophysical coupling between the land surface and the atmosphere are needed to help understand regional climate change over the TP, and possible larger scale feedbacks between climate in the TP and the Asian monsoon system.
|
| [18] |
1982-2009 年青藏高原草地覆盖度时空变化特征 [J].https://doi.org/10.11849/zrzyxb.2010.12.012 Magsci [本文引用: 1] 摘要
利用GIMMS和SPOT VGT两种归一化植被指数(NDVI)数据对青藏高原地区1982—2009年期间草地覆盖的时空变化进行研究,结果如下:①青藏高原草地植被覆盖的年际变化存在着显著的空间差异。趋于升高的区域主要分布在西藏的北部和新疆的南部;趋于下降的地区主要分布在青海的柴达木盆地、祁连山、共和盆地、江河源地区及川西地区。②青藏高原草地覆盖度年际变化趋势分析表明,在90%的显著性检验水平上,降低和增加面积的比率为0.31,草地植被覆盖水平总体趋于升高态势。③以10 a为步长的分析表明:草地盖度呈现持续增加的区域主要分布在西藏北部;阿里地区草地盖度表现为先减少后增加;雅鲁藏布江流域草地盖度呈现先增加而后减少;而持续减少的区域主要分布在青海省以及川西地区,其中青海省分布最广;统计结果显示,高原大部分地区草地盖度具有升高的态势。
Temporal and spatial distribution of grassland coverage change in Tibetan Plateau since 1982. https://doi.org/10.11849/zrzyxb.2010.12.012 Magsci [本文引用: 1] 摘要
利用GIMMS和SPOT VGT两种归一化植被指数(NDVI)数据对青藏高原地区1982—2009年期间草地覆盖的时空变化进行研究,结果如下:①青藏高原草地植被覆盖的年际变化存在着显著的空间差异。趋于升高的区域主要分布在西藏的北部和新疆的南部;趋于下降的地区主要分布在青海的柴达木盆地、祁连山、共和盆地、江河源地区及川西地区。②青藏高原草地覆盖度年际变化趋势分析表明,在90%的显著性检验水平上,降低和增加面积的比率为0.31,草地植被覆盖水平总体趋于升高态势。③以10 a为步长的分析表明:草地盖度呈现持续增加的区域主要分布在西藏北部;阿里地区草地盖度表现为先减少后增加;雅鲁藏布江流域草地盖度呈现先增加而后减少;而持续减少的区域主要分布在青海省以及川西地区,其中青海省分布最广;统计结果显示,高原大部分地区草地盖度具有升高的态势。
|
| [19] |
青藏高原草地植被覆盖变化及其与气候因子的关系 [J].
为揭示气候变化对青藏高原草地生态系统的影响及其生态适应机制,利用1982~1999年间的NOAA/AVHRR <EM>NDVI</EM> 数据和对应的气候资料,研究了近20年来青藏高原草地植被 覆盖 变化及其与气候因子的关系。结果表明,18年来研究区生长季<EM>NDVI</EM>显著增加(<EM>p</EM>=0.015) ,其增加率和增加量分别为0.41% a<SUP>-1</SUP>和0.001 0 a<SUP>-1</SUP>。生长季提前和生长季生长加速是青藏高 原草地植被生长季<EM>NDVI</EM>增加的主要原因。春季为<EM>NDVI</EM>增加率和增加量最大的季节, 其增加率 和增加量分别为0.92% a<SUP>-1</SUP>和0.001 4 a<SUP>-1</SUP>;夏季<EM>NDVI</EM>的增加对生长季<EM>NDVI</EM>增加的贡献相对较小,其增加率和增加量分别为0.37% a<SUP>-1</SUP>和0.001 0 a<SUP>-1</SUP>。3种草地(高寒草甸、高寒草原、温性草原)春季<EM>NDVI</EM>均显著增加(<EM>p</EM><0.01;<EM> p</EM>=0.001;<EM> p</EM>=0.002); 高寒草甸夏季<EM>NDVI</EM>显著增 加(<EM>p</EM>=0.027),而高寒草原和温性草原夏季<EM>NDVI</EM>呈增加趋势,但都不显著(<EM>p</EM>=0. 106; <EM>p</EM>=0 .087);3种草地秋季<EM>NDVI</EM>则没有明显的变化趋势(<EM>p</EM>=0.585; <EM>p</EM>=0.461; <EM>p</EM>=0 .143)。3种草地春季<EM>NDVI</EM>的增加是由春季温度上升所致。高寒草地(高寒草甸和高寒草原)夏季 <EM>NDVI</EM>的增加是夏季温度和春季降水共同作用的结果。温性草原夏季<EM>NDVI</EM>变化与气候因子并没有表现出显著的相关关系。高寒草地植被生长对气候变化的响应存在滞后效应。
Variations in grassland vegetation cover in relation to climatic factors on the Tibetan Plateau.
为揭示气候变化对青藏高原草地生态系统的影响及其生态适应机制,利用1982~1999年间的NOAA/AVHRR <EM>NDVI</EM> 数据和对应的气候资料,研究了近20年来青藏高原草地植被 覆盖 变化及其与气候因子的关系。结果表明,18年来研究区生长季<EM>NDVI</EM>显著增加(<EM>p</EM>=0.015) ,其增加率和增加量分别为0.41% a<SUP>-1</SUP>和0.001 0 a<SUP>-1</SUP>。生长季提前和生长季生长加速是青藏高 原草地植被生长季<EM>NDVI</EM>增加的主要原因。春季为<EM>NDVI</EM>增加率和增加量最大的季节, 其增加率 和增加量分别为0.92% a<SUP>-1</SUP>和0.001 4 a<SUP>-1</SUP>;夏季<EM>NDVI</EM>的增加对生长季<EM>NDVI</EM>增加的贡献相对较小,其增加率和增加量分别为0.37% a<SUP>-1</SUP>和0.001 0 a<SUP>-1</SUP>。3种草地(高寒草甸、高寒草原、温性草原)春季<EM>NDVI</EM>均显著增加(<EM>p</EM><0.01;<EM> p</EM>=0.001;<EM> p</EM>=0.002); 高寒草甸夏季<EM>NDVI</EM>显著增 加(<EM>p</EM>=0.027),而高寒草原和温性草原夏季<EM>NDVI</EM>呈增加趋势,但都不显著(<EM>p</EM>=0. 106; <EM>p</EM>=0 .087);3种草地秋季<EM>NDVI</EM>则没有明显的变化趋势(<EM>p</EM>=0.585; <EM>p</EM>=0.461; <EM>p</EM>=0 .143)。3种草地春季<EM>NDVI</EM>的增加是由春季温度上升所致。高寒草地(高寒草甸和高寒草原)夏季 <EM>NDVI</EM>的增加是夏季温度和春季降水共同作用的结果。温性草原夏季<EM>NDVI</EM>变化与气候因子并没有表现出显著的相关关系。高寒草地植被生长对气候变化的响应存在滞后效应。
|
| [20] |
青藏高原中东部水热条件与NDVI的空间分布格局 [J].Magsci 摘要
<p>青藏高原受大气环流和地势格局的共同作用,水热条件及植被空间分布呈现独特的三维地带性特征。但是青藏高原范围广、地势起伏大,水热条件及植被空间分布具有明显区域差异。本文利用青藏高原中东部100个气象站1982<sup>2</sup>000年的降水、气温资料以及同期NO-AA AVHRR植被指数产品(NDVI),分析水热条件及植被的空间分布特征。首先,设置经向、纬向海拔渐变样带,考察海拔对水热条件及NDVI空间分布的影响;然后,按500米海拔间隔进行站点分组,分析约束了海拔高差后的经纬位置对水热条件及NDVI空间分布的影响。研究表明:在青藏高原中东部由于海拔高差大,热量条件分布首先受海拔递减规律控制,其次才表现出因太阳辐射差异的纬度地带性;而降水分布则主要受水汽通道位置和方向的影响,北上水汽和东部偏南走向山脉是研究区降水经向特征的主要成因;指示植被状况的年均NDVI,则受水热组合的控制,其分布格局是二者的叠加与综合。</p>
Spatial variation of water/thermal elements and NDVI with altitudes in central and eastern Tibetan Plateau. Magsci 摘要
<p>青藏高原受大气环流和地势格局的共同作用,水热条件及植被空间分布呈现独特的三维地带性特征。但是青藏高原范围广、地势起伏大,水热条件及植被空间分布具有明显区域差异。本文利用青藏高原中东部100个气象站1982<sup>2</sup>000年的降水、气温资料以及同期NO-AA AVHRR植被指数产品(NDVI),分析水热条件及植被的空间分布特征。首先,设置经向、纬向海拔渐变样带,考察海拔对水热条件及NDVI空间分布的影响;然后,按500米海拔间隔进行站点分组,分析约束了海拔高差后的经纬位置对水热条件及NDVI空间分布的影响。研究表明:在青藏高原中东部由于海拔高差大,热量条件分布首先受海拔递减规律控制,其次才表现出因太阳辐射差异的纬度地带性;而降水分布则主要受水汽通道位置和方向的影响,北上水汽和东部偏南走向山脉是研究区降水经向特征的主要成因;指示植被状况的年均NDVI,则受水热组合的控制,其分布格局是二者的叠加与综合。</p>
|
| [21] |
基于生态地理分区的青藏高原植被覆被变化及其对气候变化的响应 [J].https://doi.org/10.11821/yj2010110009 URL Magsci [本文引用: 3] 摘要
<p>基于1982~2006年GIMMS NDVI数据集和地面气象台站观测数据,分析了青藏高原整个区域及各生态地理分区年均NDVI的变化趋势,并通过偏相关分析研究不同生态地理分区植被覆被变化对气温和降水响应的空间分异特征。研究表明:(1)近25年来,高原植被覆盖变化整体上趋于改善;高原东北部、东中部以及西南部湿润半湿润及部分半干旱地区植被趋于改善,植被覆盖较差的北部、西部半干旱和干旱地区呈现退化趋势;(2)高原植被变化与气温变化的相关性明显高于与降水变化的相关性,说明高原植被年际变化对温度变化更为敏感;(3)高原植被年际变化与气温和降水的相关性具有明显的区域差异,植被覆盖中等区域全年月NDVI与气温和降水的相关性最强,相关性由草甸向草原、针叶林逐步减弱,荒漠区相关性最弱。生长季植被覆盖变化与气温的相关性和全年相关性较一致,降水则不同,生长季期间高原大部分地区植被变化与降水相关性不显著。</p>
Vegetation change and its responses to climatic variation based on eco-geographical regions of Tibetan Plateau. https://doi.org/10.11821/yj2010110009 URL Magsci [本文引用: 3] 摘要
<p>基于1982~2006年GIMMS NDVI数据集和地面气象台站观测数据,分析了青藏高原整个区域及各生态地理分区年均NDVI的变化趋势,并通过偏相关分析研究不同生态地理分区植被覆被变化对气温和降水响应的空间分异特征。研究表明:(1)近25年来,高原植被覆盖变化整体上趋于改善;高原东北部、东中部以及西南部湿润半湿润及部分半干旱地区植被趋于改善,植被覆盖较差的北部、西部半干旱和干旱地区呈现退化趋势;(2)高原植被变化与气温变化的相关性明显高于与降水变化的相关性,说明高原植被年际变化对温度变化更为敏感;(3)高原植被年际变化与气温和降水的相关性具有明显的区域差异,植被覆盖中等区域全年月NDVI与气温和降水的相关性最强,相关性由草甸向草原、针叶林逐步减弱,荒漠区相关性最弱。生长季植被覆盖变化与气温的相关性和全年相关性较一致,降水则不同,生长季期间高原大部分地区植被变化与降水相关性不显著。</p>
|
| [22] |
论青藏高原范围与面积 [J].https://doi.org/10.3321/j.issn:1000-0585.2002.01.001 URL Magsci [本文引用: 1] 摘要
<p>长期以来 ,种种因素导致学者们对青藏高原确切范围的认识和理解存在差异。根据青藏高原相关领域研究的新成果和多年野外实践 ,从地理学角度 ,充分讨论了确定青藏高原范围和界线的原则与涉及的问题 ,结合信息技术方法对青藏高原范围与界线位置进行了精确的定位和定量分析。得出 :青藏高原在中国境内部分西起帕米尔高原 ,东至横断山脉 ,横跨 31个经度 ,东西长约 2 94 5km ;南自喜马拉雅山脉南缘 ,北迄昆仑山 -祁连山北侧 ,纵贯约 13个纬度 ,南北宽达 15 32km ;范围为 2 6°0 0′12″N~ 39°4 6′5 0″N ,73°18′5 2″E~ 10 4°4 6′5 9″E ,面积为 2 5 72 4× 10 3km2 ,占我国陆地总面积的 2 6 8%。</p>
A discussion on the boundary and area of the Tibetan Plateau in China. https://doi.org/10.3321/j.issn:1000-0585.2002.01.001 URL Magsci [本文引用: 1] 摘要
<p>长期以来 ,种种因素导致学者们对青藏高原确切范围的认识和理解存在差异。根据青藏高原相关领域研究的新成果和多年野外实践 ,从地理学角度 ,充分讨论了确定青藏高原范围和界线的原则与涉及的问题 ,结合信息技术方法对青藏高原范围与界线位置进行了精确的定位和定量分析。得出 :青藏高原在中国境内部分西起帕米尔高原 ,东至横断山脉 ,横跨 31个经度 ,东西长约 2 94 5km ;南自喜马拉雅山脉南缘 ,北迄昆仑山 -祁连山北侧 ,纵贯约 13个纬度 ,南北宽达 15 32km ;范围为 2 6°0 0′12″N~ 39°4 6′5 0″N ,73°18′5 2″E~ 10 4°4 6′5 9″E ,面积为 2 5 72 4× 10 3km2 ,占我国陆地总面积的 2 6 8%。</p>
|
| [23] |
|
| [24] |
An extended AVHRR 8-km NDVI dataset compatible with MODIS and SPOT vegetation NDVI data [J].https://doi.org/10.1080/01431160500168686 URL [本文引用: 1] 摘要
ABSTRACT Daily daytime Advanced Very High Resolution Radiometer (AVHRR) 4‐km global area coverage data have been processed to produce a Normalized Difference Vegetation Index (NDVI) 8‐km equal‐area dataset from July 1981 through December 2004 for all continents except Antarctica. New features of this dataset include bimonthly composites, NOAA‐9 descending node data from August 1994 to January 1995, volcanic stratospheric aerosol correction for 1982–1984 and 1991–1993, NDVI normalization using empirical mode decomposition/reconstruction to minimize varying solar zenith angle effects introduced by orbital drift, inclusion of data from NOAA‐16 for 2000–2003 and NOAA‐17 for 2003–2004, and a similar dynamic range with the MODIS NDVI. Two NDVI compositing intervals have been produced: a bimonthly global dataset and a 10‐day Africa‐only dataset. Post‐processing review corrected the majority of dropped scan lines, navigation errors, data drop outs, edge‐of‐orbit composite discontinuities, and other artefacts in the composite NDVI data. All data are available from the University of Maryland Global Land Cover Facility (http://glcf.umiacs.umd.edu/data/gimms/).
|
| [25] |
Trends in the thermal growing season throughout the Tibetan Plateau during 1960-2009 [J].https://doi.org/10.1016/j.agrformet.2012.07.013 URL Magsci [本文引用: 1] 摘要
Based on daily mean temperature measurements at 54 meteorological stations throughout the Tibetan Plateau (TP) from 1960 to 2009, the trends in the thermal growing season were investigated. The thermal growing season was defined as the period beginning on the last day of the first 6-day period with a daily mean temperature greater than 5 degrees C after the last spring frost (daily mean temperature < 0 degrees C) and ending on the first day of the first 10-day period with a mean temperature of less than 5 degrees C. The results showed that during last 50 years, the regional average growing season length presented a significant increasing trend at the rate of 3.29 days/decade. The majority of this change was attributed to an earlier start of the growing season (-1.82 days/decade). Significant increasing trends in the growing season length were mainly observed in the southern valley as well as the southeastern and northern regions of the TP. During the period of 1980-2009, the regional average growing season indices (i.e., the start, end and length of the growing season) showed significant changes due to increasing air temperatures. The variations in the growing season indices throughout the TP during the last 50 years had been strongly correlated with the elevation. (c) 2012 Elsevier B.V. All rights reserved.
|
| [26] |
Evaporative cooling over the Tibetan Plateau induced by vegetation growth [J].https://doi.org/10.1073/pnas.1504418112 URL PMID: 26170316 [本文引用: 2] 摘要
In the Arctic, climate warming enhances vegetation activity by extending the length of the growing season and intensifying maximum rates of productivity. In turn, increased vegetation productivity reduces albedo, which causes a positive feedback on temperature. Over the Tibetan Plateau (TP), regional vegetation greening has also been observed in response to recent warming. Here, we show that in contrast to arctic regions, increased growing season vegetation activity over the TP may have attenuated surface warming. This negative feedback on growing season vegetation temperature is attributed to enhanced evapotranspiration (ET). The extra energy available at the surface, which results from lower albedo, is efficiently dissipated by evaporative cooling. The net effect is a decrease in daily maximum temperature and the diurnal temperature range, which is supported by statistical analyses of in situ observations and by decomposition of the surface energy budget. A daytime cooling effect from increased vegetation activity is also modeled from a set of regional weather research and forecasting (WRF) mesoscale model simulations, but with a magnitude smaller than observed, likely because the WRF model simulates a weaker ET enhancement. Our results suggest that actions to restore native grasslands in degraded areas, roughly one-third of the plateau, will both facilitate a sustainable ecological development in this region and have local climate cobenefits. More accurate simulations of the biophysical coupling between the land surface and the atmosphere are needed to help understand regional climate change over the TP, and possible larger scale feedbacks between climate in the TP and the Asian monsoon system.
|
| [27] |
|
| [28] |
多种类植被覆盖地区ASTER影像岩石、土壤信息提取方法研究 [J].https://doi.org/10.3321/j.issn:1006-3021.2007.01.013 URL [本文引用: 1] 摘要
植被的发育限制了遥感在地质学方面的应用,特别是在多种类植被发育地区不能直接地根据波谱特征进行岩石与矿物方面的填图。利用线性波谱分离等技术方法可以从植被、基岩或土壤混合信息中区分出多类别植被波谱,从像元混合光谱中减去各植被类型所占的像元光谱强度,从而可以求出土壤光谱强度及其所占的份额,有效剥离出岩石和土壤信息。在试验区利用多种类植被干扰消除方法,进行遥感蚀变矿物和岩石填图,具有极大的可靠性。该技术可以在中等植被发育地区的遥感填图中得以推广和应用。
The ASTER imaging rock and Soil information extraction method in multiple vegetations covered areas. https://doi.org/10.3321/j.issn:1006-3021.2007.01.013 URL [本文引用: 1] 摘要
植被的发育限制了遥感在地质学方面的应用,特别是在多种类植被发育地区不能直接地根据波谱特征进行岩石与矿物方面的填图。利用线性波谱分离等技术方法可以从植被、基岩或土壤混合信息中区分出多类别植被波谱,从像元混合光谱中减去各植被类型所占的像元光谱强度,从而可以求出土壤光谱强度及其所占的份额,有效剥离出岩石和土壤信息。在试验区利用多种类植被干扰消除方法,进行遥感蚀变矿物和岩石填图,具有极大的可靠性。该技术可以在中等植被发育地区的遥感填图中得以推广和应用。
|
| [29] |
|
| [30] |
Recent and future climate change in northwest China [J].https://doi.org/10.1007/s10584-006-9121-7 URL [本文引用: 1] 摘要
As a consequence of global warming and an enhanced water cycle, the climate changed in northwest China, most notably in the Xinjiang area in the year 1987. Precipitation, glacial melt water and river runoff and air temperature increased continuously during the last decades, as did also the water level of inland lakes and the frequency of flood disasters. As a result, the vegetation cover is improved, number of days with sand-dust storms reduced. From the end of the 19th century to the 1970s, the climate was warm and dry, and then changed to warm and wet. The effects on northwest China can be classified into three classes by using the relation between precipitation and evaporation increase. If precipitation increases more than evaporation, runoff increases and lake water levels rise. We identify regions with: (1) notable change, (2) slight change and (3) no change. The future climate for doubled CO 2 concentration is simulated in a nested approach with the regional climate model-RegCM2. The annual temperature will increase by 2.7 ^ C and annual precipitation by 25%. The cooling effect of aerosols and natural factors will reduce this increase to 2.0 ^C and 19% of precipitation. As a consequence, annual runoff may increase by more than 10%.
|
| [31] |
Vegetation greenness trend(2000 to 2009)and the climate controls in the Qinghai-Tibetan Plateau [J].https://doi.org/10.1117/1.JRS.7.073572 URL [本文引用: 3] 摘要
The Qinghai-Tibetan Plateau has been experiencing a distinct warming trend, and climate warming has a direct and quick impact on the alpine grassland ecosystem. We detected the greenness trend of the grasslands in the plateau using Moderate Resolution Imaging Spectroradiometer data from 2000 to 2009. Weather station data were used to explore the climatic drivers for vegetation greenness variations. The results demonstrated that the region-wide averaged normalized difference vegetation index (NDVI) increased at a rate of 0.036 yr. Approximately 20% of the vegetation areas, which were primarily located in the northeastern plateau, exhibited significant NDVI increase trend (p-value <0.05). Only 4% of the vegetated area showed significant decrease trends, which were mostly in the central and southwestern plateau. A strong positive relationship between NDVI and precipitation, especially in the northeastern plateau, suggested that precipitation was a favorable factor for the grassland NDVI. Negative correlations between NDVI and temperature, especially in the southern plateau, indicated that higher temperature adversely affected the grassland growth. Although a warming climate was expected to be beneficial to the vegetation growth in cold regions, the grasslands in the central and southwestern plateau showed a decrease in trends influenced by increased temperature coupled with decreased precipitation.
|
| [32] |
The impact of climate change and anthropogenic activities on alpine grassland over the Qinghai-Tibet Plateau [J]. |
| [33] |
Simulation of the decadal permafrost distribution on the Qinghai-Tibet Plateau (China) over the past 50 years [J].https://doi.org/10.1002/ppp.1758 URL [本文引用: 1] 摘要
ABSTRACT Decadal changes in permafrost distribution on the Qinghai-Tibet Plateau (QTP) over the past 50 years (1960–2009) were simulated with a response model that uses data from a digital elevation model, mean annual air temperature (MAAT) and the vertical lapse rate of temperature. Compared with published maps of permafrost distribution, the accuracy of the simulated results is about 85 per cent. The simulation results show: (1) with the continuously rising MAAT over the past 50 years, the simulated areas of permafrost on the QTP have continuously decreased; (2) through areal statistics, the simulated areas of permafrost were 1.60 00 10 6 km 2 , 1.49 00 10 6 km 2 , 1.45 00 10 6 km 2 , 1.36 00 10 6 km 2 and 1.27 00 10 6 km 2 , respectively, in the 1960s, 1970s, 1980s, 1990s and 2000s; and (3) the rate of permafrost loss has accelerated since the 1980s, and the total area of degraded permafrost is about 3.3 00 10 5 km 2 , which accounts for about one-fifth of the total area of permafrost in the 1960s.
|
| [34] |
Responses of alpine grassland on Qinghai-Tibetan plateau to climate warming and permafrost degradation: a modeling perspective [J].https://doi.org/10.1088/1748-9326/9/7/074014 URL [本文引用: 1] 摘要
Permafrost plays a critical role in soil hydrology. Thus, the degradation of permafrost under warming climate conditions may affect the alpine grassland ecosystem on the Qinghai-Tibetan Plateau. Previous space-for-time studies using plot and basin scales have reached contradictory conclusions. In this study, we applied a process-based ecosystem model (DOS-TEM) with a state-of-the-art permafrost hydrology scheme to examine this issue. Our results showed that 1) the DOS-TEM model could properly simulate the responses of soil thermal and hydrological dynamics and of ecosystem dynamics to climate warming and spatial differences in precipitation; 2) the simulated results were consistent with plot-scale studies showing that warming caused an increase in maximum unfrozen thickness, a reduction in vegetation and soil carbon pools as a whole, and decreases in soil water content, net primary production, and heterotrophic respiration; and 3) the simulated results were also consistent with basin-scale studies showing that the ecosystem responses to warming were different in regions with different combinations of water and energy constraints. Permafrost prevents water from draining into water reservoirs. However, the degradation of permafrost in response to warming is a long-term process that also enhances evapotranspiration. Thus, the degradation of the alpine grassland ecosystem on the Qinghai-Tibetan Plateau (releasing carbon) cannot be mainly attributed to the disappearing waterproofing function of permafrost.
|
| [35] |
The response of vegetation dynamics of the different alpine grassland types to temperature and precipitation on the Tibetan Plateau [J]. |
| [36] |
Vegetation distribution on Tibetan Plateau under climate change scenario [J].https://doi.org/10.1007/s10113-011-0228-7 URL [本文引用: 1] 摘要
The impact of climate change on distribution of vegetation is an important aspect in studies on the responses of ecosystems to the climate change. Particularly in the sensitive environments of the Tibetan Plateau, vegetation distribution may be significantly affected by climate change. In this research, the coupled biogeography and biogeochemistry model, BIOME4, was modified according to the features of vegetation distribution on the Plateau, and the Kappa statistic was used to evaluate the modeling results by comparing the simulated vegetation distribution with the existing 1:1,000,000 vegetation map of China. The comparison showed that modified model was appropriate for simulating the overall vegetation distribution on the Plateau. With the improved BIOME4 model, possible changes in the vegetation distribution were simulated under climate change scenarios. The simulated results suggest that alpine meadows, steppes, and alpine sparse/cushion vegetation and deserts would shrink, while shrubs, broad-leaved forests, coniferous-broad-leaved mixed forests, and coniferous forests would expand. Among these types, shrubs, alpine meadows, and steppes would change the most. The shrubs vegetation would expand toward the northwest, replacing most alpine meadows and part of steppes, and thus causing their shrinkages. Yet broad-leaved forests and coniferous-broad-leaved mixed forests demonstrated smaller changes in their distributions. For all the forest types, the area of coniferous forests would increase the most by spreading to the interior of the Plateau.
|

/
| 〈 |
|
〉 |

