钟章奇 , 吴乐英
, 吴乐英
Zhong Zhangqi, Wu Leying
中图分类号: F119
文献标识码: A
文章编号: 1000-0690(2017)05-0773-10
通讯作者:
收稿日期: 2016-07-25
修回日期: 2016-09-11
网络出版日期: 2017-05-25
版权声明: 2017 《地理科学》编辑部 本文是开放获取期刊文献,在以下情况下可以自由使用:学术研究、学术交流、科研教学等,但不允许用于商业目的.
基金资助:
作者简介:
作者简介:钟章奇(1985-),男,湖南岳阳人,讲师,博士,主要研究方向为区域科学与管理、经济政策模拟。E-mail: zzqi111@163.com
展开
摘要
通过耦合投入产出分析方法和结构分解模型,探讨2002~2010年区域碳排放转移的演变特征、驱动因素及其地理源特征。研究发现:2002~2010年流出和流入河南省的贸易隐含碳排放均处于不断增加的趋势,其中流出贸易隐含碳排放主要是受外部最终需求的影响,且主要集中在中国的中部和东南部地区,而流入贸易隐含碳排放则主要是受本地最终需求和本地最终产品结构的影响最为显著,且主要来源于中国的东部、东北部和中部地区。研究还发现,为减轻贸易对区域碳排放及其减排责任的影响,开展区域合作来共同减排比单个地区独自应对更为有利,但在区域合作中各地区的获益程度可能会有所差别。
关键词:
Abstract
Carbon emission embodied in trade plays an important role in reducing regional obligations towards carbon emission reduction in regional climate policy. Based on a multi-regional input-output analysis and structural decomposition method, this article analyzes the changes and geographic sources of the emissions embodied in trade in Henan Province, and examines how and why the EET changed in Henan Province in 2002-2010. Moreover, in policy terms, regional climate policy options that potentially reduce the impact of trade on individual region like Henan Province are also discussed. One finding from this study is that with the significantly increasing of the emissions embodied in exports and emissions embodied in imports in Henan Province in 2002-2010 in China, for Henan Province, the trend in terms of the geographic separation of consumers and the pollution emitted during the production of consumable items is increasing significantly. Furthermore, in terms of the driving forces onthe embodied emissions changes, emissions embodied in exports is affected most by demand in the other regions of China and production in the local region, while emissions embodied in imports is largely determined by demand in the local region and production in the other regions of China. In addition, for Henan’s emissions embodied in exports, their geographic sources are be mainly located in the central part of China and the southeastern China, whereas the geographic sources of the Henan’s emissions embodied in imports are primarily concentrated in the east of China, northeastern China and the central part of China. Another important finding is that if regions like Henan Province take binding commitments as a part of a coalition, instead of as individual regions, then the impacts of trade can be reduced. Notably, however, the extent of reduction in a coalition varies in different regions. Therefore, it is necessary that those regions that benefit most should provide financial and technological aid to those regions that suffer most or benefit least in climate policy.
Keywords:
2015年,中国政府在《中美气候变化联合声明》中郑重表明,将在2030年达到碳高峰。为了完成这一目标,就需要将碳减排责任分解和落实到各个区域。然而在区域经济一体化的过程中,贸易促使区域间资本和劳动力等资源的再分配,在推动区域经济发展的同时[1,2],商品的生产者和消费者也会因贸易而出现地域的分离,导致碳排放的区域转移[3,4],使本地区的部分减排责任可能被转嫁给其他区域[5,6]。为此碳排放核算方法从生产责任制到消费责任制的转变逐渐受到重视,并且基于贸易隐含碳划分减排责任的区域减排政策得到众多学者的广泛认同[3,7,8]。对中国来说,由于受区域经济发展水平、技术条件和能源结构差异等因素影响,各地区的碳排放量状况不仅存在显著差异[9,10],同时还受到贸易隐含碳的影响[11,12]。因而在此背景下,探讨区域碳排放转移(贸易隐含碳排放)及其相关问题不仅有利于深入认识贸易对区域碳排放的影响,同时也对科学地分配减排责任并制定具有针对性的减排对策具有重要作用。
当前研究中,针对区域贸易隐含碳排放的核算方法主要是基于生命周期法和投入产出方法[13,14]。由于投入产出分析不仅能体现区域间贸易联系和反映不同部门间的关系,还能够区分来自不同区域的调入产品生产技术的差异性,从而可以显著提高贸易隐含碳排放的计算精度,因此多被用于探讨区域贸易隐含碳排放[7]。为此,基于投入产出建模方法,学者主要开展了以下两个方面的研究。第一,探讨某一年或者一段时期内国家的贸易隐含碳排放变化及其对本地碳排放的影响等[3,4,7,15~18]。第二,主要关注某一年国家内各地区或者某一个城市的贸易隐含碳排放及其对本地碳排放的影响[6,11,19~24]。
总体来看,基于投入产出建模方法,以往的研究侧重于计算不同国家或者地区的贸易隐含碳排放以及分析其对本地区碳排放的影响,为合理地分配各地区的减排责任以及认识区域贸易隐含碳排放在气候治理中的作用具有重要意义,然而其仍然在以下3个方面较少涉及:① 单一的投入产出建模研究方法使得鲜有研究对区域贸易隐含碳排放变化的驱动因素开展相关分析。而事实上,厘清碳排放驱动因素对于制定有针对性区域环境政策具有重要意义[25,26]。② 涉及区域贸易隐含碳排放的地理源问题还较少关注,也就是区域因流入贸易而产生的流入碳排放是来自哪里,同时区域因流出贸易而产生的流出碳排放去了哪里。在区域气候政策中,为实现区域的减排目标,需要明确区域碳排放的主要来源[27],因此追溯其贸易隐含碳排放的地理源,能为制定有针对性的碳减排政策提供重要参考。③ 在区域贸易联系日益紧密的现实背景下,为减轻贸易对区域碳排放乃至减排责任划分的影响,区域该如何应对。
鉴于此,通过耦合投入产出模型和结构分解模型,本文拟以河南省为例重点探讨以下3个重大问题,以期在研究方法上进一步丰富区域贸易隐含碳排放的建模理论,在研究内容与政策上也为相关利益主体深入认识区域贸易对本地碳排放的影响以及制定更具有针对性的区域减排策略提供重要理论依据。具体来看:① 2002~2010年河南省贸易隐含碳排放是怎样演变地以及何种因素驱动了这种变化。② 流入河南省的贸易隐含碳排放主要来自哪里以及流出河南省的贸易隐含碳排放又去了哪里。③ 在区域减排政策上,河南省应该如何应对才能减轻贸易对本地碳排放及其减排责任划分的影响。
近年来,随着区域经济的迅速发展,河南省对外部能源需求迅速增长以及由此产生的碳排放也显著增加。王铮等[28]研究表明,在1995~2006年河南省人均碳排放量平均增长率和碳排放总量平均增长率分别为8.4%和9.1%。而相关统计数据表明,河南省能源消费总量从2002年的72.4×10⁶t标煤增长到2010年的238.1×10⁶t标煤,年均增长率为28.6%[29]。此外,更为严重的是,其能源消费量对外依赖非常严重,统计数据计算表明其折合成标煤后需要从中国其他地区调入的能源需求量占其总需求量的比例从2002年的30.5%增长到2010年的50.1%,年均增长率约为2.4%[29]。王铮等[30]还研究发现未来一段时间(约到2034年)河南省的能源需求量及其产生的碳排放还会持续增加。为此,在区域经济快速发展的背景下,其减排形势十分严峻。因此,探讨河南省的贸易隐含碳排放及其相关问题具有重要意义。
需要注意的是本文中河南省的贸易隐含碳排放并不包含其国际贸易中进出口贸易隐含碳排放,而之所以这样处理主要是由于:① 研究表明,国内贸易对河南省碳排放的影响远远大于国际贸易这一事实[11,21];② 对河南省而言,其各部门进出口来自其他国家或者地区可能有近百个,一一根据相应地区域间投入产出表来确定其各部门的单位产出碳排放强度值难度很大,显然这也是不现实的。为此,根据多区域投入产出分析方法可知,河南省
其中,
河南省(
本文将各个因素区别为本地和区域外两种,而影响因素则包括碳排放强度、中间投入结构、生产技术、最终产品贸易结构、最终需求。对于河南省(r)而言:
其中,
表1 驱动河南贸易隐含碳排放演变的因素
Table 1 Description of decomposition components of carbon emissions embodied in trade in Henan Province
| 因素 | 含义 | ||
|---|---|---|---|
| 河南省的碳排放强度 | |||
| 除河南省外的中国其他省区的碳排放强度 | |||
| 河南省的中间投入结构 | |||
| 除河南省外的中国其他省区的中间投入结构 | |||
| 河南省的生产技术 | |||
| 除河南省外的中国其他省区的生产技术 | |||
| 河南省的最终消费贸易结构 | |||
| 除河南省外的中国其他省区的最终消费贸易结构 | |||
| 河南省的最终消费需求 | |||
| 除河南省外的中国其他省区的最终消费需求 | |||
为此,就可将驱动贸易隐含碳排放演变的因素进行分解。详细各因素如表1所示,表示为:
(6)
式中,
式中,
本研究所需的基础数据是中国多区域间投入产出表。由于当前能够获取的最新中国多区域间投入产出表数据只能是2002、2007和2010年,为此,本研究也仅针对2002~2010年河南省的贸易隐含碳排放及其相关问题开展探讨。其中需要说明的是:2002年多区域间投入产出表为王铮课题组编制,其已经被应用于探讨中国区域产业结构演变[34]。而2007和2010年多区域间投入产出表则来自刘卫东课题组的相关研究[35,36],且均已被广泛应用[20,21,35~38]。此外,为消除通货膨胀因素的影响,本文以2002年价格为基准,对2007和2010年数据进行校准,以满足研究需要。
另外,对于区域各部门的单位产值碳排放,由于缺乏相关直接数据,本文采用如下方式进行计算:分别根据2003,2008和2011年统计年鉴数据库[29]可得到2002、2007和2010年区域分行业一次能源(包括煤、石油、天然气)的最终使用数据。同时基于2006年IPCC提供的化石能源碳排放因子[39],可计算各省区的分行业碳排放量数据,再除以各省区各部门总产出,即可得到各省区各部门单位产值碳排放。
最后需要指出的是,区域间投入产出表的产业分类为30部门,而能源平衡表中的产业分类为6部门。为了使二者的部门能相互对应,在当前研究中存在两种方法,即将投入产出表按照能源表合并或能源表按照投入产出表进行拆分。对此,不同学者的观点不尽一致,如Machado[40]认为应采用前者,而Lenzen等[41]则提倡采用后者。而研究表明这两种方法各有优缺点,前一种方法在保证投入产出表完备性方面具有优势,而后一种方法则能避免加入额外的能源消费导致的潜在误差[42]。结合现有数据,本文依据能源平衡表将研究区域的产业分为6部门,代码1、2、3、4、5、6分别对应农林牧渔业、工业、建筑业、交通运输业、批发零售餐饮业、其他服务业各部门,并对2002、2007和2010年区域间投入产出表中的部门做相应的合并处理。
基于上述模型与数据,本文首先计算了河南省分部门的贸易隐含碳排放变化情况(表2)。从流出贸易隐含碳排放来看,除农业部门外,2002~2010年河南省其他部门流出的贸易隐含碳排放均呈现出不同程度的升高,而从流入的贸易隐含碳排放来看,除交通运输业部门外,2002~2010年流入河南省其他部门的贸易隐含碳排放均表现出增加趋势。工业、建筑业和其他服务业这3个部门的流入和流出贸易隐含碳排放均呈现迅速增长,而进一步的计算显示,2002~2010年这3个部门流出和流入的贸易隐含碳排放占河南省总流出和流入量的比例均维持在90%以上,这就表明当前造成河南省贸易隐含碳排放迅速增加的主要原因是由工业、建筑业和其他服务业所致。而根据Zhong等[21]的研究表明,在基于生产责任制核算区域碳排放方式下,由于流出贸易隐含碳会算入该部门所产生的总碳排放之中,因此河南省这3个部门可能需要承担相对更多的减排责任。同时为减轻贸易对河南省碳排放及其减排责任的影响,可能也需重点关注这3个部门。
总体来看,2002~2010年河南省各个部门流出和流入的贸易隐含碳排放均呈现上升趋势,这就不可避免地推动了整个河南省贸易隐含碳排放的增加。而进一步来看,这不仅显示出当前商品的生产地和消费地分离趋势愈发显著,同时也表明了贸易正在加剧碳排放的区域转移。
表2 2002~2010年河南省分部门贸易隐含碳的变化(×106t)
Table 2 Carbon emissions embodied in trade of dirrerent departments in Henan Province in 2002-2010 (×106t)
| 1 | 2 | 3 | 4 | 5 | 6 | 汇总 | |
|---|---|---|---|---|---|---|---|
| 年份 | EEE(EEI) | EEE(EEI) | EEE(EEI) | EEE(EEI) | EEE(EEI) | EEE(EEI) | EEE(EEI) |
| 2002 | 2.8(1.9) | 38.9(37.4) | 15.3(4.1) | 1.13(1.7) | 1.82(0.6) | 7.0(3.9) | 67.0(49.7) |
| 2007 | 5.2(3.8) | 85.2(85.0) | 46.7(13.4) | 1.84(1.3) | 3.56(1.5) | 14.6(12.6) | 157.1(117.6) |
| 2010 | 4.8(4.4) | 121.1(141.8) | 49.3(15.1) | 2.06(1.0) | 4.36(2.1) | 15.3(14.5) | 197.0(178.8) |
表3 河南省的流出贸易隐含碳因素分解(%)
Table 3 Structural decomposition of EEE for the Henan Province (2002-2010) (%)
| 134.4 | 12.2 | 1.2 | 32.0 | 0.7 | -38.8 | 9.2 | 25.1 | 0.9 | 0.6 | 83.2 | |
| 25.4 | -15.9 | -1.5 | -12.4 | -0.6 | -2.3 | 4.3 | 6.8 | 0.3 | 0.6 | 58.4 | |
| 194.0 | -5.6 | -0.4 | 14.6 | 0.3 | -41.5 | 12.5 | 38.5 | 1.2 | 1.4 | 190.9 |
表4 河南省的流入贸易隐含碳因素分解(%)
Table 4 Structural decomposition of EEI for Henan Province (2002-2010) (%)
| 136.7 | 0.1 | 17.5 | 2.7 | 4.5 | -26.6 | 4.7 | 21.5 | 0.1 | 89.1 | 6.1 | |
| 52.0 | -0.2 | -18.8 | -3.7 | 1.2 | -1.3 | 2.8 | 8.0 | 0.1 | 67.5 | 4.9 | |
| 259.9 | -0.1 | -5.6 | 0.1 | 5.9 | -28.1 | 6.2 | 32.7 | 0.2 | 215.9 | 12.3 |
其次,本文分解了河南省
对于河南省流入贸易隐含碳而言(表4),影响最大的因素为本地的最终消费需求和本地的最终产品贸易结构。而区域外的最终产品贸易结构对
如表4所示,本地的生产技术变化会使得河南省
总体来看,对于河南省而言,其
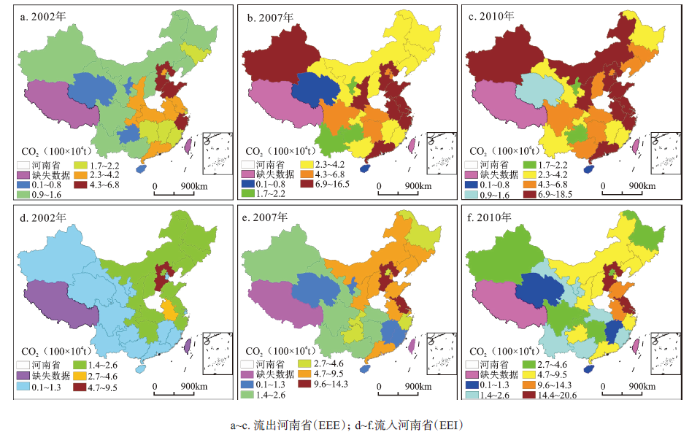
图1a~c显示,2002年流出河南省的贸易隐含碳排放主要集中在中国的中部和东南部地区。而随着区域经济的迅速发展,除新疆和内蒙古地区也逐渐成为河南省流出贸易隐含碳排放的地区外,整体而言,与2002年相比,2007与2010年流出河南省贸易隐含碳排放的总体区域格局并未发生本质变化。具体来看,2002河南省贸易隐含碳排放的流出地主要是河北、浙江、山东、江苏和湖北等地。这表明与其他地区相比,这些地区的碳排放受河南省贸易隐含碳的影响可能相对更大。
图1d~f显示,2002~2010年流入河南省的贸易隐含碳排放总体格局并未出现显著变化,均是集中于中国的东部、东北部和中部地区,且具有显著的地理邻近效应,也就是说流入河南省的贸易隐含碳排放是来自其周边地区。2002年流入河南省的贸易隐含碳排放的省区主要是河北、安徽、湖北、山东和山西等地。这说明在区域经济一体化过程中,河南省在与这些地区发生贸易的过程中,固然给河南省带来了资本和能源等资源,但其流入的贸易隐含碳对河南省碳排放及其减排责任也带来了不利影响,因此提高这些地区的能源利用效率以及加大其节能生产技术水平投入等以减低其贸易中的含碳量可能在一定程度上有利于缓解贸易隐含碳对河南省产生的负面影响。
图1 2002~2010年流出和流入河南省的贸易隐含碳排放的地理源
Fig.1 Geographic sources of EEE and EEI of Henan Province in 2002-2010
探讨河南省贸易隐含碳的演变及其驱动因素,深入认识区域贸易隐含碳的变化特征及其影响因素,进一步通过分析其贸易隐含碳排放的地理源,为厘清区域减排责任提供依据,也给相关利益主体制定更具有针对性的减排政策奠定基础。然而,在区域气候政策中,如何减轻贸易隐含碳对其减排责任的影响,对于决策者而言,这可能更具有政策意义。对此,Cendra[43]认为可将贸易保护的问题引入来讨论区域贸易隐含碳减排政策。而这实际上也就是为区域设置贸易保护如征收边界碳税提供借口[8]。但对于各个国家而言,可能产生国家间贸易壁垒甚至引发贸易摩擦;而对国家内的不同区域来说,这会不利于其区域间经济协调发展并可能引发区域间经济发展的不平衡。为此,Peters 等[44]认为某一区域可通过产业转移从而将高耗能、高污染产品的生产转移到其他区域从而来减轻本地区的减排责任。显然,对于不同国家主体或者区域来说,这不仅可能对本地经济发展带来负面影响,同时也可能会导致整体减排目标实现遥遥无期。鉴于此,区域应该如何应对才能减轻贸易对本地碳排放及其减排责任划分的影响,尤其是对于河南这样的中部经济大省而言,一方面其作为资源性省区,为推动其他区域经济发展调出了大量的产品,另一方面其作为处于经济高速增长的地区,正不断地从其他区域调入众多商品资源。
目前在这个角度上鲜有文献开展相关研究。针对不同国家主体如何应对才能减轻国际贸易隐含碳对其减排政策的影响研究却早已引起了学者的关注。如Victor等[15]以及Peters等[44]就指出不同国家在气候政策上开展减排合作能一定程度上减轻贸易对单个国家减排责任划分的影响。也就是说,面对全球的减排目标以及基于国际贸易隐含碳的国家减排责任划分方案,不同国家主体通过区域合作来共同承担减排责任可能一定程度能降低贸易对不同国家减排责任划分的影响。那么针对中国这样一个幅员辽阔,区域经济发展水平差异显著的国家来说,面对中央政府约束性减排目标以及基于贸易隐含碳的区域减排政策,为减轻贸易对减排责任划分的影响,河南省能否通过开展区域合作来进行应对,同时在开展区域碳减排合作中,其会对合作团体中区域带来怎样的影响,这将是本文需要关注的。
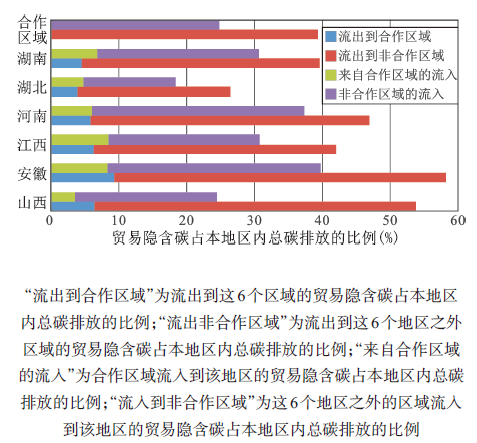
本文选择以中部六省(河南、山西、湖北、安徽、湖南和江西)来开展上述分析,其结果被给出在图2中,而这6个地区中贸易隐含碳排放数据来源于Wu等①(① Wu L, Zhong Z, Wang Z et al. Changes and structure decomposition analysis of carbon emissions embodied in provincial trade of China from 2002 to 2010.)的研究。之所以选择这6个区域主要是基于以下两点:① 根据Peters等[44]以及Zhong等[21]研究发现贸易隐含碳净流出地区具有较为一致的利益诉求,因而在区域减排合作中更具可能性。而相关研究表明2007和2010年这6个地区的贸易隐含碳均为净流出[21]①。② 这6个地区在地理空间上具有邻近性,是中国人口主要集聚地、经济腹地和重要市场,在中国地域分工中扮演着重要角色。
图2 各地区在开展区域合作前后来自本地区和其他地区的贸易隐含碳排放情况
Fig. 2 Carbon emissions embodied in exports and imports before and after regional cooperation of each region
图2所示,与单个省区独自应对相比,在开展区域合作减排后(也就是图中对应的中部六省),除流入湖北省和山西省的贸易隐含碳排放呈现小幅上升外,其余省份的流出和流入贸易隐含碳排放均呈现不同程度的下降。事实上,Peters等[44]认为如果区域流入和流出的贸易隐含碳排放占该地区总碳排放量的比例呈现下降,这一定程度上说明其贸易隐含碳排放对其减排责任的影响就会相应的降低。这也就表明在单个省区独自在应对基于贸易隐含碳的减排责任划分时,区域间贸易对减排责任的影响更大。因而开展区域合作减排,可能会一定程度上减轻贸易隐含碳排放的影响。具体到区域来看,如以河南省为例,调入与调出河南省的贸易隐含碳占当年河南省总排放量的比例分别是37.4%和47.0%,而当开展区域合作后,调入与调出整个中部地区的贸易隐含碳占当年该地区总排放量的比例分别则是24.8%和39.3%,因而对于河南省来说,其调入与调出的比例分别下降了12.6%和7.7%。此外在开展区域合作后,安徽受益最大,其调入与调出的比例能分别下降14.9%和18.9%。湖南受益最小,其调入与调出的比例能分别下降了5.9%和0.3%。这说明开展区域合作可以一定程度上减轻贸易对于各省区减排责任划分的影响,只不过这种受益程度各地区会有所差别。然而需要注意的是,对于湖北来说,开展区域合作后则给其带来了一定的负面影响,主要表现在调入湖北省的贸易隐含碳的比例增加了约6.4%,同时调出的增加了约12.8%。因此对于湖北等地来说,其受益程度可能并不明显,在参与区域合作中可能就会显得不够积极。对此,在区域合作内部可能还需要各地区通过开展资金与技术的支持以弥补形成区域合作团体给少部分省区带来的不利影响。
以河南省为例,通过耦合投入产出分析方法和结构分解模型研究了2002~2010年区域贸易隐含碳排放演变特征及其驱动因素,并深入探讨了其贸易隐含碳排放的地理源特征。最后本文还进一步就区域应该如何应对才能有效减轻贸易对其碳排放的影响开展了相关分析。研究发现:
1) 2002~2010年河南省流出和流入的总贸易隐含碳排放均处于不断增加的趋势,不可避免地推动了整个河南省的贸易隐含碳排放的增加。造成河南省贸易隐含碳排放不断增加的主要原因是由其工业、建筑业和其他服务业部门所致。河南省这3个部门需要承担相对多的减排责任。就其贸易隐含碳排放的驱动因素看,河南省流出贸易隐含碳排放主要是受外部最终需求的影响,而本地最终需求和本地最终产品结构则对其流入贸易隐含碳排放的影响最为显著。
2) 从流出河南省的贸易隐含碳排放来看, 2002年流出河南省的贸易隐含碳排放主要集中在中国的中部和东南部地区。而随着区域经济的迅速发展,除新疆和内蒙古地区也逐渐成为河南省流出贸易隐含碳排放的地区外,整体而言,与2002年相比,2007与2010年流出河南省贸易隐含碳排放的总体区域格局并未发生本质变化。而从流入河南省的贸易隐含碳排放来看,2002~2010年流入河南省的贸易隐含碳排放总体格局并未出现显著变化,均是集中于中国的东部、东北部和中部地区,且具有显著的地理邻近效应,也就是说流入河南省的贸易隐含碳排放主要是来自其周边地区。
3) 在区域减排政策上,单个省区独自应对基于贸易隐含碳的减排责任划分时,贸易对其减排责任的影响更大。开展区域间的合作减排,可能会一定程度上减轻贸易隐含碳排放的影响。但需要注意的是开展区域合作后,区域内受益程度在各地区会有所差别。尤其是对于湖北来说,开展区域合作后可能会给其带来了一定的负面影响。面对这种情况,在区域内部可能还需要各个省区通过开展资金与技术的支持以弥补形成区域合作团体后给少部分区域带来的不利影响。
The authors have declared that no competing interests exist.
| [1] |
An institutionalist perspective on regional economic development [J].https://doi.org/10.1111/1468-2427.00201 URL [本文引用: 1] 摘要
By Ash Amin; An Institutionalist Perspective on Regional Economic Development
|
| [2] |
经济活动空间分布的探究:技术溢出、环境污染与贸易自由化 [J].
<p>新经济地理学第一次在一般均衡的分析框架内说明了经济活动的内生区位选择机理.经济活动的空间分布不仅跟技术溢出、环境污染有关,也跟贸易自由化有关.技术溢出效应跟空间距离有关,随着地区间技术溢出效应的增加,会加强产业的分散力,推动经济空间结构由非对称结构转向对称结构.环境污染必然影响资本生产部门的生产成本,随着地区间环境污染传播效应的增加,会增强产业的集聚力,推动经济空间结构由对称结构向非对称结构演变.贸易自由度的变化可以引起任何形式的产业空间结构稳态,对称结构、中心-外围结构以及部分产业集聚都有存在的可能.虽然经济活动的空间集中的非均衡发展是国家经济发展初期不可逾越的阶段,但是由此产生的区域经济差异会随着经济一体化的深入推进而最终消失.</p>
Exploration on the distribution of economic activity: Technology spillover, environmental pollution and trade liberalization.
<p>新经济地理学第一次在一般均衡的分析框架内说明了经济活动的内生区位选择机理.经济活动的空间分布不仅跟技术溢出、环境污染有关,也跟贸易自由化有关.技术溢出效应跟空间距离有关,随着地区间技术溢出效应的增加,会加强产业的分散力,推动经济空间结构由非对称结构转向对称结构.环境污染必然影响资本生产部门的生产成本,随着地区间环境污染传播效应的增加,会增强产业的集聚力,推动经济空间结构由对称结构向非对称结构演变.贸易自由度的变化可以引起任何形式的产业空间结构稳态,对称结构、中心-外围结构以及部分产业集聚都有存在的可能.虽然经济活动的空间集中的非均衡发展是国家经济发展初期不可逾越的阶段,但是由此产生的区域经济差异会随着经济一体化的深入推进而最终消失.</p>
|
| [3] |
Embodied environmental emissions in US international trade, 1997-2004 [J].https://doi.org/10.1021/es0629110 URL PMID: 17711196 [本文引用: 3] 摘要
Significant recent attention has been given to quantifying the environmental impacts of international trade. However, the United States, despite being the world's largest emitter of greenhouse gases and having large recent growth in international trade, has seen little analysis. This work uses a multi-country input-output model of the U.S. and its seven largest trading partners (Canada, China, Mexico, Japan, Germany, the UK, and Korea) to analyze the environmental effects of changes to U.S. trade structure and volume from 1997 to 2004. It is shown that increased import volume and shifting trade patterns during this time period led to a large increase in the U.S.' embodied emissions in trade (EET) for CO2, SO2, and NO(x). Methodological uncertainties, especially related to uncertainties of international currency conversion, lead to large differences in estimation of the total EET, but we estimate that the overall embodied CO2 in U.S. imports has grown from between 0.5 and 0.8 Gt of CO2 in 1997 to between 0.8 and 1.8 Gt of CO2 in 2004, representing between 9-14% and 13-30% of U.S. (2-4% to 3-7% of global) CO2 emissions in 1997 and 2004, respectively.
|
| [4] |
Post-Kyoto greenhouse gas inventories: Production versus consumption [J].https://doi.org/10.1007/s10584-007-9280-1 URL Magsci [本文引用: 2] 摘要
For the long-term stabilization of greenhouse gas (GHG) concentrations it is important that post-Kyoto policy has broad participation to ensure environmental integrity. Many post-Kyoto frameworks have been debated, but surprisingly approaches that focus on consumption have received little attention in the climate change literature despite broader interest in other areas. In this article we extend the argument for constructing GHG inventories using a country’s consumption rather than production. First, we argue that constructing GHG inventories using a country’s economic activity instead of geographic territory solves allocation issues for international activities such as international transportation and carbon capture and storage. Second, we argue that consumption-based GHG inventories have many advantages over production-based inventories. The main advantages are to address carbon leakage, reduce the importance of emission commitments for developing countries, increase options for mitigation, encourage environmental comparative advantage, address competitiveness concerns, and naturally encourage technology diffusion.
|
| [5] |
Carbon emissions and resources use by Chinese economy 2007: A 135-sector inventory and input-output embodiment [J].https://doi.org/10.1016/j.cnsns.2009.12.024 URL Magsci [本文引用: 1] 摘要
A 135-sector inventory and embodiment analysis for carbon emissions and resources use by Chinese economy 2007 is presented in this paper by an ecological input鈥搊utput modeling based on the physical entry scheme. Included emissions and resources belong to six categories as: (1) greenhouse gas (GHG) in terms of CO 2 , CH 4 , and N 2 O; (2) energy in terms of coal, crude oil, natural gas, hydropower, nuclear power, and firewood; (3) water in terms of freshwater; (4) exergy in terms of coal, crude oil, natural gas, grain, bean, tuber, cotton, peanut, rapeseed, sesame, jute, sugarcane, sugar beet, tobacco, silkworm feed, tea, fruits, vegetables, wood, bamboo, pulp, meat, egg, milk, wool, aquatic products, iron ore, copper ore, bauxite, lead ore, zinc ore, pyrite, phosphorite, gypsum, cement, nuclear fuel, and hydropower; (5) and (6) solar and cosmic emergies in terms of sunlight, wind power, deep earth heat, chemical power of rain, geopotential power of rain, chemical power of stream, geopotential power of stream, wave power, geothermal power, tide power, topsoil loss, coal, crude oil, natural gas, ferrous metal ore, non-ferrous metal ore, non-metal ore, cement, and nuclear fuel. Accounted based on the embodied intensities are carbon emissions and resources use embodied in the final use as rural consumption, urban consumption, government consumption, gross fixed capital formation, change in inventories, and export, as well as in the international trade balance. The resulted database is basic to environmental account of carbon emissions and resources use at various levels.
|
| [6] |
中国各省区碳足迹与碳排放空间转移 [J].https://doi.org/10.11821/xb201210004 URL Magsci [本文引用: 2] 摘要
减排责任的区域分解需要科学评价各地区的排放责任。碳足迹可以全面客观地评价为满足消费而进行的生产的生命周期碳排放水平, 除了生产过程的直接碳排放, 也包括生产过程中所消耗的中间产品的隐含碳排放。应用2007 年各省区投入产出模型和2002 年中国省区间投入产出模型, 定量测算了各省区的碳足迹和省区间的碳排放转移。结果显示, 各省区之间碳足迹和人均碳足迹存在显著的差异。碳足迹较大的省份为经济大省, 主要分布在北方地区;人均碳足迹较高的省份主要是北京、上海等中心城市和能源富集区域及重化工基地;中国存在着从能源富集区域和重化工基地分布区域向经济发达区域和产业结构不完整的欠发达区域的碳排放空间转移。上述结果表明, 人均碳足迹高的经济发达省份应承担较大的减排责任, 能源富集区域和重化工基地分布区域有相当一部分的碳排放是为沿海发达省份和产业结构不完整的欠发达省份提供电力、原材料等高碳产品所致, 减排责任的区域分解需要考虑碳排放空间转移的因素, 适当减轻能源富集区域和重化工基地分布区域的减排责任, 或使沿海发达省份向能源富集区域和重化工区域提供资金和技术上的扶持, 帮助这些区域提高能源利用效率, 减少碳排放。
Regional carbon footprint and inter-regional transfer of carbon emissions in China. https://doi.org/10.11821/xb201210004 URL Magsci [本文引用: 2] 摘要
减排责任的区域分解需要科学评价各地区的排放责任。碳足迹可以全面客观地评价为满足消费而进行的生产的生命周期碳排放水平, 除了生产过程的直接碳排放, 也包括生产过程中所消耗的中间产品的隐含碳排放。应用2007 年各省区投入产出模型和2002 年中国省区间投入产出模型, 定量测算了各省区的碳足迹和省区间的碳排放转移。结果显示, 各省区之间碳足迹和人均碳足迹存在显著的差异。碳足迹较大的省份为经济大省, 主要分布在北方地区;人均碳足迹较高的省份主要是北京、上海等中心城市和能源富集区域及重化工基地;中国存在着从能源富集区域和重化工基地分布区域向经济发达区域和产业结构不完整的欠发达区域的碳排放空间转移。上述结果表明, 人均碳足迹高的经济发达省份应承担较大的减排责任, 能源富集区域和重化工基地分布区域有相当一部分的碳排放是为沿海发达省份和产业结构不完整的欠发达省份提供电力、原材料等高碳产品所致, 减排责任的区域分解需要考虑碳排放空间转移的因素, 适当减轻能源富集区域和重化工基地分布区域的减排责任, 或使沿海发达省份向能源富集区域和重化工区域提供资金和技术上的扶持, 帮助这些区域提高能源利用效率, 减少碳排放。
|
| [7] |
Consumption-based accounting of CO2 emissions [J].https://doi.org/10.1073/pnas.0906974107 URL PMID: 20212122 [本文引用: 3] 摘要
CO60 emissions from the burning of fossil fuels are the primary cause of global warming. Much attention has been focused on the CO60 directly emitted by each country, but relatively little attention has been paid to the amount of emissions associated with the consumption of goods and services in each country. Consumption-based accounting of CO60 emissions differs from traditional, production-based inventories because of imports and exports of goods and services that, either directly or indirectly, involve CO60 emissions. Here, using the latest available data, we present a global consumption-based CO60 emissions inventory and calculations of assocaited consumption-based energy and carbon intensities. We find that, in 2004, 23% of global CO60 emissions, or 6.2 gigatonnes CO60, were traded internationally, primarily as exports from China and other emerging markets to consumers in developed countries. In some wealthy countries, including Switzerland, Sweden, Austria, the United Kingdom, and France, >30% of consumption-based emissions were imported, with net imports to many Europeans of >4 tons CO60 per person in 2004. Net import of emissions to the United States in the same year was somewhat less: 10.8% of total consumption-based emissions and 2.4 tons CO60 per person. In contrast, 22.5% of the emissions produced in China in 2004 were exported, on net, to consumers elsewhere. Consumption-based accounting of CO60 emissions demonstrates the potential for international carbon leakage. Sharing responsibility for emissions among producers and consumers could facilitate international agreement on global climate policy that is now hindered by concerns over the regional and historical inequity of emissions.
|
| [8] |
最终消费与碳减排责任的经济学分析 [J].
国际分工的深化以及各国消费模式的差异已经成为气候谈判中界定各国排放责任的焦点问题。本文基于长期的、动态的视角,提出根据最终消费来衡量各国碳排放责任的理论,并根据最终消费与碳减排责任的关系,计算了两个情景下1950—2005年世界各国累积消费排放量,发现中国约有14—33%(或超过20%)的国内实际排放是由他国消费所致,而大部分发达国家如英国、法国和意大利则相反。进而,我们从福利角度讨论了以消费排放作为公平分配指标的重要性,从而将国际社会应对气候变化的"共同但有区别的责任"原则扩展为"共同但有区别的碳消费权"原则,建议以1850年以来的(人均)累积消费排放作为国际公平分担减排责任与义务的重要指标。
An economic analysis of consumption and carbon emission responsibility.
国际分工的深化以及各国消费模式的差异已经成为气候谈判中界定各国排放责任的焦点问题。本文基于长期的、动态的视角,提出根据最终消费来衡量各国碳排放责任的理论,并根据最终消费与碳减排责任的关系,计算了两个情景下1950—2005年世界各国累积消费排放量,发现中国约有14—33%(或超过20%)的国内实际排放是由他国消费所致,而大部分发达国家如英国、法国和意大利则相反。进而,我们从福利角度讨论了以消费排放作为公平分配指标的重要性,从而将国际社会应对气候变化的"共同但有区别的责任"原则扩展为"共同但有区别的碳消费权"原则,建议以1850年以来的(人均)累积消费排放作为国际公平分担减排责任与义务的重要指标。
|
| [9] |
中国生产控制型产业减排的居民福利和区域影响 [J].
基于SAM均衡建模方法,建立面向居民福利研究的中国动态多区域社会公平CGE政策模拟模型,对比分析自然情景、生产控制型减排政策情景和最优增长情景下的区域和居民福利变化。研究发现减排政策存在明显的增长率区域分异,这将破坏在自然增长下存在的区域收敛力,导致中国区域之间的差距再度被拉大。面向减排的投资控制政策短期对于居民收入的不利影响较小,但长期影响不容忽视,需要进行居民收入保护。由于城镇退休居民和农村劳动居民已经具备针对性的养老保障政策和“三农政策”保护收入增长,其总体福利受减排政策的冲击较小,因此缺乏相应政策支持的城镇劳动居民应该是收入保护的优先考虑群体。模拟显示减排政策更有利于代际和城乡人均收入差距的缩小,但考虑到减排带来的绝对收入水平下降,不能过于乐观估计这种差距缩小效应。
Impact of carbon abatement policies inmanufacturing process control on household welfare and regional economic development.
基于SAM均衡建模方法,建立面向居民福利研究的中国动态多区域社会公平CGE政策模拟模型,对比分析自然情景、生产控制型减排政策情景和最优增长情景下的区域和居民福利变化。研究发现减排政策存在明显的增长率区域分异,这将破坏在自然增长下存在的区域收敛力,导致中国区域之间的差距再度被拉大。面向减排的投资控制政策短期对于居民收入的不利影响较小,但长期影响不容忽视,需要进行居民收入保护。由于城镇退休居民和农村劳动居民已经具备针对性的养老保障政策和“三农政策”保护收入增长,其总体福利受减排政策的冲击较小,因此缺乏相应政策支持的城镇劳动居民应该是收入保护的优先考虑群体。模拟显示减排政策更有利于代际和城乡人均收入差距的缩小,但考虑到减排带来的绝对收入水平下降,不能过于乐观估计这种差距缩小效应。
|
| [10] |
区域能源碳排放系统开发及应用 [J].
气候保护需要落实到区域层面上,区域实施碳减排政策前需要对自身的碳排放需求进行核算,开发区域能源碳排放系统以支持政府决策显得尤为必要。在介绍区域能源碳排放需求的经济动力学模型基础上,基于GIS的区域能源碳排放需求系统的开发过程,给出了应用实例。基于区域能源碳排放需求分析系统,可以方便地计算和查询中国各省市自治区未来的能源碳排放需求。基于GIS模块,通过模型用户可以对比不同区域的能源碳排放,并可方便地存储和输出。例如,以江苏省和山东省为例进行对比,可以发现山东省的能源碳排放总量和人均碳排放都比江苏省大。模型设置不同的情景分析,给各地政府实施碳减排措施提供决策支持,如以天津市为例,模拟了不同政策情景下对天津未来能源碳排放量的影响。此外,系统实现了面向国际谈判需求的多区域合成的碳排放需求估计,为国家参与气候谈判争取更多的主动权,对高度发展中国家的碳排放趋势进行的预测结果显示在平稳增长趋势下,高度发展中国家的能源消费高峰值和能源碳排放高峰值均出现在2029年。
Regional carbon emissions system development and application.
气候保护需要落实到区域层面上,区域实施碳减排政策前需要对自身的碳排放需求进行核算,开发区域能源碳排放系统以支持政府决策显得尤为必要。在介绍区域能源碳排放需求的经济动力学模型基础上,基于GIS的区域能源碳排放需求系统的开发过程,给出了应用实例。基于区域能源碳排放需求分析系统,可以方便地计算和查询中国各省市自治区未来的能源碳排放需求。基于GIS模块,通过模型用户可以对比不同区域的能源碳排放,并可方便地存储和输出。例如,以江苏省和山东省为例进行对比,可以发现山东省的能源碳排放总量和人均碳排放都比江苏省大。模型设置不同的情景分析,给各地政府实施碳减排措施提供决策支持,如以天津市为例,模拟了不同政策情景下对天津未来能源碳排放量的影响。此外,系统实现了面向国际谈判需求的多区域合成的碳排放需求估计,为国家参与气候谈判争取更多的主动权,对高度发展中国家的碳排放趋势进行的预测结果显示在平稳增长趋势下,高度发展中国家的能源消费高峰值和能源碳排放高峰值均出现在2029年。
|
| [11] |
China’s provincial CO2 emissions embodied in international and interprovincial trade [J].https://doi.org/10.1016/j.enpol.2011.12.015 URL [本文引用: 3] 摘要
78 China’s embodied CO2 emissions are analyzed from the provincial perspective. 78 Eastern provinces have larger CO2 emissions embodied in international trade. 78 Embodied CO2 emissions are mainly transferred from eastern area to central area. 78 Coastal provinces play important roles in CO2 emissions reduction. 78 Inland provinces need supportive policies on emissions reduction.
|
| [12] |
中国地区间贸易隐含CO2测算 [J].https://doi.org/10.3969/j.issn.1002-4565.2013.09.004 URL [本文引用: 1] 摘要
本文基于多区域投入产出模型方法测算了中国2007年8大地区CO2排放的生产者责任与消费者责任,既估算了各地区对外贸易出口与进口的隐含CO2排放量,也估算了中国8大地区之间贸易流入流出所隐含的CO2排放量;并比较分析了不同地区CO2排放成本转移的相对强度,提示了不同地区贸易隐含CO2排放的行业分布特征。研究结果表明,就中国与国外的隐含CO2流动看,中国生产过程中实际排放的CO2已超过了消费者责任下的排放量;就中国内部来说,也存在着经济相对发达的沿海地区向欠发达的内陆地区的"碳泄露"现象,而南部沿海和京津地区的CO2排放成本转移的相对强度最大,同时内陆与沿海地区的隐含CO2排放的产业分布也存在着一定程度的差异。
Measurement of embodied CO2 in China’sregional trade. https://doi.org/10.3969/j.issn.1002-4565.2013.09.004 URL [本文引用: 1] 摘要
本文基于多区域投入产出模型方法测算了中国2007年8大地区CO2排放的生产者责任与消费者责任,既估算了各地区对外贸易出口与进口的隐含CO2排放量,也估算了中国8大地区之间贸易流入流出所隐含的CO2排放量;并比较分析了不同地区CO2排放成本转移的相对强度,提示了不同地区贸易隐含CO2排放的行业分布特征。研究结果表明,就中国与国外的隐含CO2流动看,中国生产过程中实际排放的CO2已超过了消费者责任下的排放量;就中国内部来说,也存在着经济相对发达的沿海地区向欠发达的内陆地区的"碳泄露"现象,而南部沿海和京津地区的CO2排放成本转移的相对强度最大,同时内陆与沿海地区的隐含CO2排放的产业分布也存在着一定程度的差异。
|
| [13] |
Delving into the carbon footprints of Singapore—Comparing direct and indirect greenhouse gas emissions of a small and open economic system [J].https://doi.org/10.1016/j.enpol.2009.08.066 URL Magsci [本文引用: 1] 摘要
Small and open economic systems like cities face specific challenges for greenhouse gas accounting. They typically import most of their energy requirements as secondary energy products based on conversion processes which caused emissions elsewhere. Emission estimates therefore already require attention not only to direct on-site activities. Moreover, for a comprehensive approach it is suggested to include upstream and downstream processes of connected socioeconomic systems and the indirect life-cycle related emissions of imported and exported goods. Singapore is used in this longitudinal study as an example of an urban scale economy. Accounts for direct emissions are compared with trade corrected estimates of indirect emissions. Results indicate that direct emissions account for only about 20% of the overall upstream emissions necessary to sustain the input side of the economic production process (domestic emissions plus indirect emissions embodied in imported goods). If indirect emissions embodied in exports are considered and subtracted from the previous figure, the trade corrected accounts for direct and indirect emissions still exceed direct emission accounts, although by less than 40%. Given the increasing trends in world trade and urbanisation, indirect pressures of urban systems should be included in discussions of effective and fair adaptation and mitigation strategies.
|
| [14] |
From production-based to consumption-based national emission inventories [J].https://doi.org/10.1016/j.ecolecon.2007.10.014 URL [本文引用: 1] 摘要
Under the United National Framework Convention of Climate Change (UNFCCC) countries are required to submit National Emission Inventories (NEI) to benchmark reductions in greenhouse gas (GHG) emissions. Depending on the definition and system boundary of the NEI, the mitigation options and priorities may vary. The territorial system boundary used by the UNFCCC has been critiqued for not including international transportation and potentially causing carbon leakage. To address these issues, past literature has argued in favour of using consumption-based NEI in climate policy. This article discusses several issues in moving from the standard production-based NEI to consumption-based NEI. First, two distinct accounting approaches for constructing consumption-based NEI are presented. The approaches differ in the allocation of intermediate consumption of imported products. Second, a consistent method of weighting production-based and consumption-based NEI is discussed. This is an extension of the previous literature on shared responsibility to NEI. Third, due to increased uncertainty and a wide system boundary it may be difficult to implement consumption-based NEI directly into climate policy. Several alternative options for incorporating consumption-based inventories into climate policy are discussed.
|
| [15] |
A Madisonian approach to climate policy [J].https://doi.org/10.1126/science.1113180 URL PMID: 16166505 [本文引用: 2] 摘要
Climate change is a global phenomenon, but the institutions needed to implement effective policy reside mainly with nationalgovernments. This mismatch explains why serious efforts to control emissions of greenhouse gases, such as markets for emissioncredits, are fragmented across national and regional lines. Climate policy is emerging from the bottom up rather than throughglobally orchestrated treaties such as the Kyoto Protocol. The authors of thisPolicy Forumstate that fuller efforts to control emissions will require serious engagement of the United States and developing countries,as well as viable schemes for integrating the many fragmented policies that are arising as governments grapple with the climatechallenge.
|
| [16] |
The contribution of Chinese exports to climate change [J].https://doi.org/10.1016/j.enpol.2008.06.009 URL Magsci 摘要
Within 5 years, China's CO 2 emissions have nearly doubled, and China may already be the world's largest emitter of CO 2. Evidence suggests that exports could be a main cause for the rise in Chinese CO 2 emissions; however, no systematic study has analyzed this issue, especially over time. We find that in 2005, around one-third of Chinese emissions (1700 Mt CO 2) were due to production of exports, and this proportion has risen from 12% (230 Mt) in 1987 and only 21% (760 Mt) as recently as 2002. It is likely that consumption in the developed world is driving this trend. A majority of these emissions have largely escaped the scrutiny of arguments over “carbon leakage” due to the current, narrow definition of leakage. Climate policies which would make the developed world responsible for China's export emissions have both benefits and costs, and must be carefully designed to achieve political consensus and equity. Whoever is responsible for these emissions, China's rapidly expanding infrastructure and inefficient coal-powered electricity system need urgent attention.
|
| [17] |
Embodied carbon dioxide emission at supra-national scale: A coalition analysis for G7, BRIC, and the rest of the world [J].https://doi.org/10.1016/j.enpol.2011.02.068 URL Magsci 摘要
78 We compare the embodied CO 2 emissions in 2004 for G7, BRIC, and ROW. 78 Emissions embodied in production, consumption, import, and export are investigated. 78 Considerable CO 2 trade surplus and deficit are obtained by G7 and BRIC, respectively. 78 Per head embodied emissions are 13, 1.5, and 2.2 tons for G7, BRIC, and ROW, respectively.
|
| [18] |
Growth in emission transfers via international trade from 1990 to 2008 [J].https://doi.org/10.1073/pnas.1006388108 URL PMID: 21518879 [本文引用: 1] 摘要
Despite the emergence of regional climate policies, growth in global CO60 emissions has remained strong. From 1990 to 2008 CO60 emissions in developed countries (defined as countries with emission-reduction commitments in the Kyoto Protocol, Annex B) have stabilized, but emissions in developing countries (non-Annex B) have doubled. Some studies suggest that the stabilization of emissions in developed countries was partially because of growing imports from developing countries. To quantify the growth in emission transfers via international trade, we developed a trade-linked global database for CO60 emissions covering 113 countries and 57 economic sectors from 1990 to 2008. We find that the emissions from the production of traded goods and services have increased from 4.3 Gt CO60 in 1990 (20% of global emissions) to 7.8 Gt CO60 in 2008 (26%). Most developed countries have increased their consumption-based emissions faster than their territorial emissions, and non—energy-intensive manufacturing had a key role in the emission transfers. The net emission transfers via international trade from developing to developed countries increased from 0.4 Gt CO60 in 1990 to 1.6 Gt CO60 in 2008, which exceeds the Kyoto Protocol emission reductions. Our results indicate that international trade is a significant factor in explaining the change in emissions in many countries, from both a production and consumption perspective. We suggest that countries monitor emission transfers via international trade, in addition to territorial emissions, to ensure progress toward stabilization of global greenhouse gas emissions.
|
| [19] |
Three-scale input-output modeling for urban economy: Carbon emission by Beijing 2007 [J].Outsourcing CO2 within China [J]. |
| [21] |
China’s provincial CO2 emissions embodied in trade with implications for regional climate policy [J].https://doi.org/10.1007/s11707-014-0450-y URL [本文引用: 5] |
| [22] |
区域分部门贸易的隐含碳排放——以北京为例 [J].https://doi.org/10.11821/dlyj201505012 URL Magsci 摘要
碳排放增多带来的气候变化已成为各国政府共同面对的问题,碳减排责任的划分是各国争论的焦点,而国际贸易造成的"碳泄露"问题更是不可忽视。中国的碳减排责任最终要落实到省市区域尺度上,区域间贸易引起的"碳泄露"同样值得考虑。使用多区域投入产出分析法,分别从生产者和消费者的角度对北京各部门碳排放进行分析,并估算各部门进出口贸易中隐含的碳排放量。结果表明北京是一个碳排放净流入区域。基于生产者和消费者的角度,北京的碳排放总量分别是142.79 Mt和116.80 Mt。输出贸易中隐含的碳排放量为28.15 Mt,包括区域间调出和国际出口。输出贸易中隐含碳排放最大的部门是石油加工、炼焦及核燃料加工业。输入贸易中隐含的碳排放量为54.15 Mt,包括区域间调入和国际进口。输入贸易中隐含的碳排放最大的部门是建筑业。
Measurements of regional sectoral embodied CO2 emissions: A case study of Beijing. https://doi.org/10.11821/dlyj201505012 URL Magsci 摘要
碳排放增多带来的气候变化已成为各国政府共同面对的问题,碳减排责任的划分是各国争论的焦点,而国际贸易造成的"碳泄露"问题更是不可忽视。中国的碳减排责任最终要落实到省市区域尺度上,区域间贸易引起的"碳泄露"同样值得考虑。使用多区域投入产出分析法,分别从生产者和消费者的角度对北京各部门碳排放进行分析,并估算各部门进出口贸易中隐含的碳排放量。结果表明北京是一个碳排放净流入区域。基于生产者和消费者的角度,北京的碳排放总量分别是142.79 Mt和116.80 Mt。输出贸易中隐含的碳排放量为28.15 Mt,包括区域间调出和国际出口。输出贸易中隐含碳排放最大的部门是石油加工、炼焦及核燃料加工业。输入贸易中隐含的碳排放量为54.15 Mt,包括区域间调入和国际进口。输入贸易中隐含的碳排放最大的部门是建筑业。
|
| [23] |
城市贸易隐含碳排放的计算——以上海市为例 [J].https://doi.org/10.13284/j.cnki.rddl.002787 URL Magsci 摘要
基于多区域投入产出模型,以上海市为例全面了探讨城市地区的贸易隐含碳排放,并在此基础上深入分析贸易对城市产业与最终消费部门碳排放及其减排责任的影响。研究发现:2007年上海市各部门的国内贸易隐含碳总量为68.97 Mt CO2,约占当年上海碳排放总量的42.31%;而其国际贸易隐含碳量的上限值和下限值分别为44.39和25.93 Mt CO2,分别约占当年上海碳排放总量的27.23%和15.91%。与此同时,2007年上海市最终消费的国内贸易隐含碳总量为13.63 Mt CO2,约占当年上海碳排放总量的8.36%;而其国际贸易隐含碳量的上限值和下限值分别为4.58和0.59 Mt CO2,分别约占当年上海碳排放总量的2.81%和0.36%。此外,上海市的国际与国内贸易隐含碳流入量和流出量等均存在显著的部门差异。而在国内贸易中上海市贸易隐含碳的流入与流出上,流入上海的贸易隐含碳排名前五的地区分别是河北、浙江、湖北、江苏和河南,接受流出上海的贸易隐含碳量排名前五的地区分别是浙江、广东、江苏、河北和安徽。
Calculation of CO2 emission embodied in city trade: A case study of Shanghai. https://doi.org/10.13284/j.cnki.rddl.002787 URL Magsci 摘要
基于多区域投入产出模型,以上海市为例全面了探讨城市地区的贸易隐含碳排放,并在此基础上深入分析贸易对城市产业与最终消费部门碳排放及其减排责任的影响。研究发现:2007年上海市各部门的国内贸易隐含碳总量为68.97 Mt CO2,约占当年上海碳排放总量的42.31%;而其国际贸易隐含碳量的上限值和下限值分别为44.39和25.93 Mt CO2,分别约占当年上海碳排放总量的27.23%和15.91%。与此同时,2007年上海市最终消费的国内贸易隐含碳总量为13.63 Mt CO2,约占当年上海碳排放总量的8.36%;而其国际贸易隐含碳量的上限值和下限值分别为4.58和0.59 Mt CO2,分别约占当年上海碳排放总量的2.81%和0.36%。此外,上海市的国际与国内贸易隐含碳流入量和流出量等均存在显著的部门差异。而在国内贸易中上海市贸易隐含碳的流入与流出上,流入上海的贸易隐含碳排名前五的地区分别是河北、浙江、湖北、江苏和河南,接受流出上海的贸易隐含碳量排名前五的地区分别是浙江、广东、江苏、河北和安徽。
|
| [24] |
Understanding environmental responsibility of cities and emissions embodied in trade [J].https://doi.org/10.1080/09535314.2015.1012638 URL [本文引用: 1] 摘要
The attribution of greenhouse gas (GHG) emissions embedded in interregionally traded products to either production or consumption regions is a key issue to the understanding of the global environmental responsibility of metropolitan areas. In this paper we identify GHG emissions for which metropolitan areas assume responsibility by allocating emissions embodied in import and export products to regions of either consumption or production in the cases of three US metropolitan areas. The case studies show that embodied emissions in both export and import products accounted for 63鈥73% of total GHG emissions directly and indirectly pertaining to these metropolitan economies. These findings suggest that an accounting method that incorporates emissions embodied in product trade has relevance to the development of local policies that govern actions ranging from redirecting metropolitan development patterns toward low carbon emissions to promoting sustainable consumption behavior, particularly those involving the collaboration of cities.
|
| [25] |
A structural decomposition analysis of the emissions embodied in trade [J].https://doi.org/10.1016/j.ecolecon.2014.02.015 URL [本文引用: 2] 摘要
The aim of this study is to quantify the driving forces behind the growth of carbon dioxide emissions embodied in trade (EET). The World Input–output Database is used to estimate EET in 40 countries during 1995–2007 after which a structural decomposition analysis is applied. To avoid biases in the results, we have used the input–output tables in previous year's prices and chained the outcomes. In many developed countries, the growth of emissions embodied in imports is much higher than the growth of emissions embodied in exports. A key reason for this finding is the change in the structure of trade, both in intermediate and in final products. Emerging economies like the BRIC countries have increased their share in production and trade at the expense of developed countries. Producers and consumers in developed countries have shifted towards importing a larger share of products from emerging countries. This is the distinguishing feature that led to an increase of emissions embodied in imports for developed countries and an increase of emissions embodied in exports for emerging countries. These results suggest policy makers to monitor EET more carefully and take the effects of trade on emissions into consideration.
|
| [26] |
中国省域城镇居民碳排放驱动因素分析 [J].https://doi.org/10.13249/j.cnki.sgs.2016.05.006 URL Magsci [本文引用: 1] 摘要
<p>从消费角度出发,分别对2003和2012年中国城镇(不含港、澳、台地区)居民碳排放的特征及影响因素进行分析。结果显示,不同地区城镇居民碳排放存在明显差异,人口因素对区域分异有弱化作用。从城镇居民人均碳排放来看,不同地区消费构成、能源结构、产业结构3因素对城镇居民碳排放影响的差异总体表现为:消费结构/能源结构>产业结构。与其他部门相比,大多数地区工业部门的生产能耗、投入产出周转量和产品购买量是影响当地城镇居民碳排放的主要因素,各地区城镇居民碳排放的影响因素具有明显的区域特点。政府应在当前研究的基础上,根据当地能耗模式、产业模式和消费模式因地置宜管理城镇居民碳排放。</p>
Driving factorsanalysis of carbon emissions in Chinese provincial urban households. https://doi.org/10.13249/j.cnki.sgs.2016.05.006 URL Magsci [本文引用: 1] 摘要
<p>从消费角度出发,分别对2003和2012年中国城镇(不含港、澳、台地区)居民碳排放的特征及影响因素进行分析。结果显示,不同地区城镇居民碳排放存在明显差异,人口因素对区域分异有弱化作用。从城镇居民人均碳排放来看,不同地区消费构成、能源结构、产业结构3因素对城镇居民碳排放影响的差异总体表现为:消费结构/能源结构>产业结构。与其他部门相比,大多数地区工业部门的生产能耗、投入产出周转量和产品购买量是影响当地城镇居民碳排放的主要因素,各地区城镇居民碳排放的影响因素具有明显的区域特点。政府应在当前研究的基础上,根据当地能耗模式、产业模式和消费模式因地置宜管理城镇居民碳排放。</p>
|
| [27] |
Blaming cities for climate change? An analysis of urban greenhouse gas emissions inventories [J]. |
| [28] |
我国各省区碳排放量状况及减排对策研究 [J].Study on the status of carbon emission in provincial scale of China andcountermeasures for reducing its emission. |
| [29] |
|
| [30] |
河南省能源消费碳排放的历史特征及趋势预测 [J].
根据联合国政府间气候变化专门委员会(IPCC)2006年版碳排放计算指南计算了河南省1995—2006年的能源消费碳排放量。预测了2007—2050年河南省平稳经济增长路径下的最优经济增长率和2007—2050年的河南省能源消费结构和产业结构。进一步,计算了河南省2007—2050年在经济平稳增长路径下的能源消费与碳排放总量以及人均量。结果表明:1995年以来,河南省的碳排放量逐年增加,碳排放强度先是逐年下降,到2003年发生转折,出现上升的趋势;同时,预测的2007—2050年的能源结构显示,河南省煤炭资源在能源消费总量中所占的比重有较大幅度的下降,石油与其他清洁能源的比重不断上升;另外,河南省分别在2036年和2034年达到能源消费和碳排放总量高峰;人均能源消费量和碳排放量的高峰则出现在2033年和2032年。另外,尝试预测了河南省森林碳汇潜力,发现2006—2050年累计森林碳汇量持续上升,到2050年,累计碳汇量达131.14Mtc。
The historical characteristics and trend forecasting of carbon emissions from energy consumption in Henan province.
根据联合国政府间气候变化专门委员会(IPCC)2006年版碳排放计算指南计算了河南省1995—2006年的能源消费碳排放量。预测了2007—2050年河南省平稳经济增长路径下的最优经济增长率和2007—2050年的河南省能源消费结构和产业结构。进一步,计算了河南省2007—2050年在经济平稳增长路径下的能源消费与碳排放总量以及人均量。结果表明:1995年以来,河南省的碳排放量逐年增加,碳排放强度先是逐年下降,到2003年发生转折,出现上升的趋势;同时,预测的2007—2050年的能源结构显示,河南省煤炭资源在能源消费总量中所占的比重有较大幅度的下降,石油与其他清洁能源的比重不断上升;另外,河南省分别在2036年和2034年达到能源消费和碳排放总量高峰;人均能源消费量和碳排放量的高峰则出现在2033年和2032年。另外,尝试预测了河南省森林碳汇潜力,发现2006—2050年累计森林碳汇量持续上升,到2050年,累计碳汇量达131.14Mtc。
|
| [31] |
Structural decomposition techniques: Sense and sensitivity [J].https://doi.org/10.1080/09535319800000023 URL [本文引用: 2] 摘要
Structural decomposition techniques are widely used to break down the growth in some variable into the changes in its determinants. In this paper, we discuss the problems caused by the existence of a multitude of equivalent decomposition forms which are used to measure the contribution of a specific determinant. Although it is well known that structural decompositions are not unique, the extent of the problem and its consequences seem to have been largely neglected. In an empirical analysis for The Netherlands between 1986 and 1992, results are calculated for 24 equivalent decomposition forms. The outcomes exhibit a large degree of variability across the different forms. We also examine the two approaches that have been used predominantly in the literature. The average of the two so-called polar decompositions appears to be remarkably close to the average of the full set of 24 decompositions. The approximate decomposition with mid-point weights appears to be almost exact. Although this last alternative might seem a solution to the problem of the marked sensitivity, in fact, it only conceals the problem.
|
| [32] |
Properties and linkages of some index decomposition analysis methods [J].https://doi.org/10.1016/j.enpol.2009.06.017 URL Magsci [本文引用: 1] 摘要
We study the properties and linkages of some popular index decomposition analysis (IDA) methods in energy and carbon emission analyses. Specifically, we introduce a simple relationship between the arithmetic mean Divisia index (AMDI) method and the logarithmic mean Divisia index method I (LMDI I), and show that such a relationship can be extended to cover most IDA methods linked to the Divisia index. We also formalize the relationship between the Laspeyres index method and the Shapley value in the IDA context. Similarly, such a relationship can be extended to cover other IDA methods linked to the Laspeyres index through defining the characteristic function in the Shapley value. It is found that these properties and linkages apply to decomposition of changes conducted additively. Similar properties and linkages cannot be established in the multiplicative case. The implications of the findings on IDA studies are discussed.
|
| [33] |
A structural decomposition analysis of pollution in the Netherlands [J].https://doi.org/10.1080/09537320120052452 URL [本文引用: 1] 摘要
This paper reviews the results of a structural decomposition analysis in which the annual changes in a number of air pollutants and solid waste are decomposed according to their causes. The analysis in this paper is applied with the help of the so-called National Accounting Matrix including Environmental Accounts (NAMEA) for the Netherlands, covering annual data for the period 1987-1998. In a sensitivity analysis it is shown that the average of any pair of so-called 'mirror image' decomposition forms will substantially reduce the variation in the estimates. These mirror image couples are approximately just as reliable as the full average of all decomposition forms. Besides reliable results, the full average also foresees the mutual comparability between the distinguished change factors and is therefore applied in the empirical analyses presented in this paper. The results of these analyses contain the macro-economic developments, results on the industry level as well as a comprehensive overview of the origin and destination of pollution in the Dutch economy that includes the environmental consequences of consumption and international trade.
|
| [34] |
中国主体功能区协调发展与产业结构演化 [J].
<p>主体功能区思想下的国土协调开发是当前主导的区域发展理论。这种区域思想指导下的产业结构演化路径以及由此形成的新型区域协调关系是需要关注的重大问题。基于省级多区域动态CGE模型, 面向主体功能区格局进行区域分析, 并开展白、黄、蓝3 种区域产业政策情景模拟, 其中白情景作为比对的基准情景, 黄情景和蓝情景分别刻划面向优化开发主导区金融服务业的倾向政策和面向重点开发主导区工业发展的倾向政策。研究发现主体功能区的竞争主要体现为优化开发主导区和重点开发主导区之间的竞争, 在推进“主体功能区政策”作用下, 区域差距将会增大, 区域自然收敛的动力还不足以较快缩小区域差距, 从而需要更强烈的区域政策进行调控。另外, 区域产业结构自然演化的结果会带来“自动”碳减排, 从而衍生出更强的减排政策评判标准。</p>
A simulation on regional coordination and industrial structure evolution oriented to the main functional areas of China.
<p>主体功能区思想下的国土协调开发是当前主导的区域发展理论。这种区域思想指导下的产业结构演化路径以及由此形成的新型区域协调关系是需要关注的重大问题。基于省级多区域动态CGE模型, 面向主体功能区格局进行区域分析, 并开展白、黄、蓝3 种区域产业政策情景模拟, 其中白情景作为比对的基准情景, 黄情景和蓝情景分别刻划面向优化开发主导区金融服务业的倾向政策和面向重点开发主导区工业发展的倾向政策。研究发现主体功能区的竞争主要体现为优化开发主导区和重点开发主导区之间的竞争, 在推进“主体功能区政策”作用下, 区域差距将会增大, 区域自然收敛的动力还不足以较快缩小区域差距, 从而需要更强烈的区域政策进行调控。另外, 区域产业结构自然演化的结果会带来“自动”碳减排, 从而衍生出更强的减排政策评判标准。</p>
|
| [35] |
|
| [36] |
|
| [37] |
区域产业关联经济距离模型的构建及实证分析 [J].https://doi.org/10.3969/j.issn.1007-9807.2013.06.006 URL 摘要
国民经济系统中产业之间既存在关联,又存在经济距离.关联反映产业之间联系程度的紧密,经济距离反映产业之间中间生产环节的多少.本文结合投入产出关联度和APL模型两种方法各自的优点,创建了区域产业关联经济距离模型,包括前向关联经济距离指数和后向关联经济距离指数,并采用1997-2007中国区域间投入产出表的电力热力业作了实证分析.研究结果表明,从初始投入的上游产业来看,1997-2007年在中国8大区域的区域内和区域之间,呈现出采选业与电力热力业以及电力热力业与其自身的关联程度最大且经济距离最短;从最终需求的下游产业来看,1997年重工业与电力热力业以及电力热力业与其自身的关联程度最大且经济距离最短,2002年则增加了建筑业与电力热力业关联程度最大且经济距离最短,2007年除了京津区域的建筑业与北部沿海区域的电力热力业的关联程度最大且经济距离最短外,其余均为电力热力业与其自身的关联程度最大且经济距离最短.研究结果进一步显示,1997—2007年8大区域中电力热力业上下游生产链在区域内的能源经济联系比区域间更紧密.受空间成本的影响,绝大多数区域的能源对外联系仍以相邻区域为主导.
A model construction and empirical analysis of regional industrial linkageand economic distance. https://doi.org/10.3969/j.issn.1007-9807.2013.06.006 URL 摘要
国民经济系统中产业之间既存在关联,又存在经济距离.关联反映产业之间联系程度的紧密,经济距离反映产业之间中间生产环节的多少.本文结合投入产出关联度和APL模型两种方法各自的优点,创建了区域产业关联经济距离模型,包括前向关联经济距离指数和后向关联经济距离指数,并采用1997-2007中国区域间投入产出表的电力热力业作了实证分析.研究结果表明,从初始投入的上游产业来看,1997-2007年在中国8大区域的区域内和区域之间,呈现出采选业与电力热力业以及电力热力业与其自身的关联程度最大且经济距离最短;从最终需求的下游产业来看,1997年重工业与电力热力业以及电力热力业与其自身的关联程度最大且经济距离最短,2002年则增加了建筑业与电力热力业关联程度最大且经济距离最短,2007年除了京津区域的建筑业与北部沿海区域的电力热力业的关联程度最大且经济距离最短外,其余均为电力热力业与其自身的关联程度最大且经济距离最短.研究结果进一步显示,1997—2007年8大区域中电力热力业上下游生产链在区域内的能源经济联系比区域间更紧密.受空间成本的影响,绝大多数区域的能源对外联系仍以相邻区域为主导.
|
| [38] |
中国区域间隐含污染转移研究 [J].
随着世界经济一体化程度不断加深,国际贸易中的隐含资源和隐含污染受到广泛关注,但目前对中国区域间隐含污染转移的研究较为欠缺.本文首先从理论层面对隐含污染转移现象进行剖析,从地理学角度探讨了污染转移的模式;然后,基于区域间投入产出表,构建区域间隐含污染转移的评估模型;选取SO2、COD、固体废弃物及重金属四种典型工业污染物,评估2007年中国各区域本地最终使用中的隐含污染,及区域间隐含污染转移量,揭示我国隐含污染转移的空间特征.研究发现中国整体上是隐含污染的输出地区,国内隐含污染转移主要是从经济欠发达的中西部地区流向城市化率较高、经济发达的东部沿海地区,实际上是东部地区通过区域间贸易将自身的污染排放负担转移到中西部地区.最后基于隐含污染转移格局,对区域污染物减排政策的制定提出了一系列建议.
Study on inter-regional transfer of embodied pollution in China.
随着世界经济一体化程度不断加深,国际贸易中的隐含资源和隐含污染受到广泛关注,但目前对中国区域间隐含污染转移的研究较为欠缺.本文首先从理论层面对隐含污染转移现象进行剖析,从地理学角度探讨了污染转移的模式;然后,基于区域间投入产出表,构建区域间隐含污染转移的评估模型;选取SO2、COD、固体废弃物及重金属四种典型工业污染物,评估2007年中国各区域本地最终使用中的隐含污染,及区域间隐含污染转移量,揭示我国隐含污染转移的空间特征.研究发现中国整体上是隐含污染的输出地区,国内隐含污染转移主要是从经济欠发达的中西部地区流向城市化率较高、经济发达的东部沿海地区,实际上是东部地区通过区域间贸易将自身的污染排放负担转移到中西部地区.最后基于隐含污染转移格局,对区域污染物减排政策的制定提出了一系列建议.
|
| [39] |
IPCC. The 2006 IPCC guidelines for national greenhouse gas inventories (2006 guidelines) [C/OL]. Also available at: . |
| [40] |
Machado G V. Energy use, CO2 emissions and foreign trade: An IO approach applied to the Brazilian case [C/OL].Thirteenth international conference on input-output techniques, Macerata, Italy. 2000: 21-25.Also available at: . |
| [41] |
MunksgaardJ. CO2 multipliers in multi-region input-output models [J]. |
| [42] |
Input-output analysis of CO2 emissions embodied in trade: The effects of sector aggregation [J].https://doi.org/10.1016/j.eneco.2009.07.010 URL [本文引用: 1] 摘要
Energy-related CO 2 emissions embodied in international trade have been widely studied by researchers using the environmental input–output analysis framework. It is well known that both sector aggregation and spatial aggregation affect the results obtained in such studies. With regard to the latter, past studies are often conducted at the national level irrespective of country or economy size. For a large economy with the needed data, studies may be conducted at different levels of spatial aggregation. We examine this problem analytically by extending the work of Su et al. ([Su, B., Huang, H.C., Ang, B.W., Zhou, P., 2010. Input-output analysis of CO 2 emissions embodied in trade: The effects of sector aggregation. Energy Economics 32 (1), 166–175.]) on sector aggregation. We present a numerical example using the data of China and by dividing the country into eight regions. It is found that the results are highly dependent on spatial aggregation. Our study shows that for a large country like China it is meaningful to look into the effect of spatial aggregation.
|
| [43] |
Can emissions trading schemes be coupled with border tax adjustments? An analysis vis-à-vis WTO law1 [J].https://doi.org/10.1111/j.1467-9388.2006.00518.x URL [本文引用: 1] 摘要
This article examines concerns created by the implementation of the emissions trading scheme (EU ETS) within the EU upon the international competitiveness of EU-based industry. It analyses current discussions on whether it would be feasible to couple the EU ETS with border tax adjustments (BTA) in order to address those competitiveness concerns. The (il)legality of introducing BTA vis-vis relevant World Trade Organization (WTO) agreements is discussed (in particular the General Agreement on Tariffs and Trade and the Subsidies and Countervailing Measures Agreement), and different opinions are reviewed. In the light of that discussion, some suggestions that come from the literature on how to reconcile BTA in connection with the EU ETS and WTO relevant law are presented.
|
| [44] |
CO2 embodied in international trade with implications for global climate policy [J].https://doi.org/10.1021/es072023k URL PMID: 18441780 [本文引用: 4] 摘要
The flow of pollution through international trade flows has the ability to undermine environmental policies, particularly for global pollutants. In this article we determine the CO2 emissions embodied in international trade among 87 countries for the year 2001. We find that globally there are over 5.3 Gt of CO2 embodied in trade and that Annex B countries are net importers of CO2 emissions. Depending on country characteristics--such as size variables and geographic location--there are considerable variations in the embodied emissions. We argue that emissions embodied in trade may have a significant impact on participation in and effectiveness of global climate policies such as the Kyoto Protocol. We discuss several policy options to reduce the impact of trade in global climate policy. If countries take binding commitments as a part of a coalition, instead of as individual countries, then the impacts of trade can be substantially reduced. Adjusting emission inventories for trade gives a more consistent description of a country's environmental pressures and circumvents many trade related issues. It also gives opportunities to exploit trade as a means of mitigating emissions. Not least, a better understanding of the role that trade plays in a country's economic and environmental development will help design more effective and participatory climate policy post-Kyoto.
|

/
| 〈 |
|
〉 |