顾西辉 , 张强, 孔冬冬
Gu Xihui, Zhang Qiang, Kong Dongdong
中图分类号: P333
文献标识码: A
文章编号: 1000-0690(2017)06-0929-09
通讯作者:
收稿日期: 2016-08-15
修回日期: 2017-01-20
网络出版日期: 2017-06-20
版权声明: 2017 《地理科学》编辑部 本文是开放获取期刊文献,在以下情况下可以自由使用:学术研究、学术交流、科研教学等,但不允许用于商业目的.
基金资助:
作者简介:
作者简介:顾西辉(1990-),男,博士研究生,主要从事气象水文学研究。E-mail:guxihui421@163.com
展开
摘要
基于热带气旋时间、路径、强度数据和中国728个气象站点1951~2014年日降水数据,分析了年和季节极端降水广义极值(GEV)分布函数特征及受热带气旋的影响。通过检查年和各季节极端降水的非一致性,发现具有变异点或显著时间趋势的站点占总站点数的比例较低。仅考虑满足一致性的站点,年和各季节极端降水GEV分布上尾部在全国大部分区域表现出厚尾特征,且不具有上边界。总体来看北方厚尾特征重于南方,秋季和冬季明显高于年和夏季。年极端降水厚尾特征受到不同季节极端降水机制的混合影响。而且,热带气旋对中国沿海区域极端降水有重要影响,往往引发大量级极端降水。东南沿海地区最大10场极端降水由热带气旋引发的比例达到60%以上。因此热带气旋趋向于增加沿海区域年极端降水GEV分布形状参数的大小,并控制着曲线上尾部的形状。
关键词:
Abstract
Based on the daily precipitation and tropical cyclones data in 728 stations from 1951 to 2014 in China, spatio-temporal patterns of extreme precipitation Generalized Extreme Value (GEV) distribution with annual and seasonal scales and potential relationships with tropical cyclones were analyzed. We examined the nonstationarity in annual and seasonal extreme precipitation and found that the frequency of stations with change point or significant temporal trend on total 728 stations was small. For stations with stationary in annual and seasonal extreme precipitation, the distribution curves of annual and seasonal extreme precipitation had thick upper tails and unbounded. And the upper tails in north of China were thicker than south of China with bigger in autumn and winter than annual and summer. However, the thick tails at annual scale were influenced by seasonal extreme precipitation. In addition, tropical cyclones play an important role in extreme precipitation generating mechanisms on China's coastal regions, which often caused precipitation with bigger magnitude. More than 60% of the ten largest annual precipitation extremes were caused by tropical cyclones. Therefore, anomalously large values of the GEV shape parameter estimates were linked to the role of tropical cyclones in controlling the upper tail of extreme precipitation distributions.
Keywords:
极端气象水文事件往往对人类社会及经济发展带来巨大影响。正因为如此,气象水文极值的研究已引起人们的广泛关注。近几十年来,气候模式模拟结果表明全球水文循环有加剧趋势[1]。尤其在全球变暖影响下,中国21世纪极端降水过程将发生显著变异[2]。中国极端降水事件已呈现增加趋势[3],并对农业产生重大影响[4]。中国是农业大国,农业生产的重要性不言而喻,因此,极端气象水文事件时空特征及成因已成为当前研究热点[5,6]。
对于中国极端降水时空特征的研究已有较多[5,6],然而对于中国极端降水极值分布函数特征及尾部性质的研究却鲜有报导。极端降水频率分析的主要目的之一是计算设计标准和重现期。它应该尽可能准确,从而为水利工程、供水设施、防洪排涝和水资源管理提供可靠的依据。一般通过估计极值分布函数[例如广义极值(GEV)分布、皮尔逊-III型等]的参数(位置参数、尺度参数和形状参数)来计算设计标准和重现期。近年来,大量研究表明气象水文序列的非一致性对极值分布函数的参数估计具有显著影响[7,8]。Salas定义一致性为:气象水文序列满足无显著时间趋势、无变异、无周期[9]。极端降水极值分布函数的上尾部(极值拟合曲线的上端)特征对于设计标准和重现期的估计,尤其对罕见稀有事件(例如百年一遇、千年一遇等)具有显著的影响。GEV分布提供了一个有利的框架用来分析极端降水的上尾部性质(薄尾、厚尾、有无上边界等)[10]。GEV分布位置、尺度和形状参数决定了曲线的形状。
中国长江以南地区热带气旋降水量占夏季降水量的比重可达 10%以上,7、8月份东南沿海地区的热带气旋降水量最大可达100 mm以上,达到当月总降水量的40%[11]。研究热带气旋对中国沿海区域极端降水极值分布函数上尾部特征的影响,有助于科学制定更可靠的城市防洪排涝、水利设施等设计标准。综上所述,本文拟在以上研究基础上重点关注以下3个科学问题:① 中国年和季节极端降水一致性检测(是否具有变异或显著时间趋势);② 中国年和季节极端降水分布函数上尾部特征;③ 中国沿海地区年极端降水极值分布函数上尾部受热带气旋的影响。
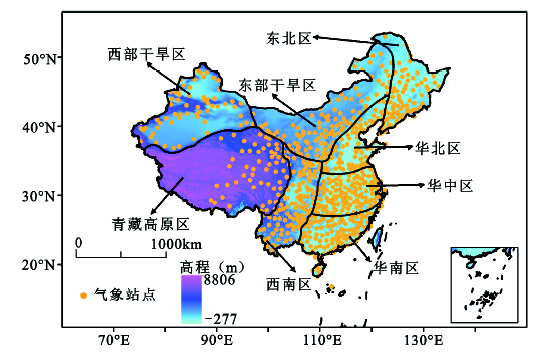
中国地域广阔,地形复杂,气候变化区域差异性较大(图1),张家诚将中国划分为8个气候区域[12]:西部干旱区、青藏高原区、东部干旱区、西南区、东北区、华北区、华中区和华南区(图1)。从中国国家气象局收集到1951~2014年中国728个站点日降水数据(不包含港澳台地区),数据累积缺测时间不超过365 d。缺测数据采用Zhang等人提出的方法进行插值[13]。从每年中全年、春季(3~5月)、夏季(6~8月)、秋季(9~11月)和冬季(12月和次年1~2月)日降水数据中选择最大1日降水量分别组成年和季节极端降水序列。另外,从中国气象局热带气旋资料中心收集到了1951年以来西北太平洋(含南海,赤道以北,180°E以西)海域热带气旋每6 h的位置和强度数据[14]。
图1 中国气象站点空间分布和地理分区
Fig.1 The distribution of meteorological stations and geographical zone in China
分段回归被广泛用于检测气象水文序列在变异点前后时间趋势方向具有显著差异的变异点位置[15]。
式中
Mann-Kendall(MK)法由于其为非参数检验方法,对异常值不敏感,从而被WMO(World Meteorological Organization,国际气象组织)推荐用来检测连续性时间序列(中国极端降水量级和发生时间)的趋势[16]。极端降水序列的自相关性对MK检测结果有一定的影响,因此采用修正的MK在检测时间趋势前对序列进行“预白化”(prewhiten)处理[16]。
GEV分布被广泛运用于气象水文学极值分析中[17,18]。GEV分布的累积概率分布函数为:
式中
识别热带气旋对极端降水影响的关键是建立一场具体的热带气旋和极端降水事件在时间上的联系。根据Villarini等的研究[19],当一场极端降水满足以下2个条件时,则被认为此次极端降水过程受到热带气旋的影响:① 降水站点位置在热带气旋中心500 km以内;② 极端降水发生时间位于热带气旋发生时间前后1 d范围之内。
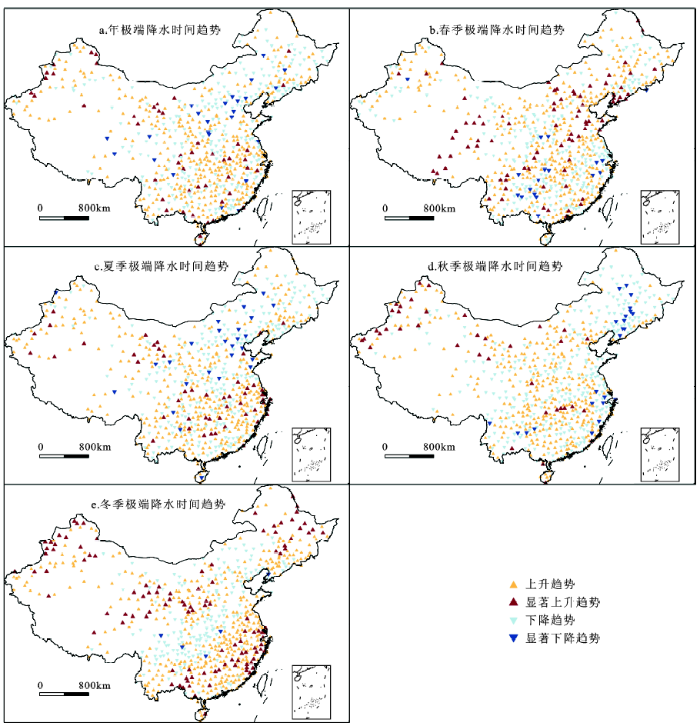
本文采用分段回归分析了极端降水序列是否有变异点(图略),采用修正MK分析了极端降水序列是否具有显著时间趋势(图2)。年和季节极端降水出现变异的站点较少。全年、春季、夏季、秋季和冬季极端降水具有变异的站点数分别为19个、8个、16个、14个和29个。年及季节大部分站点变异时间位于1990年以前,这可能跟1980年代观测标准发生变化有关,也可能跟站点位置迁移、台站周围环境发生了很大变化有关[20]。
图2 中国年和季节极端降水不具有变异点的站点时间趋势
Fig.2 Spatial distribution of trends in annual and seasonal extreme precipitation without change points
变异点对水文序列的时间趋势方向和程度具有显著的影响[21]。同时,年和季节极端降水序列具有变异点的站点数较少,因此采用修正MK法去检测无变异点站点的时间趋势(图2)。尽管年和各季节极端降水时间趋势的空间格局不同,但是大部分站点呈上升或显著上升趋势。年和夏季在海河流域、春季在西南部和东部沿海区域、秋季在东北部和东部沿海区域、冬季在中部,极端降水呈下降或显著下降趋势。春季、秋季和冬季极端降水呈显著上升趋势的站点分别明显集中在青藏高原区域和海河流域、新疆西部及东北部、中北部、新疆北部和东部沿海区域。年及春季、夏季、秋季和冬季具有显著上升趋势的站点数分别为48个、82个、51个、38个和111个,具有显著下降趋势的站点分别为24个、18个、26个、23个和5个。冬季极端降水呈显著上升趋势的站点数量明显高于其他季节。除了冬季,其他季节具有显著趋势变化的站点数量占总站点728的比例均不到10%。
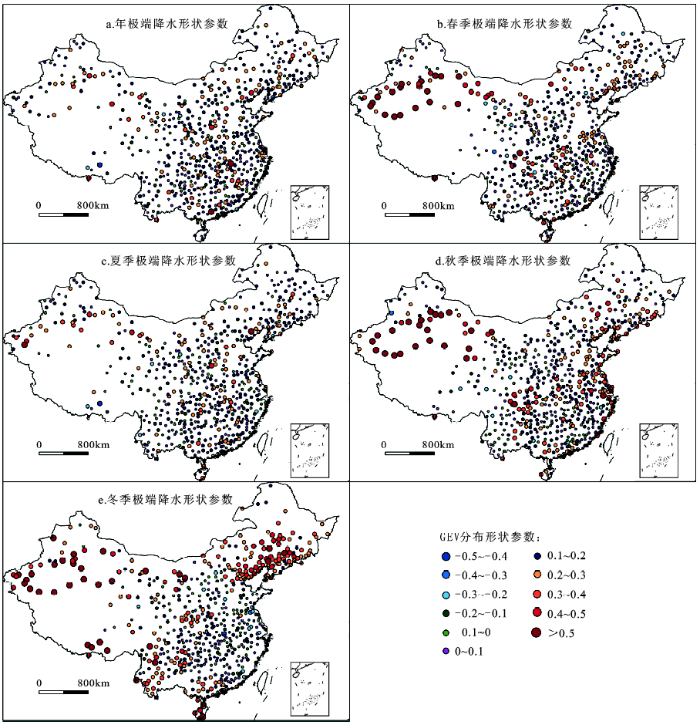
在分析GEV分布函数形状参数空间分布时,仅考虑具有一致性(无突变点和显著时间趋势)特征且通过Kolmogorov-Smirnov’s statistic D拟合优度检验的站点(图3)。全国大部分地区年和各季节极端降水形状参数大于0,表明极端降水极值分布曲线上尾部没有上边界。年和夏季极端降水形状参数空间分布较为一致,多位于0~0.2之间,年极端降水形状参数大于0.2的站点共有125个,大于0.33的站点共有23个。春季和秋季极端降水形状参数相比年和夏季更大,且中国北方的春季和秋季降水形状参数高于南方,大于0.2的站点分别有170和196个,大于0.33的站点分别有48个和83个。冬季极端降水形状参数大于0的区域是年和各季节中最高的,主要集中在中国东北方和西方,大于0.2的站点有267个,大于0.33的站点有122个;然而华中区东部和华南区东部冬季极端降水参数小于0,表明上述区域极值分布函数上尾部具有上边界
图3 中国各季节具有一致性站点极端降水GEV分布形状参数空间分布
Fig.3 Spatial distribution of shape parameter of GEV distribution for seasonal precipitation extremes with stationarity across China
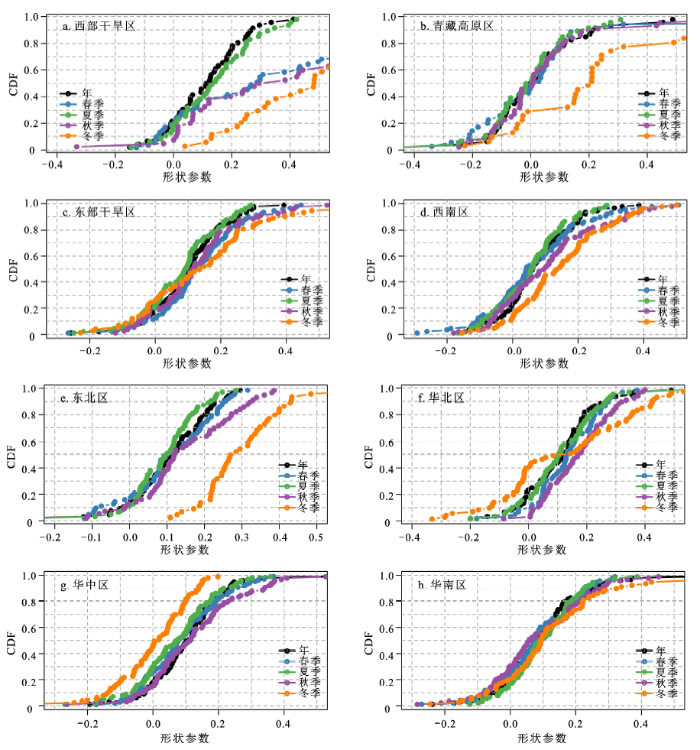
基于形状参数的空间分布(图3),需要进一步查明年极端降水的上尾部呈现的厚尾特征(形状参数大于0)能否用混合分布来解释(图4)。各季节极端降水用来近似代表不同的降水产生机制。各个分区累积分布函数为0.5时对应的年和各季节形状参数均大于0,表示超过一半的站点极值分布函数上尾部具有厚尾性质,尤其各分区(除华中区)冬季极端降水明显比年和其他季节厚尾性质更加显著。从各分区来看,年和夏季极端降水经验累积概率分布函数均保持较高的相似性,表明夏季降水机制是年极端降水极值分布函数的上尾部厚尾特征重要来源;东部干旱区、华北区和华南区年和各季节形状参数经验累积概率分布函数差异较小(图4c、f、s),表明不同季节极端降水产生机制的混合可能是潜在的方式解释年极端降水极值分布函数上尾部的厚尾性质及无边界特征;青藏高原区、西南区和东北区年和春季、夏季及秋季形状参数累计概率分布差异较小,冬季形状参数累计概率分布明显高于年和其他季节(图4b、d、e),表明年极端降水极值分布函数性质主要受到春季、夏季和秋季的混合影响。西部干旱区年和夏季极端降水形状参数经验累积概率分布函数极为相似,且明显低于其他各季节,表明西部干旱区年极端降水极值分布函数的上尾部厚尾特征主要受夏季极端降水产生机制的影响,几乎不受其他季节的干扰。华中区冬季形状参数明显低于年和其他季节,且年和其他季节形状参数累计概率分布函数均保持较高的相似性,因此华中区年极端降水极值分布函数上尾部厚尾性质和无边界特征主要来源于四季降水机制的混合,相较其他各区,冬季降水机制是非常重要的补充来源。
图4 中国年和季节一致性站点极端降水形状参数经验累计概率分布函数(CDF)
Fig.4 Empirical cumulative probability distributions for the shape parameter of GEV distribution for annual and seasonal extreme precipitation
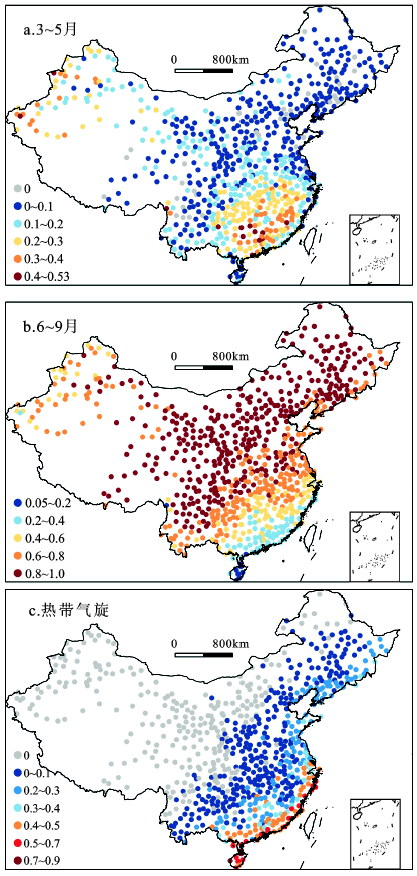
中国年极端降水产生机制比较复杂,主要集中在春、夏两季,其中中国沿海区域还受到热带气旋的重要影响。因此,将年极端降水根据不同的形成机制划分为3类:发生在春季(3~5月)、发生于暖季(6~9月)和由热带气旋引发的。春季和暖季发生的极端降水不包含由热带气旋引发的。中国东南部和新疆西部及南部年极端降水发生在春季的比例较高,大部分站点比例在30%以上(图5a)。春季温带系统与东南部极端降水的发生有密切关系,有序强烈的对流天气系统常常诱发暴雨和恶劣气候。年极端降水发生在夏季的比例由东南向西北和东北两个方向均在逐步增加。中国东北、中部和西南年极端降水发生在暖季的比例达到80%以上,几乎集中了所有最大量级的极端降水(图5b)。这些区域极端降水大多由夏季剧烈对流天气或雷暴系统引发,并且具有很大的量级,例如北京“7.21暴雨”事件。东部和南部沿海区域发生在暖季的相当一部分比例年极端降水与热带气旋相关。热带气旋引发的年极端降水比例具有明显的空间异质性。东南沿海区域,超过30%的年极端降水由热带气旋引发;在东部沿海区域,这一比例降低到10%~30%。在往内陆深入时,这一比例降低到不足10%,其原因在于热带气旋也逐步向温带系统转换,减小其对降水产生的影响。
图5 年极端降水分别在3~5月(a)、6~9月(b)和由热带气旋诱发(c)的比例
Fig.5 Percentage of annual extreme precipitation in March- May(a), June-September(b) and caused by tropical cyclone(c)
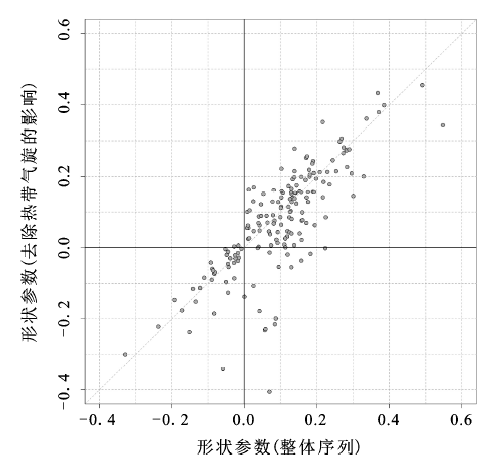
热带气旋与年极端降水的联系必然对极值分布函数的尾部特征有重要的影响。选择年极端降水受热带气旋影响比例在10%以上且满足一致性的站点,分别计算整体序列和去除受到热带气旋影响的序列的GEV分布形状参数(图6)。去除热带气旋影响后,年极端降水极值分布函数形状参数明显减小,极值分布曲线由厚尾趋向于薄尾。进一步分析对极值分布函数尾部特征有重要影响的最大10场降水由热带气旋引发的比例(图略)。东南沿海地区最大10场极端降水由热带气旋引发的比例达到60%以上。东部沿海区域也有至少30%的最大10场极端降水与热带气旋相关。从沿海到内陆,最大10场极端降水由热带气旋引发的比例逐步下降,这与图5热带气旋引发的极端降水比例是吻合的。
图6 热带气旋对沿海区域一致性站点极端降水GEV分布尾部性质的影响
Fig.6 Plot of the shape parameters from the entire series versus the series after removing the extremes caused by tropical cyclones
不同的气象学、水文学及气候学机制(例如热带气旋、中尺度系统、雷暴系统、锋区通道、急流、海洋表面温度异常、季风等)均能带来大量水汽,引起极端降水发生[22]。中尺度系统往往孕育极端强降水过程,例如2012年北京“7.21”暴雨事件[23]。雷暴系统往往伴随着暴雨事件,并且在中国西南及东南地区呈高发态势[24]。东亚季风对中国气候与环境也有重要的影响,夏季风强度和范围在很大程度上决定着东部地区旱涝分布[25]。高空急流则对东亚季风有重要影响,进而影响中国局部区域暴雨生成[26]。海洋表面温度异常通过海洋-大气动态耦合作用,影响水汽输送,在大尺度长时期上影响中国各区域降水过程[27]。东南沿海区域大量级极端降水过程往往由热带气旋带来的大量水汽诱发。影响极端降水过程的多种机制之间,彼此还相互作用、相互影响及相互调节,例如海洋表面温度异常不仅影响季风变化还影响热带气旋的生成及移动路径。因此定量剖析各个气候系统对极端降水的影响,目前还是一个较大的挑战。
本文基于全国728个气象站点1951~2014年日降水和热带气旋资料,分析年和季节极端降水极值分布函数时空特征,可以得出以下有意义的结论:
1) 年和季节极端降水存在变异点的站点均较少,且没有很强的空间集聚特征。变异点出现的原因有可能是站点观测标准不统一、位置迁移或者周围环境变化。
2) 虽然冬季极端降水达到显著时间趋势的站点明显高于其他季节,但是年和其他季节极端降水具有变异点或显著时间趋势的站点总数占总站点728的比例不足10%。
3) 中国大部分区域年和季节极端降水极值分布曲线上尾部均倾向于表现出厚尾特征且不具有上边界,总体来看北方的厚尾特征重于南方,秋季和冬季明显高于年和夏季。夏季极端降水是年极端降水厚尾特征的重要来源,除西部干旱区外,其他分区年极端降水厚尾特征还受其他季节降水机制的混合影响,尤其表现在华南区。
4) 中国东南方年极端降水多发生在春季(3~5月),而北方几乎全集中在夏季(6~9月)。热带气旋对中国沿海区域年极端降水有着重要的影响,其影响比例由沿海到内陆逐步递减,且具有较大的空间异质性。热带气旋引发的极端降水往往量级很大,东南沿海地区最大10场极端降水由热带气旋引发的比例达到60%以上。去掉热带气旋引发的极端降水,年极端降水GEV分布的形状参数趋向于减小。
The authors have declared that no competing interests exist.
| [1] |
Constraints on future changes in climate and the hydrologic cycle [J].https://doi.org/10.1038/nature01092 URL PMID: 12226677 [本文引用: 1] 摘要
Abstract What can we say about changes in the hydrologic cycle on 50-year timescales when we cannot predict rainfall next week? Eventually, perhaps, a great deal: the overall climate response to increasing atmospheric concentrations of greenhouse gases may prove much simpler and more predictable than the chaos of short-term weather. Quantifying the diversity of possible responses is essential for any objective, probability-based climate forecast, and this task will require a new generation of climate modelling experiments, systematically exploring the range of model behaviour that is consistent with observations. It will be substantially harder to quantify the range of possible changes in the hydrologic cycle than in global-mean temperature, both because the observations are less complete and because the physical constraints are weaker.
|
| [2] |
Changing spatiotemporal patterns of extreme precipitation regimes in China during 2071-2100 based on earth system models [J].https://doi.org/10.1002/2013JD020300 URL [本文引用: 1] 摘要
of five Earth System Models (ESMs) under historical and Representative Concentration Pathways (RCPs) scenarios from the Coupled Model Intercomparison Project phase 5 multimodel data set, as well as daily precipitation from 527 rain gauge stations in China for the period of 1960-2005 are used to investigate the spatiotemporal variations of precipitation extremes over China for 2071-2100. After the evaluation of the indices by the Mann-Whitney U test and the quantile-quantile plot, the weather generator model (WGEN) is used to downscale precipitation extremes. The average of precipitation extremes and values of the 5 and 20 year return periods under RCP26 and RCP85 scenarios are analyzed. Results showed the following: (1) WGEN works well in downscaling extreme heavy precipitation indices and consecutive dry days. (2) The risks of meteorological droughts and floods resulting from extreme long-duration precipitation would decrease in southwest China, but the risks of floods due to extreme heavy precipitation would increase. In north and southeast China, the risks of droughts would decrease, but floods might occur with higher frequencies; (3) The spatiotemporal variations of averages and values of 5 year return period extreme precipitation would be similar, but those of 20 year return period would be a little different: The 20 year consecutive dry days would decrease faster, and the 20 year values of other indices would increase relatively slower. (4) The spatial patterns of changes in precipitation extremes under RCP26 and RCP85 would be similar, but the changes in RCP85 would be intensifying.
|
| [3] |
中国极端降水事件时空特征及其对夏季温度响应 [J].https://doi.org/10.11821/dlxb201605002 URL [本文引用: 1] 摘要
Daily precipitation and temperature data at 728 stations covering a period of 1951 to 2014 across China were analyzed to investigate extreme precipitation regimes in terms of spatiotemporal patterns, precipitation magnitude, precipitation frequency, occurrence timing, non-stationarity of extreme precipitation regimes and also their responses to summer temperature changes. The methods adopted in this study are Peak over Threshold (POT) sampling technique, change point analysis, trend analysis and piecewise regression method. Results of this study indicated that magnitude of extreme precipitation events was subject to evident alterations but free of significant trends. However, occurrence rates of extreme precipitation were subject to adverse changing properties when compared to changes in magnitude of extreme precipitation. The entire China was dominated by apparent increase of occurrence rates of extreme precipitation. Besides, change points within magnitude and occurrence rates of extreme precipitation tended to modify the changing tendency therein. However, occurrence timing of extreme precipitation events seemed to be free of impacts from change points. In most regions of China, occurrence time of extreme precipitation events was delayed and no changes in occurrence time of extreme precipitation could be observed in other regions of China.
Spatiotemporal patterns of extreme precipitation with their responses to summer temperature .https://doi.org/10.11821/dlxb201605002 URL [本文引用: 1] 摘要
Daily precipitation and temperature data at 728 stations covering a period of 1951 to 2014 across China were analyzed to investigate extreme precipitation regimes in terms of spatiotemporal patterns, precipitation magnitude, precipitation frequency, occurrence timing, non-stationarity of extreme precipitation regimes and also their responses to summer temperature changes. The methods adopted in this study are Peak over Threshold (POT) sampling technique, change point analysis, trend analysis and piecewise regression method. Results of this study indicated that magnitude of extreme precipitation events was subject to evident alterations but free of significant trends. However, occurrence rates of extreme precipitation were subject to adverse changing properties when compared to changes in magnitude of extreme precipitation. The entire China was dominated by apparent increase of occurrence rates of extreme precipitation. Besides, change points within magnitude and occurrence rates of extreme precipitation tended to modify the changing tendency therein. However, occurrence timing of extreme precipitation events seemed to be free of impacts from change points. In most regions of China, occurrence time of extreme precipitation events was delayed and no changes in occurrence time of extreme precipitation could be observed in other regions of China.
|
| [4] |
Spatial-temporal precipitation changes (1956-2000) and their implications for agriculture in China [J].https://doi.org/10.1016/j.gloplacha.2011.12.001 URL [本文引用: 1] 摘要
Global warming is believed to be accelerating the hydrological cycle and hence altering the spatial and temporal patterns of precipitation changes. This study investigates precipitation changes in both time and space and also the spatial distribution of natural hazards and irrigation areas, and implications for agricultural development in China. Results indicate that: (1) decreasing precipitation is prevailing in spring and autumn and winter is dominated by increasing precipitation. Seasonal shifts in precipitation may pose new challenges for water resource management and for agriculture production in China; (2) spatial distribution of natural hazards and hazard-induced loss of crops is in agreement with spatial patterns of precipitation changes. Generally, northwestern, northern and northeastern parts of China are influenced by droughts; whereas eastern and southeastern parts are prone to floods; and (3) the spatial distribution of irrigation areas and irrigation requirements are in line with that of precipitation changes, implying critical impacts of precipitation changes on agriculture. Current irrigation practices are inefficient and wasteful. Therefore, water-saving agriculture and water-saving agricultural technologies are required for sustainable agricultural development.
|
| [5] |
基于Copula函数的新疆极端降水概率时空变化特征 [J].Spatial variability of probability distribution of extreme precipitation in Xinjiang . |
| [6] |
近50年来淮河流域极端降水的时空变化及统计特征 [J].https://doi.org/10.11821/xb201109005 URL [本文引用: 2] 摘要
以淮河流域27个气象站点1960-2009年逐日降水观测资料为基础,选取年最大降水量序列(AM)和超门限峰值序列(POT),分析淮河流域年极端降水事件的时空变化趋势,研究淮河流域降水极值的统计特征。研究发现:过去50年,淮河流域大多数站点年最大日降水量有增加的趋势,少数站点有减少的趋势,但增加和减少的趋势均不明显。从单个气象站点50年降水序列来看,年最大日降水事件发生的时间大多集中于20世纪60-70年代,且以汛期居多。利用L-矩法、K-S检验等方法,发现GEV和GP分布分别能够较好的拟合AM和POT序列。通过计算比较在不同重现期水平下的降水量,发现POT序列及其对应的GP分布能够更好的模拟淮河流域极端降水序列。
The trend analysis and statistical distribution of extreme rainfall events in the Huaihe River Basin in the past 50 years .https://doi.org/10.11821/xb201109005 URL [本文引用: 2] 摘要
以淮河流域27个气象站点1960-2009年逐日降水观测资料为基础,选取年最大降水量序列(AM)和超门限峰值序列(POT),分析淮河流域年极端降水事件的时空变化趋势,研究淮河流域降水极值的统计特征。研究发现:过去50年,淮河流域大多数站点年最大日降水量有增加的趋势,少数站点有减少的趋势,但增加和减少的趋势均不明显。从单个气象站点50年降水序列来看,年最大日降水事件发生的时间大多集中于20世纪60-70年代,且以汛期居多。利用L-矩法、K-S检验等方法,发现GEV和GP分布分别能够较好的拟合AM和POT序列。通过计算比较在不同重现期水平下的降水量,发现POT序列及其对应的GP分布能够更好的模拟淮河流域极端降水序列。
|
| [7] |
考虑水文趋势影响的珠江流域非一致性洪水风险分析 [J].https://doi.org/10.11821/dlyj201409009 URL Magsci [本文引用: 1] 摘要
本文基于两参数对数正态分布和指数趋势模型建立了非一致性洪水频率计算模型,分析了珠江流域28个测站年最大日流量序列趋势性对洪水频率分析的影响。结果表明:(1)从空间分布来看,珠江流域中北部年最大日流量序列呈增加趋势,东部和南部年最大日流量序列呈减小趋势;从时间变化来看,1981-2010年年最大日流量呈显著性增加趋势的站点数较多,占总站点数的20-25%,1966-1990年年最大日流量呈显著性减小趋势的站点数较多,占总站数的25-30%;(2)珠江流域洪水放大因子(未来T年一遇设计流量与现在T年一遇设计流量比值)和重现期都受到趋势性的显著影响。西江中北部和北江洪水放大因子大于1,意味着原有的防洪工程设计标准可能无法满足未来防洪需求,存在防洪隐患;洪水放大因子较大和较小的地区集中在西江干流和东江干流;(3)非一致性条件下,同一场洪水过去、现在和未来重现期是不同的。非平稳性条件下,珠江流域近20年来20-50年一遇洪水发生站次相比平稳性条件下在减小。
Non-stationary flood risk analysis in Pearl River Basin, considering the impact of hydrological trends .https://doi.org/10.11821/dlyj201409009 URL Magsci [本文引用: 1] 摘要
本文基于两参数对数正态分布和指数趋势模型建立了非一致性洪水频率计算模型,分析了珠江流域28个测站年最大日流量序列趋势性对洪水频率分析的影响。结果表明:(1)从空间分布来看,珠江流域中北部年最大日流量序列呈增加趋势,东部和南部年最大日流量序列呈减小趋势;从时间变化来看,1981-2010年年最大日流量呈显著性增加趋势的站点数较多,占总站点数的20-25%,1966-1990年年最大日流量呈显著性减小趋势的站点数较多,占总站数的25-30%;(2)珠江流域洪水放大因子(未来T年一遇设计流量与现在T年一遇设计流量比值)和重现期都受到趋势性的显著影响。西江中北部和北江洪水放大因子大于1,意味着原有的防洪工程设计标准可能无法满足未来防洪需求,存在防洪隐患;洪水放大因子较大和较小的地区集中在西江干流和东江干流;(3)非一致性条件下,同一场洪水过去、现在和未来重现期是不同的。非平稳性条件下,珠江流域近20年来20-50年一遇洪水发生站次相比平稳性条件下在减小。
|
| [8] |
气候变化与人类活动联合影响下东江流域非一致性洪水频率 [J].Nonstationary flood frequency analysis considering the combined effects of climate change and human activities in the East River Basin . |
| [9] |
Handbook of hydrology [M]. |
| [10] |
An introduction to statistical modeling of extreme Values [M]. |
| [11] |
近海热带气旋对中国东部夏季降水的贡献 [J].https://doi.org/10.7498/aps.62.189201 Magsci [本文引用: 1] 摘要
目前汛期预测主要针对季风系统形成的降水, 而对台风等热带系统的影响并未考虑, 其主要原因是台风是一个剧烈的天气尺度过程, 与短期气候预测尺度并不匹配, 因而无法进行考虑. 这也成为提升汛期预测技巧的一个制约因素. 针对这样的问题, 本文从气候的角度, 提出一个能较为客观地衡量台风对夏季降水影响强弱的指数——台风影响指数. 利用1960年–2011年中国东部站点降水资料, 及中国气象局上海台风所整理的热带气旋资料, 从月、季尺度对中国夏季台风影响强弱变化特征进行分析, 探讨台风对东部地区夏季降水的贡献. 结果表明: 1)台风从6月至8月呈增强的趋势, 6月份最弱, 7 月份居中, 8月份最强; 2) 从台风降水及占总降水的比例分布来看, 纬向呈东部高西部低, 经向呈从东北地区至华南地区依次增大的趋势, 长江以南地区台风降水量占夏季降水量的比重可达10%以上, 7, 8月份东南沿海地区的台风降水量最大可达100 mm以上, 可达当月总降水量的40%; 3)台风影响指数与夏季降水的相关表明, 台风对中国东部降水的影响具有时、空差异性, 6月份与华南地区呈负相关, 7 月份与东南沿海地区呈正相关, 而与长江中下游地区呈负相关; 8月份与华南、华北地区呈正相关、与长江中下游地区呈负相关. 这主要是由台风、夏季风和西北太平洋副热带高压共同影响的.
Contribution of typhoon over coastal waters to summer rainfall in eastern China .https://doi.org/10.7498/aps.62.189201 Magsci [本文引用: 1] 摘要
目前汛期预测主要针对季风系统形成的降水, 而对台风等热带系统的影响并未考虑, 其主要原因是台风是一个剧烈的天气尺度过程, 与短期气候预测尺度并不匹配, 因而无法进行考虑. 这也成为提升汛期预测技巧的一个制约因素. 针对这样的问题, 本文从气候的角度, 提出一个能较为客观地衡量台风对夏季降水影响强弱的指数——台风影响指数. 利用1960年–2011年中国东部站点降水资料, 及中国气象局上海台风所整理的热带气旋资料, 从月、季尺度对中国夏季台风影响强弱变化特征进行分析, 探讨台风对东部地区夏季降水的贡献. 结果表明: 1)台风从6月至8月呈增强的趋势, 6月份最弱, 7 月份居中, 8月份最强; 2) 从台风降水及占总降水的比例分布来看, 纬向呈东部高西部低, 经向呈从东北地区至华南地区依次增大的趋势, 长江以南地区台风降水量占夏季降水量的比重可达10%以上, 7, 8月份东南沿海地区的台风降水量最大可达100 mm以上, 可达当月总降水量的40%; 3)台风影响指数与夏季降水的相关表明, 台风对中国东部降水的影响具有时、空差异性, 6月份与华南地区呈负相关, 7 月份与东南沿海地区呈正相关, 而与长江中下游地区呈负相关; 8月份与华南、华北地区呈正相关、与长江中下游地区呈负相关. 这主要是由台风、夏季风和西北太平洋副热带高压共同影响的.
|
| [12] |
|
| [13] |
Spatio-temporal relations between temperature and precipitation regimes: implications for temperature-induced changes in the hydrological cycle [M]. |
| [14] |
An overview of the China meteorological administration tropical cyclone database [J].https://doi.org/10.1175/JTECH-D-12-00119.1 URL Magsci [本文引用: 1] 摘要
The China Meteorological Administration (CMA)'s tropical cyclone (TC) database includes not only the best-track dataset but also TC-induced wind and precipitation data. This article summarizes the characteristics and key technical details of the CMA TC database. In addition to the best-track data, other phenomena that occurred with the TCs are also recorded in the dataset, such as the subcenters, extratropical transitions, outer-range severe winds associated with TCs over the South China Sea, and coastal severe winds associated with TCs landfalling in China. These data provide additional information for researchers. The TC-induced wind and precipitation data, which map the distribution of severe wind and rainfall, are also helpful for investigating the impacts of TCs. The study also considers the changing reliability of the various data sources used since the database was created and the potential causes of temporal and spatial inhomogeneities within the datasets. Because of the greater number of observations available for analysis, the CMA TC database is likely to be more accurate and complete over the offshore and land areas of China than over the open ocean. Temporal inhomogeneities were induced primarily by changes to the nature and quality of the input data, such as the development of a weather observation network in China and the use of satellite image analysis to replace the original aircraft reconnaissance data. Furthermore, technical and factitious changes, such as to the wind-pressure relationship and the satellite-derived current intensity (CI) number-intensity conversion, also led to inhomogeneities within the datasets.
|
| [15] |
Piecewise regression: A tool for identifying ecological thresholds [J].https://doi.org/10.1890/02-0472 URL [本文引用: 1] 摘要
We demonstrate the use of piecewise regression as a statistical technique to model ecological thresholds. Recommended procedures for analysis are illustrated with a case study examining the width of edge effects in two understory plant communities. Piecewise regression models are "broken-stick" models, where two or more lines are joined at unknown points, called "breakpoints." Breakpoints can be used as estimates of thresholds and are used here to determine the width of edge effects. We compare a sharp-transition model with three models incorporating smooth transitions: the hyperbolic-tangent, benthyperbola, and bent-cable models. We also calculate three types of confidence intervals for the breakpoint estimate: an interval based on the computed standard error of the estimate from the fitting procedure, an empirical bootstrap confidence interval, and a confidence interval derived from an inverted F test. We recommend use of the inverted F test confidence interval when sample sizes are large, and cautious use of bootstrapped confidence intervals when sample sizes are smaller. Our analysis demonstrates the need for a careful study of the likelihood surface when fitting and interpreting the results from piecewise-regression models.
|
| [16] |
1956-2000年中国地表水资源状况:变化特征,成因及影响 [J].Water resources in China from1956 to 2000:changingproperties,causes and implications . |
| [17] |
变化环境下1951-2015年珠江流域洪水频率变化特征,成因及影响研究 [J].Characteristics,causes and impacts of the changes of the flood frequency in the Pearl River drainage basin from 1951 to 2010 . |
| [18] |
基于GEVcdn模型的珠江流域非一致性洪水频率分析 [J].
基于GEVcdn模型(generalized extreme value conditional density network)构建了珠江流域非一致性洪水频率模型。结果表明:多数站点呈非一致性变化特征,主要分布在西江和东江;在某些传统洪涝灾害易发区域,洪水极值序列呈上升趋势,将面临更加严峻的防洪风险。珠江流域洪水集中发生在两个时段,即1960年代和1990年代中期以后;基于非一致性算法的重现期体现出与一致性算法重现期的明显区别;珠江流域主要堤围基于非一致性算法的失败风险明显高于一致性条件下的失败风险而显示出较大的隐患。
GEVcdn-based analysis of inconsistent flood frequency of Pearl River Basin .
基于GEVcdn模型(generalized extreme value conditional density network)构建了珠江流域非一致性洪水频率模型。结果表明:多数站点呈非一致性变化特征,主要分布在西江和东江;在某些传统洪涝灾害易发区域,洪水极值序列呈上升趋势,将面临更加严峻的防洪风险。珠江流域洪水集中发生在两个时段,即1960年代和1990年代中期以后;基于非一致性算法的重现期体现出与一致性算法重现期的明显区别;珠江流域主要堤围基于非一致性算法的失败风险明显高于一致性条件下的失败风险而显示出较大的隐患。
|
| [19] |
Short communication contribution of tropical cyclones to extreme rainfall in Australia [J]. |
| [20] |
气象台站历史沿革信息及其对观测资料序列均一性影响的初步分析 [J].Preliminary analysis of the information on meteorological station historical evolution and its impacts on homogeneity of observational records . |
| [21] |
1951-2010年珠江流域洪水极值序列平稳性特征研究 [J].Evaluation on stationarity Assumption of annual maximum peak flows during 1951-2010 in the Pearl River Basin . |
| [22] |
Flood hydroclimatology [M]. |
| [23] |
2012年7月21日北京地区特大暴雨中尺度对流条件和特征初步分析 [J].Analysis on the mesoscale convective conditions and characteristics of an extreme torrential rain in Beijing on 21 July 2012 . |
| [24] |
近30年中国雷暴天气气候特征分析 [J].https://doi.org/10.7522/j.issn.1000-0534.2012.00134 URL Magsci [本文引用: 1] 摘要
<p>利用1981-2010年雷暴观测资料, 采用EOF分解和主值函数分析等方法, 对中国年平均雷暴日的时空分布特征、 年际变化及异常变化特征进行了分析。结果表明, 年平均雷暴日的地理分布可大致分为4个区域, 分别为东南高发区、 西南高发区、 东北次高区和西北低发区。年平均雷暴日的时间分布表现为夏季多、 冬季少; 一天之中雷暴出现的时间集中在下午到晚上。雷暴日数的年际变化呈现出1980年代和2000年代2个相对多发期和1990年代相对少发期, 其中2000年代雷暴事件的相对多发表现为下午和夜间雷暴事件的增加。近30年中国北方地区的雷暴整体呈现出减少趋势, 而南方则是先减后增, 其距平场的年代际变化较为明显。EOF分解后距平场第一向量的方差贡献达到32.4%, 在空间上表现为南北相异型, 其余各向量也不同程度地表现出区域性异常, 前12个向量累积方差贡献达到80.9%。此外, ENSO事件对中国雷暴尤其是南方地区影响较为明显, 两广和云贵地区呈现出相反的距平变化。</p>
Analyses on climatic characteristics of thunderstorm in China in recent 30 years .https://doi.org/10.7522/j.issn.1000-0534.2012.00134 URL Magsci [本文引用: 1] 摘要
<p>利用1981-2010年雷暴观测资料, 采用EOF分解和主值函数分析等方法, 对中国年平均雷暴日的时空分布特征、 年际变化及异常变化特征进行了分析。结果表明, 年平均雷暴日的地理分布可大致分为4个区域, 分别为东南高发区、 西南高发区、 东北次高区和西北低发区。年平均雷暴日的时间分布表现为夏季多、 冬季少; 一天之中雷暴出现的时间集中在下午到晚上。雷暴日数的年际变化呈现出1980年代和2000年代2个相对多发期和1990年代相对少发期, 其中2000年代雷暴事件的相对多发表现为下午和夜间雷暴事件的增加。近30年中国北方地区的雷暴整体呈现出减少趋势, 而南方则是先减后增, 其距平场的年代际变化较为明显。EOF分解后距平场第一向量的方差贡献达到32.4%, 在空间上表现为南北相异型, 其余各向量也不同程度地表现出区域性异常, 前12个向量累积方差贡献达到80.9%。此外, ENSO事件对中国雷暴尤其是南方地区影响较为明显, 两广和云贵地区呈现出相反的距平变化。</p>
|
| [25] |
1961~2009年中国季风区范围和季风降水变化 [J].https://doi.org/10.3878/j.issn.1006-9895.1410.14195 Magsci [本文引用: 1] 摘要
东亚季风对中国气候和环境有重要影响, 以往研究多关注于季风环流和人为给定区域内夏季降水的变化, 对于季风区域变化本身及其相伴的季风降水鲜有涉及。本文使用四套降水观测资料, 其中包括基于2416个台站最新资料所得到的中国区域高分辨率降水格点数据, 集中分析了1961~2009年中国季风区范围、季风区西北边界、季风降水及其强度变化。结果表明, 季风区约占中国陆地面积的60%, 研究时段内总体上在缩少;季风降水无趋势性变化而是表现为一定的年际和年代际变率;中国季风降水强度平均为4.46 mm d<sup>-1</sup>。季风区西北部的东、西边界间区域属于典型的干湿交错带, 季风区西北边界在40°N以南整体上表现为-0.026°/a的西进趋势, 而在其北部则表现为0.041°/a的东退, 这主要是源于区域尺度热力对比、大气环流和水汽通量的变化所致。
Monsoon area and precipitation over China for 1961-2009 .https://doi.org/10.3878/j.issn.1006-9895.1410.14195 Magsci [本文引用: 1] 摘要
东亚季风对中国气候和环境有重要影响, 以往研究多关注于季风环流和人为给定区域内夏季降水的变化, 对于季风区域变化本身及其相伴的季风降水鲜有涉及。本文使用四套降水观测资料, 其中包括基于2416个台站最新资料所得到的中国区域高分辨率降水格点数据, 集中分析了1961~2009年中国季风区范围、季风区西北边界、季风降水及其强度变化。结果表明, 季风区约占中国陆地面积的60%, 研究时段内总体上在缩少;季风降水无趋势性变化而是表现为一定的年际和年代际变率;中国季风降水强度平均为4.46 mm d<sup>-1</sup>。季风区西北部的东、西边界间区域属于典型的干湿交错带, 季风区西北边界在40°N以南整体上表现为-0.026°/a的西进趋势, 而在其北部则表现为0.041°/a的东退, 这主要是源于区域尺度热力对比、大气环流和水汽通量的变化所致。
|
| [26] |
夏季东亚高空急流的变化及其对东亚季风的影响 [J].https://doi.org/10.3878/j.issn.1006-9895.2012.12310 URL Magsci [本文引用: 1] 摘要
东亚高空急流是东亚夏季风系统的一个重要组成部分,对东亚地区的天气和气候有着重要影响。近十年来,对东亚高空的变异规律及其相关机理、急流对东亚气候的影响等方面做了大量的观测资料分析和数值模拟研究。本文从夏季东亚高空急流的变化特征及其与东亚气候的关联、东亚高空急流的变异机理以及当前的气候模式对东亚高空急流的模拟能力评估和未来预估等几个方面,对这些研究结果进行了综述。
Variability of the East Asian upper-tropospheric Jet in summer and its impacts on the East Asian Monsoon .https://doi.org/10.3878/j.issn.1006-9895.2012.12310 URL Magsci [本文引用: 1] 摘要
东亚高空急流是东亚夏季风系统的一个重要组成部分,对东亚地区的天气和气候有着重要影响。近十年来,对东亚高空的变异规律及其相关机理、急流对东亚气候的影响等方面做了大量的观测资料分析和数值模拟研究。本文从夏季东亚高空急流的变化特征及其与东亚气候的关联、东亚高空急流的变异机理以及当前的气候模式对东亚高空急流的模拟能力评估和未来预估等几个方面,对这些研究结果进行了综述。
|
| [27] |
淮河流域降水过程时空特征及其对ENSO影响的响应研究 [J].Spatial and temporal characteristics of precipitation in the Huaihe River basin and its response to ENSO events . |

/
| 〈 |
|
〉 |