徐涵秋 , 张博博
, 张博博
Xu Hanqiu, Zhang Bobo
中图分类号: TP751
文献标识码: A
文章编号: 1000-0690(2017)08-1270-07
收稿日期: 2016-08-9
修回日期: 2017-01-10
网络出版日期: 2017-08-15
版权声明: 2017 《地理科学》编辑部 本文是开放获取期刊文献,在以下情况下可以自由使用:学术研究、学术交流、科研教学等,但不允许用于商业目的.
基金资助:
作者简介:
作者简介:徐涵秋(1955-), 男, 博士,教授, 博士生导师,主要从事环境与资源遥感应用研究。E-mail: hxu@fzu.edu.cn
展开
摘要
针对林下水土流失缺乏有效判别方法的问题,提出了一种遥感判别方法。该方法以植被覆盖度、植被健康度、土壤裸露度和坡度为判别因子,采用规则法来建立林下水土流失遥感判别模型,并将其应用于福建省长汀县。结果发现,长汀县有311.66 km2的林地发生不同程度的林下水土流失,其中有13.35%的土壤侵蚀强度达到中度。通过遥感方法识别出的林下水土流失区的空间分布位置可为该县今后深入治理水土流失提供目标靶区。
关键词:
Abstract
This study proposes a new rule-based method to locate soil erosion under moderate-to high-density forest canopy using remote sensing techniques. Five factors that are closely related to the soil erosion in forest are specially selected and used as discriminators to develop the discrimination rules. The selected five factors include fractional vegetation coverage, nitrogen reflectance index, yellow leaf index, bare soil index, and slope degree. The selection of these five factors aims to detect vegetation density, vegetation health status, soil exposure degree, and terrain steepness. These five factors can all be derived from remote sensing imagery based on related thematic indices or algorithms. The proposed method was applied to the forest areas in Changting County of Fujian Province, southern China. The Hetian town of the county is one of the most typical soil loss areas in the red soil regions in southern China. A Landsat 8 OLI image acquired on October 15, 2014, in-situ measured spectral data, and nutrient data from soil samples have been used as data sources for the study. The result reveals a total area of 311.66 km2 of soil erosion in forest of the county. Of them, 13.35% is in moderate erosion intensity and the rest is in light erosion intensity. The accuracy assessment against ground truth indicates that the method can achieve an overall accuracy of 88.45%, with a Kappa coefficient of 0.731. The revealed locations of soil erosion in forest provide very useful information for Changting County to develop land management plans to further reduce soil loss in forest.
Keywords:
中国南方许多森林覆盖率较高的林区一直发生着不同程度的水土流失,这种现象也被称之为“林下水土流失”,并被民间以“远看绿油油,近看水土流”来形象地描述林下发生水土流失的这一独特现象。国内外对林下水土流失的研究主要集中在林下土壤侵蚀过程[1,2]、成因[3,4]和治理对策[5]等方面,但都没有涉及林下水土流失区的识别。在林下水土流失已成为水土流失治理亟待解决的问题的今天,准确快速地判别林下水土流失区,对南方水土流失的进一步治理具有重要的意义,研究林下水土流失区的识别技术,将有助于水土流失的深入治理。
当前,卫星遥感以其快速、宏观的优势已在各行各业得到广泛应用。因此,本研究以福建省长汀县为研究区域,利用卫星影像开展林下水土流失区的遥感识别研究。通过建立判别因子和规则,开发出针对林下水土流失区的遥感判别技术,实现此类特殊水土流失区域的计算机自动识别,所形成的遥感快速监测新技术可为南方林下水土流失区的深入治理提供技术支撑。
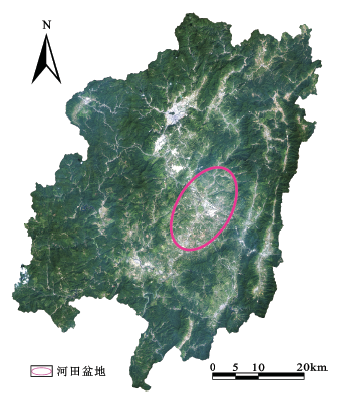
长汀县地处福建西部,其地理位置为25°18′40″N~26°02′05″N,116°00′45″E~116°39′20″E,面积3 099 km2。属于亚热带季风气候,年平均气温18.3℃,年降水量1 500~1 700 mm。中低山丘陵地貌,最高海拔为1 459 m。从2014年10月的卫星影像来看,长汀全县基本为绿色森林覆盖,但中部地区植被偏少,在影像上颜色偏白,该区即为长汀县重点水土流失区——河田盆地(图1)。
图1 长汀县2014-10-15 Landsat 8卫星影像
Fig.1 Landsat 8 image of Changting County (10-15-2014)
长汀县曾经是中国南方红壤地区最严重的水土流失区,经过30多年的治理,长汀县的水土流失情况得到了明显改善 [6,7]。在许多经过治理的地区,虽然树木已经成林,但林下缺少灌草,土壤裸露程度很高,仍然发生着不同程度的水土流失。
实验采用的主要数据为遥感影像,但为了使所建的林下水土流失判别模型更准确,特别对植被的反射光谱进行了现场实测,并采集了土壤样本,以测定土壤中的主要养分。在此基础上,确定出5个林下水土流失判别因子,并据此建立判别规则,构建林下水土流失判别模型。
1.3.1 遥感数据
根据影像的可获取性和质量,本次实验选用2014年10月15日的Landsat 8卫星影像作为遥感数据源。长汀的森林以常绿林占主导,所选的影像日期也在当地二季水稻( Oryza sativa)收割之前,因此满足研究的植被季相要求。影像下载于美国地质调查局(USGS)网站。大气校正采用Landsat影像使用的标准化流程[8,9],根据Landsat 8用户手册[10]和COST模型[11]将影像的灰度值转换为传感器处反射率。
1.3.2 植被光谱实测数据
由于马尾松(Pinus massoniana)具有抗干旱、耐贫瘠、栽植简单、成活率高的优点,在南方水土流失治理过程中,马尾松几乎成了荒山造林的唯一选择,它也因此成为林下水土流失的主要发生区。本次研究采用ASD FieldSpc®光谱仪在长汀现场实测了不同健康状态的马尾松林的光谱信息。
1.3.3 土壤分析数据
当土壤中的养分改变,特别是与植物生长发育密切相关的氮含量的改变时,将明显影响植物的健康。为此,对不同健康植被样区的土壤进行采样,并测定对植被生长发育影响较大的2个因子:土壤全氮和碱解氮含量。
1.4.1 判别因子选择
在水利部2008年颁布的《土壤侵蚀分级分类标准》(以下简称《标准》)中,衡量土壤面状侵蚀强度采用的是植被覆盖度和坡度这2个指标,但这2个因子只适用于判别常见的土壤侵蚀类型,并不足以判别林下水土流失这种特殊的水土流失类型。因此,又引入了植被健康程度和土壤裸露度, 这是因为:① 枝繁叶茂的健康植被会对雨滴产生有效的遮挡,发生林下水土流失的可能性较小,而枝叶稀疏健康状态不佳的植被则起不到遮挡雨滴的有效作用。② 经实地考察发现,发生林下水土流失的地方往往缺失林下植被,缺乏枯枝落叶层,地表裸露程度较高。
对于植被健康程度,本次研究选用了氮指数和黄叶因子来代表。氮是植物需求量最大的营养元素,是植物进行生命活动的必需元素。植被的含氮量直接影响了植被的健康程度。而黄叶是绿色植物健康程度的直观标志,在植物的生长季,大量黄叶的出现是植被不健康的重要特征[12],因此可用于判断植被的健康状况。
基于以上分析,林下水土流失区的判别因子可以由植被覆盖度、植被氮指数、植被黄叶因子、地表裸露度和坡度5个因子组成。
1.4.2 判别因子计算
1) 植被覆盖度计算:当前,常用的遥感植被覆盖度模型分别有Gutman和Ignatov[13]以及Carlson和Ripley[14]提出的模型 (分别简称Gutman和Carlson模型)。二者的公式分别为:
FVCGutman = (NDVI - NDVImin) / (NDVImax- NDVImin) (1)
FVCCarlson = [(NDVI -NDVImin) / (NDVImax-NDVImin)]2 (2)
式中,FVC为植被覆盖度;NDVI 为归一化植被指数;NDVImin代表纯裸土的NDVI 值;NDVImax代表高植被覆盖度的NDVI 值。
为了选择合适的模型,分别用2种模型反演了长汀县2014/10/15的Landsat 8影像的植被覆盖度(图2),并采用Wu和Murray的高分影像亚像元对比法[15]对其进行验证(验证影像采用的是2014/12/20的Google Earth高分影像)。Carlson模型与Gutman模型的本质区别在于是否对FVC求平方。求过平方的模型计算出的FVC值会明显降低,有可能造成低估,但未求平方的FVC则有可能造成高估[16]。验证表明:Gutman模型确实在中低植被覆盖区有一定程度的高估,但其散点分布比Carlson模型更接近1:1线。而Carlson模型则表现为明显的低估,其散点分布远在1:1线上方。经计算,Gutman模型的均方根误差(RMSE)为4.63,远小于Carlson模型的18.42。因此,本次研究选用Gutman模型来反演植被覆盖度。
图2 Gutman模型和Carlson模型的精度比较
Fig.2 Accuracy comparison between Gutman and Carlson models
2) 植被氮指数反演:目前,遥感宽波段的植被氮指数主要有Brauch的氮反射指数(Nitrogen Reflectance Index,NRI)[17]和谭昌伟的作物氮反射
指数(NRIP)[18],它们的公式分别为:
NRI = NIR / Green (3)
NRIP = Green / Red (4)
式中,Green、Red和NIR分别代表绿光、红光和近红外波段的反射率。
为了考察以上指数在长汀的适用性,对实测的长汀县不同健康程度马尾松的光谱曲线特征进行了分析(图3),结果发现,无论是在近红外波段或者绿光波段,健康植被的反射率都是最强,中等健康植被次之,而不健康植被最低。因此采用以上基于近红外波段或绿光波段构建的氮反射指数,可以突出长汀植被的健康程度。
图3 3种不同健康程度马尾松的光谱特征曲线
Fig.3 Spectral signatures of Pinus massoniana under three different health status
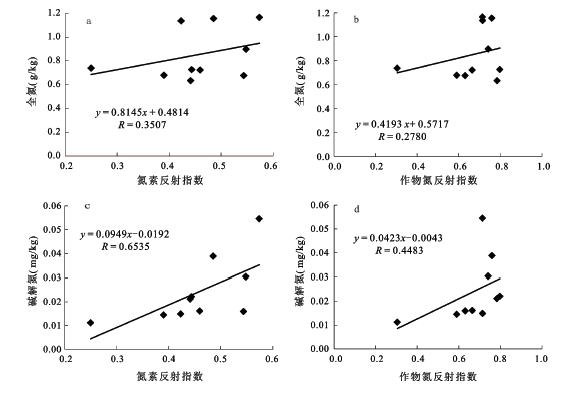
为了在NRI和NRIP这2种指数之间选择适合长汀植被的氮指数,分别反演出长汀Landsat 8影像的NRI和NRIP指数,然后与土壤实测样点的全氮、碱解氮分析结果(表1)进行回归分析(图4)。
表 1 土壤全氮/碱解氮含量
Table 1 Contents of total Nitrogen and available Nitrogen
| 样地编号 | 样地名称 | 全氮含量(g/kg) | 碱解氮含量(mg/kg) |
|---|---|---|---|
| 1 | 石壁下标准地 | 0.633 | 21.194 |
| 2 | 三洲牌楼下 | 1.136 | 14.952 |
| 3 | 路虎科技协作区 | 0.678 | 14.571 |
| 4 | 梨岭 | 1.165 | 54.625 |
| 5 | 马坑垄 | 0.676 | 16.011 |
| 6 | 乌石岽挖穴 | 0.726 | 22.182 |
| 7 | 伯湖北坑 | 0.738 | 11.271 |
| 8 | 石官凹 | 0.722 | 16.219 |
| 9 | 罗地 | 0.898 | 30.432 |
| 10 | 梁角 | 1.155 | 38.945 |
由图4可知,氮素反射指数NRI与实测土壤样品的全氮、碱解氮含量的相关度明显好于作物氮反射指数NRIP。从图3可以明显看出,3种不同健康程度植被的反射率在近红外波段表现出的差异要远比在绿色波段显著,因此采用近红外波段作分子构建的NRI指数会比采用绿光波段作分子构建的NRIP指数更容易突出氮反射强度。因此,选用NRI作为长汀植被的氮指数。
图4 林下水土流失区氮反射指数值与实测全氮含量和碱解氮含量回归分析
Fig. 4 Regression analysis of Nitrogen-index value with contents of total Nitrogen and available Nitrogen
3)黄叶因子计算:本次选用的Landsat 8影像没有黄色波段,无法直接侦测植被的黄色特征,但可以根据三原色原理[19],利用绿色和红色的混色生成黄色波段,即:
Yellow = (Green + Red) / 2 (5)
为了检验公式(5)的有效性,必须借助具有黄色波段的WorldView 2影像。首先将2011年12月13日长汀河田盆地的WorldView 2影像按公式(5)构建了模拟黄色波段,然后与该影像的真实黄色波段进行相关性分析,结果显示,二者的R2达到0.992,其统计特征值也非常接近(表2),这说明利用公式(5)可以有效地模拟黄色波段。
表2 基于WorldView 2影像的黄色波段与模拟黄色波段的统计特征对比
Table 2 Comparison between simulated and actual yellow bands based on WorldView 2 imagery
| 最小值 | 最大值 | 均值 | 标准差 | R2 | |
|---|---|---|---|---|---|
| 黄色波段 | 0.001 | 0.721 | 0.055 | 0.034 | 0.992 |
| 模拟黄色波段 | 0.003 | 0.766 | 0.054 | 0.032 |
4) 裸露度反演:林下水土流失区因林下植被稀疏、缺乏枯枝落叶层,造成林下土壤直接裸露,因此可引入归一化裸土指数(Normalized Difference Soil Index,NDSI) [20]加以识别:
NDSI = (MIR1–NIR) / (MIR1 + NIR) (6)
式中,MIR1为中红外1波段的反射率。
5) 坡度:当前的商用遥感软件都具有将数字高程模型(DEM)转换为坡度的功能,因此从USGS网站下载长汀县30 m分辨率的DEM数据,然后将其转换为坡度。
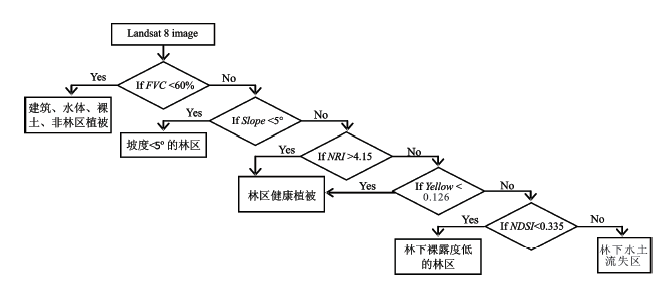
将2014年长汀县Landsat 8影像依次反演出FVC、NRI、黄叶因子(Yellow)、裸土指数(NDSI)和坡度(Slope)专题影像。由于水利部《标准》中的植被覆盖度不包含耕地,因此掩模去植被覆盖度影像中的耕地。在此基础上,为每一个因子设置分离阈值,然后采用基于规则的逐层分离法建立模型,提取出林下水土流失区。
由于植被覆盖度和坡度是《标准》中判别土壤面状侵蚀强度的2个重要指标,因此首先确定植被覆盖度的阈值。鉴于林下水土流失主要发生在林区,植被覆盖度通常很高,因此结合《标准》中的植被覆盖度分级标准,将60%植被覆盖度作为区分林区和非林区的阈值,当FVC小于60%时为非林区,不属于本文的研究范畴。《标准》将发生水土流失的起始坡度定为5º,因此选择5º作为坡度的阈值。
其它3个因子的阈值主要根据它们对应的野外林下水土流失样区的统计特征,并辅以适当的人工调试来设定。各因子的阈值为:氮指数NRI≤4.15、黄叶因子≥0.126、裸土指数NDSI≥0.335。在各因子及其相关阈值确定之后,建立规则进行特征提取是一种简便有效的方法[21]。由此,根据以上判别因子及其阈值设置规则,建立逻辑判别模型,逐层分离出林下水土流失区(图5)。
图5 林下水土流失区判别规则流程
Fig.5 Rules and thresholds used for detecting soil erosion areas under forest canopy
按照图5规则从Landsat 8影像中提取出长汀县的林下水土流失区,并于2015年11月进行实地精度验证,由长汀县水土保持局的技术人员根据历年的林下水土流失观测资料,在现场选择了52个点进行验证,结果表明模型判别精度为88.45%,Kappa系数为0.731。
对所提取的结果进行统计,发现长汀县共有林下水土流失面积311.66 km2,占林地总面积的12.5%。进一步参照《标准》中的等级划分标准,对判别出的林下水土流失区进行侵蚀强度分级。结果表明,长汀县林下水土流失侵蚀强度为轻度的面积有270.05 km2,占林下水土流失总面积的86.65%,中度的有41.61 km2,占13.35% (图6)。
图6 长汀县林下水土流失区分布(a)及河田盆地中度林下水土流失区三维分布(b)
Fig.6 Detected soil erosion areas under forest in Changting County (a) and a 3D distribution of moderate soil erosion areas underneath forest in the Hetian Basin (b)
从图6a可知,长汀县的林下水土流失区主要沿中部的河田盆地-县城一线大致呈南北向展布。这一线人类活动频繁,历来是长汀县的重点水土流失区。为了治理水土流失,当地人民在这一线种植了大量的马尾松林。由于这些水土流失区土壤贫瘠,马尾松林的健康度不高,林下植被普遍稀疏,加上人类活动频繁,因此在这些马尾松林下极易发生水土流失,需要进一步治理。而本次模型揭露的中度林下水土流失区为该县今后的水土流失深入治理提供了目标靶区(图6b)。
1) 林下水土流失与植被覆盖度、地形坡度、林下土壤裸露度以及植被健康程度有密切的关系,以它们为判别因子建立规则所构成的遥感模型可以有效地识别林下水土流失区。
2) 所建立的林下水土流失区判别技术完全基于遥感信息技术,模型中的各个判别因子都可以从遥感影像通过相关专题指数或模型获得,因此有利于该技术的推广应用。
3) 基于遥感模型的判别结果表明,长汀县林下水土流失区主要分布在河田盆地–长汀县城一线及其周边山坡的林地中,其中有13.35%的林下水土流失区属中等侵蚀强度,它们是今后长汀县深入治理林下水土流失的重点靶区。
The authors have declared that no competing interests exist.
| [1] |
红壤坡地不同树种林下水土流失特征研究 [J].
利用浙江省兰溪水土保持综合试验站不同树种的7个径流小区连续9a(1985—1997年)的监测资料,分析了不同树种林下水土流失的动态过程。结果表明:(1)在树木栽培的前2a内水土流失较为严重,前2a内水土流失除茶园地和松树林地外,占9a水土流失总量的90%以上。随着树龄的增长,林木水土保持功能增加,小区水土流失趋于减缓,部分树种林下的侵蚀产沙接近于零。(2)前2a内各林地小区水土流失强度排序为:杉树林密柑林稀柑林毛竹林混交林。林灌混交林地小区的水土保持功能最为明显。(3)茶园地在生产管理中,由于施肥和采茶等人为的干扰,水土流失没有表现出随树龄的增加而减缓的趋势,其水土流失年际间波动明显。研究表明,在培育水土保持林时,最初2a内是加强林下水土保持的重要时段,茶园地加强施肥采茶等生产过程的人为干扰更是减少水土流失的关键。
Characteristics of soil and water loss on red soil slope land under forest with different tree species. Bulletin of Soil and
利用浙江省兰溪水土保持综合试验站不同树种的7个径流小区连续9a(1985—1997年)的监测资料,分析了不同树种林下水土流失的动态过程。结果表明:(1)在树木栽培的前2a内水土流失较为严重,前2a内水土流失除茶园地和松树林地外,占9a水土流失总量的90%以上。随着树龄的增长,林木水土保持功能增加,小区水土流失趋于减缓,部分树种林下的侵蚀产沙接近于零。(2)前2a内各林地小区水土流失强度排序为:杉树林密柑林稀柑林毛竹林混交林。林灌混交林地小区的水土保持功能最为明显。(3)茶园地在生产管理中,由于施肥和采茶等人为的干扰,水土流失没有表现出随树龄的增加而减缓的趋势,其水土流失年际间波动明显。研究表明,在培育水土保持林时,最初2a内是加强林下水土保持的重要时段,茶园地加强施肥采茶等生产过程的人为干扰更是减少水土流失的关键。
|
| [2] |
南方红壤丘陵区马尾松林下水土流失过程研究 [D].Research on process of undergrowth loss the soil and water in red soil hilly region of Southern China. |
| [3] |
南方丘陵区林下水土流失特点及防治措施探讨 [J].https://doi.org/10.3969/j.issn.1002-2651.2013.03.007 URL [本文引用: 1] 摘要
南方丘陵区林地水土流失问题日渐突出,经过调研,太湖流域丘陵区的林下水土流失类型主要有两大类,一类是以生态公益林区的侵蚀劣地上种植马尾松、油茶为主的林地,另一类是以人类生产活动比较频繁的茶园、果园、竹林等商品林区为典型代表的林地。通过分类分析这两大类典型林地水土流失的自然条件与人为活动影响,得出第一类的林下水土流失主要由于历史原因加上土壤贫瘠,植被难以恢复;第二类的林下水土流失主要由于林地管护方式的差别。作者在调查太湖流域丘陵区林地产生水土流失原因的基础上,探讨相应的防治措施,并针对不同类型的林地制定对应的治理模式。
Characteristics and control measures of soil and water loss in underground forest in southern hilly region. https://doi.org/10.3969/j.issn.1002-2651.2013.03.007 URL [本文引用: 1] 摘要
南方丘陵区林地水土流失问题日渐突出,经过调研,太湖流域丘陵区的林下水土流失类型主要有两大类,一类是以生态公益林区的侵蚀劣地上种植马尾松、油茶为主的林地,另一类是以人类生产活动比较频繁的茶园、果园、竹林等商品林区为典型代表的林地。通过分类分析这两大类典型林地水土流失的自然条件与人为活动影响,得出第一类的林下水土流失主要由于历史原因加上土壤贫瘠,植被难以恢复;第二类的林下水土流失主要由于林地管护方式的差别。作者在调查太湖流域丘陵区林地产生水土流失原因的基础上,探讨相应的防治措施,并针对不同类型的林地制定对应的治理模式。
|
| [4] |
南方红壤丘陵区马尾松林下水土流失现状、成因及防治 [J].
马尾松林下水土流失已经成为南方红壤丘陵区水土流失治理一个亟待解决的问题。在分析南方红壤丘陵区马尾松林下水土流失现状及特点的基础上,从马尾松林下植被状况、人为干扰、地形、降雨侵蚀力、土壤性状等方面综合探讨了马尾松林下水土流失的成因。认为:林下植被匮乏是造成马尾松林下水土流失最主要和最直接的原因;掠夺性人为干扰是造成马尾松林下水土流失的根本原因;破碎的地形、较高的降雨侵蚀力和土壤可蚀性则为林下水土流失的发生提供了有利条件。同时总结了诸如微地形改造、林下补植、封禁保护等马尾松林下水土流失治理的成功经验,以期为今后马尾松林下水土流失治理提供参考。
Status, causes and prevention of soil and water loss in Pinus massoniana woodland in hilly red soil region of Southern China.
马尾松林下水土流失已经成为南方红壤丘陵区水土流失治理一个亟待解决的问题。在分析南方红壤丘陵区马尾松林下水土流失现状及特点的基础上,从马尾松林下植被状况、人为干扰、地形、降雨侵蚀力、土壤性状等方面综合探讨了马尾松林下水土流失的成因。认为:林下植被匮乏是造成马尾松林下水土流失最主要和最直接的原因;掠夺性人为干扰是造成马尾松林下水土流失的根本原因;破碎的地形、较高的降雨侵蚀力和土壤可蚀性则为林下水土流失的发生提供了有利条件。同时总结了诸如微地形改造、林下补植、封禁保护等马尾松林下水土流失治理的成功经验,以期为今后马尾松林下水土流失治理提供参考。
|
| [5] |
兴国县花岗岩区林下水土流失及其防治 [J].https://doi.org/10.3969/j.issn.1000-0941.2007.03.025 URL [本文引用: 1] 摘要
兴国县自1983年被列入全国八片水土保持重点治理区以来,经过20多年的综合治理,水土流失面积由1 899.07 km2下降至757.37 km2,生态环境得到了改善,但不少初步治理的山头仍存在“远看青山在,近看水土流”的林下水土流失,尤其是花岗岩区“空中绿化”严重。通过分析花岗岩区林下水土流失的成因,提出了相应的防治对策。
Soil and water loss of granite region under the trees in Xingguo County and its prevention and control. https://doi.org/10.3969/j.issn.1000-0941.2007.03.025 URL [本文引用: 1] 摘要
兴国县自1983年被列入全国八片水土保持重点治理区以来,经过20多年的综合治理,水土流失面积由1 899.07 km2下降至757.37 km2,生态环境得到了改善,但不少初步治理的山头仍存在“远看青山在,近看水土流”的林下水土流失,尤其是花岗岩区“空中绿化”严重。通过分析花岗岩区林下水土流失的成因,提出了相应的防治对策。
|
| [6] |
基于RUSLE的福建省长汀县河田盆地区土壤侵蚀定量研究 [J].https://doi.org/10.5846/stxb201205130701 URL Magsci [本文引用: 1] 摘要
以RS、GIS和RUSLE模型为主要技术,选取典型的土壤侵蚀区福建省长汀县河田盆地区为研究区,通过对模型因子的合理选择,估算了该地区1988年、1998年和2010年的土壤侵蚀量,实现土壤侵蚀状况的定量评价和动态监测。结果表明:在1988年至2010年期间,研究区土壤侵蚀状况得到明显改善, 平均土壤侵蚀模数由4259.11 t·km<sup>-2</sup>·a<sup>-1</sup>下降为1280.09 t·km<sup>-2</sup>·a<sup>-1</sup>, 年侵蚀量由252.42万t下降至75.87万t;中度及其以上侵蚀面积由176 km<sup>2</sup>减少至62.69 km<sup>2</sup>,微度侵蚀面积由225.85 km<sup>2</sup> 增加至358.9 km<sup>2</sup>。研究结果说明近22年来针对长汀河田盆地区土壤侵蚀的治理所采取的措施是卓有成效的。长汀河田盆地区水土流失进一步重点治理的区域应集中在盆地中心及其西北部等地区的高程低于400 m、植被覆盖度为20%-50%的地区。
RUSLE-based quantitative study on the soil erosion of the Hetian basin area in County Changting, Fujian Province, China. https://doi.org/10.5846/stxb201205130701 URL Magsci [本文引用: 1] 摘要
以RS、GIS和RUSLE模型为主要技术,选取典型的土壤侵蚀区福建省长汀县河田盆地区为研究区,通过对模型因子的合理选择,估算了该地区1988年、1998年和2010年的土壤侵蚀量,实现土壤侵蚀状况的定量评价和动态监测。结果表明:在1988年至2010年期间,研究区土壤侵蚀状况得到明显改善, 平均土壤侵蚀模数由4259.11 t·km<sup>-2</sup>·a<sup>-1</sup>下降为1280.09 t·km<sup>-2</sup>·a<sup>-1</sup>, 年侵蚀量由252.42万t下降至75.87万t;中度及其以上侵蚀面积由176 km<sup>2</sup>减少至62.69 km<sup>2</sup>,微度侵蚀面积由225.85 km<sup>2</sup> 增加至358.9 km<sup>2</sup>。研究结果说明近22年来针对长汀河田盆地区土壤侵蚀的治理所采取的措施是卓有成效的。长汀河田盆地区水土流失进一步重点治理的区域应集中在盆地中心及其西北部等地区的高程低于400 m、植被覆盖度为20%-50%的地区。
|
| [7] |
南方典型红壤水土流失区地表裸土动态变化分析——以福建省长汀县为例 [J].
<p>基于遥感数据和改进的双重指数法,从裸土面积、裸露强度和破碎度三方面研究了福建省长汀县1988~2010 年的地表裸土时空变化。研究表明,该县近22 a 的水土流失治理已大大减轻了地表的裸露程度,地表裸土面积从175.5 km<sup>2</sup>减少到86.6 km<sup>2</sup>;地表裸露强度从0.487 下降到0.383; 裸土破碎度从0.103 上升到0.207。在1988~1999 年和1999~2010 年的2 个时间段里,裸土面积的变化呈现逐渐减少,减速加快的趋势,客观地反映了长汀县水土流失治理的重要扶持政策所产生的积极效应。</p>
Dynamics of bare soil in a typical reddish soil loss region of Southern China: Changting County, Fujian Province.
<p>基于遥感数据和改进的双重指数法,从裸土面积、裸露强度和破碎度三方面研究了福建省长汀县1988~2010 年的地表裸土时空变化。研究表明,该县近22 a 的水土流失治理已大大减轻了地表的裸露程度,地表裸土面积从175.5 km<sup>2</sup>减少到86.6 km<sup>2</sup>;地表裸露强度从0.487 下降到0.383; 裸土破碎度从0.103 上升到0.207。在1988~1999 年和1999~2010 年的2 个时间段里,裸土面积的变化呈现逐渐减少,减速加快的趋势,客观地反映了长汀县水土流失治理的重要扶持政策所产生的积极效应。</p>
|
| [8] |
Evaluating the use of Landsat 30m Enhanced Thematic Mapper to monitor vegetation cover in shrub-steppe environments [J].https://doi.org/10.1080/10106040408542305 URL [本文引用: 1] 摘要
Many land‐management agencies are caught between decreased budgets and increasing public interest. Furthermore, semi‐arid landscapes are sensitive to management prescriptions and use, and require a significant amount of monitoring in order to assess vegetation productivity and health. The purpose of this study was to evaluate the use of Landsat Enhanced Thematic Mapper (ETM) Imagery to monitor seasonal vegetation cover in a shrub‐steppe ecosystem. The study area, managed by The Utah School and Institutional Trust Lands Administration, consists of a shrub‐steppe environment in south‐central Utah. Biotic (tree, shrub, grass, and forbs) and abotic (slope, aspect, elevation, landform type, and slope shape) data were collected during the 2001 growing season and compared with three dates of Landsat ETM satellite imagery. The relationships between remotely sensed parameters, photosynthetically active ground cover and bare ground were significant. Stepwise linear regression for total vegetation cover identified the ETM bands 2, 4, and 5 with NDVI as the strongest predictor variables (r2 = 0.86, p < 0.01). Combined predictor values for bare ground using ETM bands 3, 4, 5, and 7 with NDVI had a stronger relationship (r2 = 0.92, p < .01). Correlations between percent vegetation cover estimates versus ETM individual reflective bands and NDVI showed little relationship between vegetation cover and the NIR (band 4) but a strong relationship with NDVI for this semi‐arid landscape. Remote sensing information may be the key for public and private land mangers to make optimal economic and environmental decisions regarding use of state, public, and private rangelands.
|
| [9] |
Summary of current radiometric calibration coefficients for Landsat MSS, TM, ETM+, and EO-1 ALI sensors. https://doi.org/10.1016/j.rse.2009.01.007 URL [本文引用: 1] 摘要
This paper provides a summary of the current equations and rescaling factors for converting calibrated Digital Numbers (DNs) to absolute units of at-sensor spectral radiance, Top-Of-Atmosphere (TOA) reflectance, and at-sensor brightness temperature. It tabulates the necessary constants for the Multispectral Scanner (MSS), Thematic Mapper (TM), Enhanced Thematic Mapper Plus (ETM+), and Advanced Land Imager (ALI) sensors. These conversions provide a basis for standardized comparison of data in a single scene or between images acquired on different dates or by different sensors. This paper forms a needed guide for Landsat data users who now have access to the entire Landsat archive at no cost.
|
| [10] |
USGS. Landsat 8 Data [OL]. |
| [11] |
Image-based atmospheric corrections-revisited and improved [J].https://doi.org/10.1016/0031-0182(96)00019-3 URL [本文引用: 1] 摘要
A major benefit of multitemporal, remotely sensed images is their applicability to change detection over time. Because of concerns about global and environmental change, these data are becoming increasingly more important. However, to maximize the usefulness of the data from a multitemporal point of view, an easy-to-use, cost-effective, and accurate radiometric calibration and correction procedure is needed. The atmosphere effects the radiance received at the satellite by scattering, absorbing, and refracting light; corrections for these effects, as well as for sensor gains and offsets, solar irradiance, and solar zenith angles, must be included in radiometric correction procedures that are used to convert satellite-recorded digital counts to ground reflectances. To generate acceptable radiometric correction results, a model is required that typically uses in-situ atmospheric measurements and radiative transfer code (RTC) to correct for atmospheric effects. The main disadvantage of this type of correction procedure is that it requires in-situ field measurements during each satellite overflight. This is unacceptable for many applications and is often impossible, as when using historical data or when working in very remote locations. The optimum radiometric correction procedure is one based solely on the digital image and requiring no in-situ field measurements during the satellite overflight. The dark-object subtraction (DOS) method, a strictly image-based technique, is an attempt to achieve this ideal procedure. However, the accuracy is not acceptable for many applications, mostly because it corrects only for the additive scattering effect and not for the multiplicative transmittance effect. This paper presents an entirely image-based procedure that expands on the DOS model by including a simple multiplicative correction for the effect of atmospheric transmittance. Two straightforward methods to derive the multiplicative transmittance-correction coefficient are presented. The COS(TZ) or COST method uses the cosine of the solar zenith angle, which, to a first order, is a good approximation of the atmospheric transmittance for the dates and sites used in this study. The default TAUs method uses the average of the transmittance values computed by using in-situ atmospheric field measurements made during seven different satellite over-flights. Published and unpublished data made available for this study by Moran et al. (1992) are used, and my model results are compared with their results. The corrections generated by the entirely image-based COST model are as accurate as those generated by the models that used in-situ atmospheric field measurements and RTC software.
|
| [12] |
Remote Sensing of the Environment: An Earth Resource Perspective (2nd Edition) [M]. |
| [13] |
The derivation of the green vegetation fraction from NOAA/ AVHRR data for use in numerical weather prediction models [J].https://doi.org/10.1080/014311698215333 URL [本文引用: 1] 摘要
Fraction of green vegetation, fg, and green leaf area index, Lg, are needed as a regular space-time gridded input to evapotranspiration schemes in the two National Weather Service (NWS) numerical prediction models regional Eta and global medium range forecast. This study explores the potential of deriving these two variables from the NOAA Advanced Very High Resolution Radiometer (AVHRR) normalized difference vegetation index (NDVI) data. Obviously, one NDVI measurement does not allow simultaneous derivation of both vegetation variables. Simple models of a satellite pixel are used to illustrate the ambiguity resulting from a combination of the unknown horizontal (fg) and vertical (Lg) densities. We argue that for NOAA AVHRR data sets based on observations with a spatial resolution of a few kilometres the most appropriate way to resolve this ambiguity is to assume that the vegetated part of a pixel is covered by dense vegetation (i.e., its leaf area index is high), and to calculate fg=(NDVI-NDVI0)/(NDVI8-NDVI0), where NDVIo (bare soil) and NDVI (dense vegetation) are specified as global constants independent of vegetation/soil type. Global (0.15o)2 spatial resolution monthly maps of fg were produced from a 5-year NDVI climatology and incorporated in the NWS models. As a result, the model surface fluxes were improved.
|
| [14] |
On the relation between NDVI, fractional vegetation cover, and leaf area index [J].https://doi.org/10.1016/S0034-4257(97)00104-1 URL [本文引用: 1] 摘要
We use a simple radiative transfer model with vegetation, soil, and atmospheric components to illustrate how the normalized difference vegetation index (NDVI), leaf area index (LAI), and fractional vegetation cover are dependent. In particular, we suggest that LAI and fractional vegetation cover may not be independent quantitites, at least when the former is defined without regard to the presence of bare patches between plants, and that the customary variation of LAI with NDVI can be explained as resulting from a variation in fractional vegetation cover. The following points are made: i) Fractional vegetation cover and LAI are not entirely independent quantities, depending on how LAI is defined. Care must be taken in using LAI and fractional vegetation cover independently in a model because the former may partially take account of the latter; ii) A scaled NDVI taken between the limits of minimum (bare soil) and miximum fractional vegetation cover is insenstive to atmospheric correction for both clear and hazy conditions, at least for viewing angles less than about 20 degrees from nadir; iii) A simple relation between scaled NDVI and fractional vegetation cover, previously described in the literature, is further confirmed by the .simulations; iv) The sensitive dependence of LAI on NDVI when the former is below a value of about 2 4 may be viewed as being due to the variation in the bare soil component.
|
| [15] |
Estimating impervious surface distribution by spectral mixture analysis [J].https://doi.org/10.1016/S0034-4257(02)00136-0 URL [本文引用: 1] 摘要
Estimating the distribution of impervious surface, a major component of the vegetation–impervious surface–soil (V–I–S) model, is important in monitoring urban areas and understanding human activities. Besides its applications in physical geography, such as run-off models and urban change studies, maps showing impervious surface distribution are essential for estimating socio-economic factors, such as population density and social conditions. In this paper, impervious surface distribution, together with vegetation and soil cover, is estimated through a fully constrained linear spectral mixture model using Landsat Enhanced Thematic Mapper Plus (ETM+) data within the metropolitan area of Columbus, OH in the United States. Four endmembers, low albedo, high albedo, vegetation, and soil were selected to model heterogeneous urban land cover. Impervious surface fraction was estimated by analyzing low and high albedo endmembers. The estimation accuracy for impervious surface was assessed using Digital Orthophoto Quarterquadrangle (DOQQ) images. The overall root mean square (RMS) error was 10.6%, which is comparable to the digitizing errors of DOQQ images. Results indicate that impervious surface distribution can be derived from remotely sensed imagery with promising accuracy.
|
| [16] |
福建省长汀县河田水土流失区植被覆盖度变化及其热环境效应 .https://doi.org/10.5846/stxb201205150720 URL Magsci [本文引用: 1] 摘要
南方红壤典型水土流失区——福建省长汀县河田盆地区的大片山地曾由于植被稀少、山岭裸露、气候炎热,而被称之为"火焰山"。通过20多年的水土流失治理,该区的生态环境有了很大的改善。利用遥感技术,计算了长汀县河田盆地区在1988-2010年间的植被覆盖度变化及其伴随的地表温度变化。结果表明,通过近22a的水土流失治理,该区的平均植被覆盖度有了明显的升高,从1988年的48.83%上升到2010年的59.78%;而同期盆地内外的温度差异也随之下降,盆地裸露区和周边地区的温差降低了近1 ℃。定量研究表明,河田盆地区的植被覆盖度每增加10%,可降低地表温度0.6-1℃。
Analysis of fractional vegetation cover change and its impact on thermal environment in the Hetian basinal area of County Changting, Fujian province, China. https://doi.org/10.5846/stxb201205150720 URL Magsci [本文引用: 1] 摘要
南方红壤典型水土流失区——福建省长汀县河田盆地区的大片山地曾由于植被稀少、山岭裸露、气候炎热,而被称之为"火焰山"。通过20多年的水土流失治理,该区的生态环境有了很大的改善。利用遥感技术,计算了长汀县河田盆地区在1988-2010年间的植被覆盖度变化及其伴随的地表温度变化。结果表明,通过近22a的水土流失治理,该区的平均植被覆盖度有了明显的升高,从1988年的48.83%上升到2010年的59.78%;而同期盆地内外的温度差异也随之下降,盆地裸露区和周边地区的温差降低了近1 ℃。定量研究表明,河田盆地区的植被覆盖度每增加10%,可降低地表温度0.6-1℃。
|
| [17] |
Remote sensing of plant nitrogen status in corn [J].https://doi.org/10.13031/2013.27665 URL [本文引用: 1] 摘要
Excessive nitrates in ground and surface water supplies are impacting nitrogen (N) fertilizer management schemes in many agricultural areas. Small amounts of N fertilizer applied as needed to a crop have potential for alleviating nitrate leaching below the crop root zone. To effectively apply this N management scheme, techniques must be developed that provide rapid assessment of the plant N status on a frequent basis. Ground-based canopy reflectance was measured perpendicular to the crop surface and in discrete wavebands over irrigated corn with several imposed N treatments for comparison to SPAD chlorophyll meter measurements and to plant tissue total N concentration. An N reflectance index (a ratio of a treatment near-infrared (NIR) to green (G) canopy reflectance to the NIR/G ratio of a well N-fertilized treatment) was developed. The N reflectance index produced a near 1 :1 relationship with the N sufficiency index (average SPAD reading for a treatment divided by the average SPAD reading for a well N-fertilized treatment) for corn growth stages V11 to R4. For the N reflectance index to be a practical, useable technique, it must represent plant N status as early as the V6 growth stage. Soil background influence on canopy reflectance during early vegetative growth is a major obstacle ; consequently, procedures must be developed to minimize its effect on this index.
|
| [18] |
利用Landsat TM 遥感数据监测冬小麦开花期主要长势参数 [J].https://doi.org/10.3969/j.issn.1002-6819.2011.05.040 URL Magsci [本文引用: 1] 摘要
为精准农业技术体系中的小麦农艺处方管理决策提供详尽的全局性信息,该文以2007-2009年试验实测数据为基础,以Landsat TM影像为遥感数据源,分析了试验样点开花期冬小麦主要长势参数与品质和产量间以及与卫星遥感变量间的相关性,分别建立及评价了TM影像遥感变量监测冬小麦开花期SPAD值、生物量、叶面积指数和叶片氮含量的模型。结果表明:冬小麦开花期,选用作物氮反射指数、近红外波段反射率和归一化植被指数这些遥感变量分别反演冬小麦SPAD值、生物量、叶面积指数和叶片氮含量是可行的;SPAD值、生物量、叶面积指数和叶片氮含量遥感监测模型的精度较高,均方根误差分别为3.12、216.5 kg/hm2、0.269和0.162,以此为基础,制作出具有实际农学意义的冬小麦开花期不同等级SPAD值、生物量、叶面积指数和叶片氮含量遥感监测专题图,实现了主要长势参数空间分布量化表达。基于卫星影像的农田面状信息获取技术克服了点状信息的不足,为农业生产管理决策及时提供信息支持,使该研究技术更利于大面积应用和推广。
Monitoring wheat main growth parameters at anthesis stage by Landsat TM. https://doi.org/10.3969/j.issn.1002-6819.2011.05.040 URL Magsci [本文引用: 1] 摘要
为精准农业技术体系中的小麦农艺处方管理决策提供详尽的全局性信息,该文以2007-2009年试验实测数据为基础,以Landsat TM影像为遥感数据源,分析了试验样点开花期冬小麦主要长势参数与品质和产量间以及与卫星遥感变量间的相关性,分别建立及评价了TM影像遥感变量监测冬小麦开花期SPAD值、生物量、叶面积指数和叶片氮含量的模型。结果表明:冬小麦开花期,选用作物氮反射指数、近红外波段反射率和归一化植被指数这些遥感变量分别反演冬小麦SPAD值、生物量、叶面积指数和叶片氮含量是可行的;SPAD值、生物量、叶面积指数和叶片氮含量遥感监测模型的精度较高,均方根误差分别为3.12、216.5 kg/hm2、0.269和0.162,以此为基础,制作出具有实际农学意义的冬小麦开花期不同等级SPAD值、生物量、叶面积指数和叶片氮含量遥感监测专题图,实现了主要长势参数空间分布量化表达。基于卫星影像的农田面状信息获取技术克服了点状信息的不足,为农业生产管理决策及时提供信息支持,使该研究技术更利于大面积应用和推广。
|
| [19] |
Introductory digital image processing: A remote sensing perspective (4th Edition) [M]. |
| [20] |
|
| [21] |
Landslide scar/soil erodibility mapping using Landsat TM/ETM+ bands 7 and 3 Normalised Difference Index: A scase study of central region of Kenya. https://doi.org/10.1016/j.apgeog.2015.09.009 URL [本文引用: 1] 摘要
The FCC components formed the inputs for knowledge-based classification with the following 13 classes: runoff, extreme erosions, other erosions, landslide areas, highly erodible, stable, exposed volcanic rocks, agriculture, green forest, new forest regrowth areas, clear, turbid and salty water. Validation of the mapped landslide areas with field GPS locations of landslide affected areas showed that 66% of the points coincided well with landslide areas mapped in the year 2000. The classification maps showed landslide areas on the steep ridge faces, other erosions in agricultural areas, highly erodible zones being already weathered rocks, while runoff were mainly fluvial deposits. Thus, landuse and rainfall processes play a major role in inducing landslides in the study area.
|

/
| 〈 |
|
〉 |


