廖伟华 , 聂鑫
, 聂鑫
Liao Weihua, Nie Xin
中图分类号: F290
文献标识码: A
文章编号: 1000-0690(2017)09-1310-08
收稿日期: 2016-11-14
修回日期: 2017-03-4
网络出版日期: 2017-11-20
版权声明: 2017 《地理科学》编辑部 本文是开放获取期刊文献,在以下情况下可以自由使用:学术研究、学术交流、科研教学等,但不允许用于商业目的.
基金资助:
作者简介:
作者简介:廖伟华(1975-),男,湖南耒阳人,副教授,硕士,主要研究方向为GIS、经济地理学、城市计算。E-mail: gisliaowh@163.com
展开
摘要
信息技术与电商平台的发展,产生了各种各样的大数据。在城市服务业中,商家在电商平台上注册自己带有坐标的信息,构成了空间服务业的空间大数据源。首先建立限定距离阈值的空间关联规则数据模型,介绍该模型产生频繁项集和关联规则的方法与步骤。最后利用Python爬取糯米网南宁站的商家信息,用Apriori算法做出了10~1 000 m 6种距离阈值的空间关联规则和服务业空间频繁项集。
关键词:
Abstract
With the development of information technology, big data has become a research focus of all sectors. There is an increasing demand for big data in the urban planning management process. Big data acquisition and calculation is a key technology in the process of the smart city construction. This article covers the following major aspects: 1) Distance table linking to urban service physical store table is used to establish spatial association frequent rules model based on the concept of spatial neighbouring point and the property of spatial point entity; the article also introduces the method and procedure of how spatial frequent items and spatial association rules appear in urban service spatial association model; 2) “For xml path” technology is used in SQL Server to build spatial transaction database because transaction database is needed in association rules computing; 3) Python+sqlite3+lxml+BeautifulSoup technology is used to crawl the online data of the companies in Nanning which have all of their public information registered on “Baidu Nuomi” (https://nn.nuomi.com/); 4) Apriori algorithm is applied to analyze spatial frequent items and spatial association rules in urban service industry of 6 distance thresholds between 10 to 1 000 meters with the obtained data. In case study, the top six registered businesses in “Baidu Nuomi” are snacks and fast food, beauty, hotels, bakeries, sweets and drinks, budget hotels. The spatial association rule of {budget hotels, hotels} has a high degree of confidence and a high upgrading degree in the distance threshold of 10 m and 50 m, being a set of strong spatial association rules. This illustrates the Nanning hotel industry has the characteristics of a compact layout, with all kinds of hotels being together. The spatial association rule of {sweet drinks, snacks and fast food} is a set of strong spatial association rules in the distance threshold of 50 m, 500 m and 1 000 m. Snacks and fast food frequency is very high, especially in the succeeding rules with high support degree. In different distance thresholds, as a kind of mass consumer entity service, snacks and fast food restaurants are distributed around various industries. Because the lift degree of these rules is about 1, the snacks and fast food industry has the characteristics of no connection with other industries. This study is an attempt to use ubiquitous web data around us to analyze city management. Researchers can get a steady flow of big data so as to better carry out the studies on city big data in real time with this methods and thoughts.
Keywords:
城市服务业在空间分布上有集聚模式和分布特征,空间分布模式的研究方法受到广泛关注[1]。由于移动互联网的迅猛发展,基于位置服务的计算与应用成为各大电商平台面临竞争的一项必备技术[2]。地学研究者同样对大数据的研究与应用进行了思考[3]。很多学者利用这些电商平台的公开网页数据,进行基于大数据的城市计算[4,5],从而为城市规划、管理服务,如利用出租车轨迹数据[6]、POI数据[7]、微博签到数据[8,9]、网络气象数据[10]等大数据进行了城市规划、智能交通、城市环境投诉、城市能源消耗等多方面的研究。
城市服务业的布局是城市规划内容的一个重要部分,目前规划者关注规划布局的组团模式研究,城市服务业中心热点核密度研究[11]等。由于不同的城市服务业之间在位置上存在拓扑关系和空间关联,一个服务业就能通过其它服务业进行预测。自从Agrawal提出关联规则的挖掘问题以来[12],很多研究者对该问题做了大量的研究,这些研究主要集中在挖掘算法方面,像层次挖掘算法,增量更新算法等。地学研究者利用空间实体的位置拓扑,在经济地理方面也做了大量的研究,这些研究大多集中使用ESDA方法分析城市和区域经济各个方面[13]。城市服务业空间关联分析方面研究,特别是基于位置关系的Apriori算法在城市服务业方面的方法与实例研究尚少。现在,由于电商平台迅猛发展,各个商家为了推广业务,都纷纷入驻知名电商平台,在平台上填写自己商家,包括地址,电话、坐标等基本信息。从而,每个知名电商平台都是一个城市服务业空间大数据实体,同时,这些大品牌电商又有自己的API,为其他用户提供数据获取服务。本文利用城市服务业实体店的空间特性,计算空间距离表,引入Apriori算法去计算城市服务业的空间关联规则和频繁模式,最后利用网页爬虫爬取百度糯米数据验证模型的可行性。
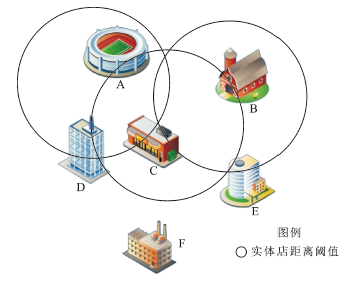
图1中有A~F共6个服务业实体店,ID为A:1001,B:1002,C:1003,D:1004,E:1005,F:1006。在GIS空间数据库中,每个兴趣点(POI)都有自己的
距离表只有输入POI的ID以及邻近点的ID和距离信息(表1)。从表中知道,NERA_FID事实上是临近点的ID。用S.NERA_FID=T.ID关联两个表,其中S代表距离表,T代表原来的空间实体表。关联计算结果包含了每个邻近点的所有属性信息。结果可以进行空间属性查询、计算等。
表1 空间临近距离
Table 1 Distance of neighbouring points
| 输入点ID | 临近点ID | 距离(m) |
|---|---|---|
| 1001 | 1003 | 100 |
| 1001 | 1004 | 80 |
| 1002 | 1003 | 85 |
| 1002 | 1005 | 70 |
| 1003 | 1001 | 95 |
| … | … | … |
关联规则数据挖掘中最经典的案例是沃尔玛“啤酒和尿布”的故事。它提出的最初动机是针对购物篮分析。如今,该技术广泛应用于各个领域,如天猫、京东等各知名电商网站,在网站购物中的“购买此商品的顾客同时还购买了……”等提示语。关联规则中有几个基本概念[14,15]:
1) 项集。项集是一个集合的概念,在空间位置中,一个单元空间项就是一项,如一个酒店。若干项的集合称为项集,如{酒店,蛋糕店}构成一个空间二元项集。
2) 关联规则。关联规则一般记为
至于空间关联性的强度如何,如酒店到底是跟蛋糕店聚集,还是跟小吃,私房菜更聚集。则由关联分析中的3个核心概念——支持度、置信度和提升度来控制和评价。
假设有10 000个空间服务业实体,其中酒店有1 000个,蛋糕店2 000个,私房菜馆500个,且酒店跟蛋糕店临近的有800个,酒店跟私房菜临近的有100个。
(1) 支持度:支持度是指所有项集中{X,Y}出现的可能性,公式如下:
式中,
(2) 置信度。置信度表示含有
式中,
(3) 提升度。提升度表示在含有
式中,
服务业实体店散落在城市各个角落,它们两两之间在空间位置分布上存在一定的关联性。通过关联分析,可以找出一种服务业跟其他服务业的空间集聚关联性。它对服务产业布局,选址,以及基于位置服务的实体店推荐,都有重要的指导意义。例如,在实际工作中,如果某个商家要布局某个服务产业,通过空间关联分析,找出该产业的关联前置产业,他就可以选址布局在空间关联性强的服务产业周边,从而增加客流量,提升产业的集聚度。要在看似散落的各个服务业实体之间发现空间关联规律,需要计算空间频繁项集。
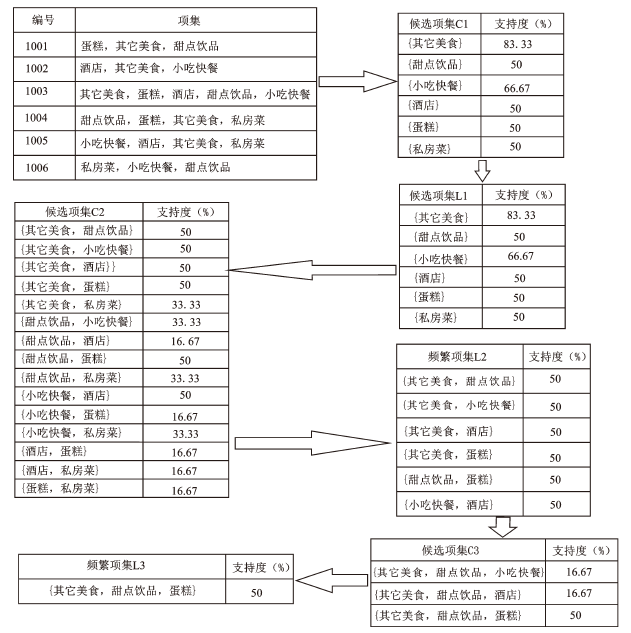
3) 空间频繁项集。关联规则的频繁项集算法中最常用的就是Apriori算法[16,17],它的核心思想就是通过候选集生成和情节的向下封闭检测两个阶段来挖掘频繁项集[18]。图1中,假设A经营的是蛋糕,B是酒店,C是其他美食,D是甜点饮品,E是小吃快餐,F是私房菜。需要指出的是:空间临近点计算,在临近点表并没有包含自己本身,而构造空间事务表一定要包含自己的。如A点临近点为C(其他美食),D(甜点饮品),因此在构造空间事务表中,要加上自己本身(蛋糕),从而成为一条空间事务表中的一个空间项集。图1中,可以构造含有6条空间事务项的空间事务表(图2)。
空间频繁项集具体计算步骤是:
第一次扫描:对每个候选服务业空间点计数,计数结果跟总事务项求商,得到支持度,假设最低支持度为50%,可以得到频繁1——项集(L1)。
第二次扫描:对L1 合并产生候选项集C2,计数结果跟总事务项相除,得到支持度。结果中大于最低支持度的,产生频繁2——项集(L2)。
第三次扫描:对L2 合并产生候选项集C3,计数结果跟总事务项相除,得到支持度。结果中大于最低支持度的,产生频繁3——项集(L3)。
频繁项集一般会产生空间强关联规则,即行业空间临近集聚。如其它美食=>甜点饮品的支持度为50%,置信度为40%。即在一个城市中,一个美食店指定距离范围内,旁边会有甜点饮品店的的支持度为50%。
本文对南宁市的服务业进行研究。南宁市是广西壮族自治区的首府,位于广西南部,行政区划为7区5县。本文选取了南宁市辖区除除武鸣区(刚划为南宁市区)以外的6个主城区进行研究。
现在的大多网站对于网页公开数据采用了半开放的态度,如限制API的返回条数,表现层不能访问商家坐标等。基于目标数据模式的爬虫针对的是网页上的数据,所抓取的数据一般要符合一定的模式,或者可以转化或映射为目标数据模式。目前,网络爬虫的语言有Python、PHP、C#、JAVA、Swift等。程序员一般可以从电子商务网站上抓取,经过处理,获得包括经纬度点模式的空间数据。研究首先采用Python+sqlite3+lxml+BeautifulSoup 技术对百度糯米(https://nn.nuomi.com/)上的所有南宁市区网站注册商家公开信息进行网页爬虫,共得到5个大类88个小类(分类标准参照百度糯米网站)13 000多条带坐标的商家信息记录。
研究对爬取的南宁市内所有的商家按距离由近及远,分别计算10 、50 、100 、200 、500 、1 000 m共6种距离的商家限定距离临近距离表,然后采用SQL的for xml path技术构造每种距离的商业服务点的空间服务业事务数据表,在R语言中进行Apriori算法分析,分别进行空间关联规则提取,空间频繁2、3、4项集等计算。
1) 关联规则。对南宁市城市服务业的各个距离阈值进行apriori算法分析,其中每种距离,设置最小支持度为0.01,最小置信度为0.5,每种距离的空间关联规则都会产生上万条关联规则,在这些关联规则中,按支持度降序排序,取每种距离的前5条。鉴于篇幅,表2只列出5种距离的前5条,可以看出,在距离比较近时,支持度比较低,像10 m距离,最高的空间关联规则{经济型酒店=> 酒店}支持度也就10%,但提升度很高。1 000 m这样的远距离,最高的空间关联规则{蛋糕=>小吃快餐}的支持度接近100%,但提升度在1左右。以最高的第一条为例,在研究区域南宁市内,在短距离阈值内,经济型酒店10 m距离内有酒店出现的概率为10%,但在这10%的经济型酒店附近出现酒店的概率为100%。在远距离1 000 m内蛋糕店周边有小吃快餐的概率为99.27%。即1 000 m范围内,蛋糕店周边几乎肯定会出现小吃快餐店,但它的提升度接近1,也就是说这两个出现并没有必然联系,小吃快餐店出现在蛋糕店周边的必然性特别大,也可能出现在其它的服务业实体店周边。这点也与我们平常的认知相符合,在近距离内,一个店周边出现某种特定店的概率小于远距离的。我们还可以按这种方法去找某种行业的周边的行业,比如丽人服务业周边限定距离会有些什么行业,或是以丽人行业作后置规则,哪些行业出现一定会出现丽人行业等。
表2 按支持度排前5的规则
Table 2 The top 5 rules by support of Nanning
| 距离(m) | 规则 | 支持度 | 置信度 | 提升度 |
|---|---|---|---|---|
| 10 | {经济型酒店} => {酒店} | 0.1082 | 1.0000 | 7.1012 |
| {酒店} => {经济型酒店} | 0.1082 | 0.7681 | 7.1012 | |
| {川菜} => {全部中餐} | 0.0445 | 0.8738 | 8.5759 | |
| {个性写真} => {丽人} | 0.0429 | 0.6963 | 3.5576 | |
| {婚纱摄影} => {个性写真} | 0.0389 | 0.7852 | 12.7380 | |
| 50 | {甜点饮品} => {小吃快餐} | 0.2773 | 0.7772 | 1.4086 |
| {其他美食} => {小吃快餐} | 0.2301 | 0.7989 | 1.4478 | |
| {蛋糕} => {小吃快餐} | 0.2293 | 0.7140 | 1.2940 | |
| {经济型酒店} => {酒店} | 0.1964 | 1.0000 | 3.9118 | |
| {酒店} => {经济型酒店} | 0.1964 | 0.7684 | 3.9118 | |
| 100 | {甜点饮品} => {小吃快餐} | 0.4696 | 0.9012 | 1.2409 |
| {丽人} => {小吃快餐} | 0.4450 | 0.8284 | 1.1406 | |
| {蛋糕} => {小吃快餐} | 0.4086 | 0.8631 | 1.1883 | |
| {其他美食} => {小吃快餐} | 0.4013 | 0.9001 | 1.2393 | |
| {蛋糕} => {甜点饮品} | 0.3500 | 0.7392 | 1.4186 | |
| 500 | {甜点饮品} => {小吃快餐} | 0.9016 | 0.9944 | 1.0096 |
| {小吃快餐} => {甜点饮品} | 0.9016 | 0.9154 | 1.0096 | |
| {蛋糕} => {小吃快餐} | 0.8982 | 0.9932 | 1.0084 | |
| {小吃快餐} => {蛋糕} | 0.8982 | 0.9119 | 1.0084 | |
| {丽人} => {小吃快餐} | 0.8897 | 0.9950 | 1.01024 | |
| 1000 | {蛋糕} => {小吃快餐} | 0.9928 | 1.0000 | 1.0004 |
| {小吃快餐} => {蛋糕} | 0.9928 | 0.9932 | 1.0004 | |
| {甜点饮品} => {小吃快餐} | 0.9924 | 1.0000 | 1.0004 | |
| {小吃快餐} => {甜点饮品} | 0.9924 | 0.9928 | 1.0004 | |
| {甜点饮品} => {蛋糕} | 0.9906 | 0.9982 | 1.0054 |
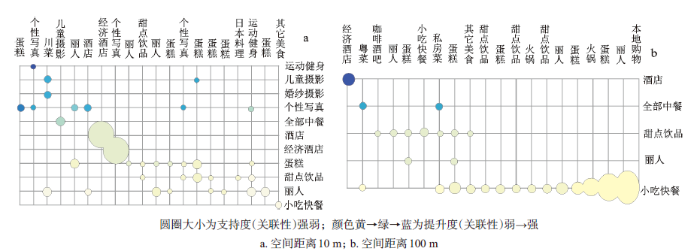
用图形的的方式更直观地显示出关联分析结果,取每种距离关联分析结果按支持度降序排序,对每种空间距离取前50条规则,限于篇幅,图3只列出10 m和100 m两种,按照提升度参数看,关联性最强的,图中的颜色最深;按照支持度看,关联性最强的,圆点尺寸最大。
图3 不同距离阈值的南宁市前50条规则
Fig.3 The top 50 rules map of different distance threshold for Nanning
实例中,在百度糯米上注册商家数量前6位的分别是:小吃快餐店1 904家,丽人实体店1 693家,酒店841家,蛋糕店793家,甜点饮品点759家,经济型酒店538家。在表2和图3中,{经济型酒店,酒店}在10、50 m距离阈值中,置信度高,提升度高,是一组强关联规则,说明了南宁市酒店行业有紧凑布局的特点,各种大众消费型酒店聚集在一起。这种强关联规则说明了南宁大众消费型酒店业的从业者选址,喜欢跟竞争对手布局在一起,从而提升客流量,形成了区域行业品牌空间集聚。{甜点饮品,小吃快餐}在50、500、1 000 m阈值中是一组强关联规则,特别是在高支持度的后置规则中,小吃快餐出现的频率很高。在不同的距离阈值中,作为一种大众消费实体店,小吃快餐店分布在各种行业的周边,由于它的提升度都是在1左右,小吃快餐行业跟其他行业并没有集聚性的特点。丽人行业跟个性写真行业构成的空间关联规则,提升度高,它们也呈现出行业集聚的特点。可以看出,百度糯米上注册的商家大多是社区生活服务业,本身具有服务半径小的特点,所以在近距离具有高置信度,高提升度,远距离虽然有高置信度,但提升度大多接近1。
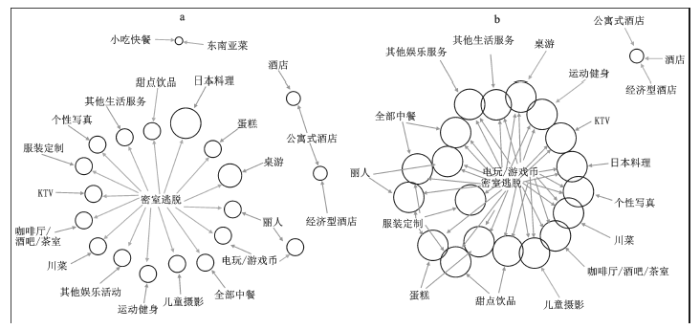
2) 频繁项集。同样,在服务业空间数据库基础上,可以产生每种距离服务业空间频繁项集。设置最小支持度为1%,分别对每种距离生成2、3、4项频繁项集。其中,10 m阈值距离的2项集第一位的为{公寓式酒店,酒店} ,3项集第一位的为{公寓式酒店,经济型酒店,酒店},4项集第一位的为 {电玩/游戏币,服装定制,丽人,密室逃脱} 。100 m阈值距离的2项集第一位的为{境外游,丽人} ,3项集第一位的为{国内游,境外游,丽人},4项集第一位的为{国内游,境外游,丽人,旅游}。1 000 m阈值距离的2项集第一位的为{青年旅舍,小吃快餐},3项集第一位的为{青年旅舍,小吃快餐,游泳},4项集第一位的为{青年旅舍,小吃快餐,游泳,珠宝首饰}。所有频繁项集的支持度都不是很高,在1%~1.6%之间,远距离阈值比近距离阈值稍高。在南宁市服务业布局中,能同时在某种距离范围出现2、3、4种服务业实体的概率不是很高。
同样,可以用图形方式更直观的显示出频繁项集的组合效果。研究中做出了每种距离阈值的2、3、4项集。限于篇幅,我们列出10 m阈值的2与3项频繁集,图中,圆圈越尺寸越大,按支持度来看,空间距离阈值范围内出现的概率越大。 图4进一步说明了南宁市大众消费类酒店业在10 m等短距离距离阈值内的空间聚集性特点。不管是空间频繁2项集还是3项集,大众消费型的酒店业都单独集聚在图上的右侧,而密室逃脱等行业跟其他各个行业空间频繁关联,关联行业太多。酒店业的空间集聚性特点,不仅可以省去考察和时间成本,还可以借助竞争对手的品牌效益去提升业务量。
图4 10 m阈值距离频繁2项集(a)与频繁3项集(b)
Fig.4 Two frequent items (a) and 3 frequent items (b) for 10 m distance threshhold
大数据时代给城市数据的实时获取和分析提供了前所未有的信息环境。城市大数据大多具有空间位置特性,基于大数据的城市计算是智慧城市的重要组成部分。利用电商平台的注册数据,研究者可以在空间总体架构下,去测算每个行业之间的空间位置关联性,探讨行业之间的空间集聚,而不是像空间自相关那样,只能测算整体空间相关性。研究计算出了南宁市百度糯米网站上注册的各种服务业之间,10~1 000 m之间6种限定距离阈值的所有关联规则,空间频繁2、3、4项集,限于篇幅,并没有一一列出,并总结出了一些空间关联规则规律。
城市服务业空间关联规则挖掘作为一种空间服务业实体空间关联数据挖掘方法,能很好地挖掘出城市服务业实体店之间的空间关联聚集性,丰富产业集聚理论的研究方法。在每个既定的城市内部体系中,空间实体一般都有共生,相连,相邻等拓扑关系。此方法作为一种基于位置关联的挖掘方法,可以挖掘出城市不同空间实体同时出现的内在规律和实体的特征项之间频繁同时出现的条件规则。空间关联规则结果有强关联规则和一般关联规则,结果不管是对城市管理者,城市设计者还是普通市民,都能提供很好的决策参考服务。研究中的数据来源实体网站公开信息,可以有实时的海量数据,但由于用户注册是商家自己,并不是资质的测绘公司,因此,数据源的空间坐标精度不一定能保证。
The authors have declared that no competing interests exist.
| [10] |
Ma Z et al. Recommending friends and locations based on individual location history [J].https://doi.org/10.1145/1921591.1921596 URL [本文引用: 1] 摘要
The increasing availability of location-acquisition technologies (GPS, GSM networks, etc.) enables people to log the location histories with spatio-temporal data. Such real-world location histories imply, to some extent, users' interests in places, and bring us opportunities to understand the correlation between users and locations. In this article, we move towards this direction and report on a personalized friend and location recommender for the geographical information systems (GIS) on the Web. First, in this recommender system, a particular individual's visits to a geospatial region in the real world are used as their implicit ratings on that region. Second, we measure the similarity between users in terms of their location histories and recommend to each user a group of potential friends in a GIS community. Third, we estimate an individual's interests in a set of unvisited regions by involving his/her location history and those of other users. Some unvisited locations that might match their tastes can be recommended to the individual. A framework, referred to as a hierarchical-graph-based similarity measurement (HGSM), is proposed to uniformly model each individual's location history, and effectively measure the similarity among users. In this framework, we take into account three factors: 1) the sequence property of people's outdoor movements, 2) the visited popularity of a geospatial region, and 3) the hierarchical property of geographic spaces. Further, we incorporated a content-based method into a user-based collaborative filtering algorithm, which uses HGSM as the user similarity measure, to estimate the rating of a user on an item. We evaluated this recommender system based on the GPS data collected by 75 subjects over a period of 1 year in the real world. As a result, HGSM outperforms related similarity measures, namely similarity-by-count, cosine similarity, and Pearson similarity measures. Moreover, beyond the item-based CF method and random recommendations, our system provides users with more attractive locations and better user experiences of recommendation.
|
| [11] |
城市汽车服务业空间集聚特征研究:以南京市为例 [J].
<p>随着中国城市化进程的不断深入, 汽车服务业已成为城市现代服务业的重要组成部分, 对城市空间影响也日益加大。以南京市为案例, 对汽车服务业总体空间集聚及分行业空间集聚情况进行了分析与比较, 证实了汽车服务业集聚空间的出现, 不同的行业类型其空间表现是不同的。进而总结归纳出南京市汽车服务业空间布局特征, 具体表现为:圈层分布特征明显, 汽车销售、汽车维修养护、汽车配件、汽车租赁、汽车俱乐部五大行业在不同圈层的集聚状况也有着明显的差异;总体呈现出小集聚、大分散的格局, 除了几个规模较大的集聚区, 汽车服务业整体空间布局显得比较零碎;与干道交通关联紧密, 大部分汽车服务业都分布于城市干道周围。</p>
The Spatial Agglomeration Characteristics of Automotive Service Industry: A Case Study of Nanjing.
<p>随着中国城市化进程的不断深入, 汽车服务业已成为城市现代服务业的重要组成部分, 对城市空间影响也日益加大。以南京市为案例, 对汽车服务业总体空间集聚及分行业空间集聚情况进行了分析与比较, 证实了汽车服务业集聚空间的出现, 不同的行业类型其空间表现是不同的。进而总结归纳出南京市汽车服务业空间布局特征, 具体表现为:圈层分布特征明显, 汽车销售、汽车维修养护、汽车配件、汽车租赁、汽车俱乐部五大行业在不同圈层的集聚状况也有着明显的差异;总体呈现出小集聚、大分散的格局, 除了几个规模较大的集聚区, 汽车服务业整体空间布局显得比较零碎;与干道交通关联紧密, 大部分汽车服务业都分布于城市干道周围。</p>
|
| [12] |
Mining association rules between sets of items in large databases [J].https://doi.org/10.1145/170035.170072 URL 摘要
We are given a large database of customer transactions. Each transaction consists of items purchased by a customer in a visit. We present an efficient algorithm that generates all significant association rules between items in the database. The algorithm incorporates buffer management and novel estimation and pruning techniques. We also present results of applying this algorithm to sales data obtained from a large retailing company, which shows the effectiveness of the algorithm.
|
| [13] |
中国海洋产业空间集聚及其协调发展研究 [J].
产业集聚是经济活动最突出的地理特征,对陆域产业集聚的研究由来已久,而对海洋产业空间集聚问题的探讨尚处起步阶段。基于海洋经济地理视角,首先依系统论观点,对区域海洋产业集聚的空间结构层次及其相互关系进行了简要分析,省际尺度的海洋产业空间结构的研究处于“承上启下”的地位;在此基础上运用区位熵对沿海11 省市区海洋产业的集聚程度进行测度,并描述了1996~2012 年空间集聚变化特征,研究发现,近17 年中国沿海地区海洋产业的集聚过程大致可以分为3 个阶段,并已形成了4 个较强集聚区,即天津、上海、福建、海南;产业集聚带来发展的同时也会增加对区域资源环境的压力,文中进而运用耦合协调度模型对4 个地区2001~2012 年海洋产业-资源环境复合系统的协调程度进行了测度,结果表明,目前4 个地区均处于中级协调阶段。
Yang Jun et al.Spatial Agglomeration of Marine Industries and Region Coordinated Development in China.
产业集聚是经济活动最突出的地理特征,对陆域产业集聚的研究由来已久,而对海洋产业空间集聚问题的探讨尚处起步阶段。基于海洋经济地理视角,首先依系统论观点,对区域海洋产业集聚的空间结构层次及其相互关系进行了简要分析,省际尺度的海洋产业空间结构的研究处于“承上启下”的地位;在此基础上运用区位熵对沿海11 省市区海洋产业的集聚程度进行测度,并描述了1996~2012 年空间集聚变化特征,研究发现,近17 年中国沿海地区海洋产业的集聚过程大致可以分为3 个阶段,并已形成了4 个较强集聚区,即天津、上海、福建、海南;产业集聚带来发展的同时也会增加对区域资源环境的压力,文中进而运用耦合协调度模型对4 个地区2001~2012 年海洋产业-资源环境复合系统的协调程度进行了测度,结果表明,目前4 个地区均处于中级协调阶段。
|
| [14] |
Toward the Next Generation of Recommender Systems: A Survey of the State-of-the-Art and Possible Extensions [J].https://doi.org/10.1109/TKDE.2005.99 URL [本文引用: 1] 摘要
This paper presents an overview of the field of recommender systems and describes the current generation of recommendation methods that are usually classified into the following three main categories: content-based, collaborative, and hybrid recommendation approaches. This paper also describes various limitations of current recommendation methods and discusses possible extensions that can improve recommendation capabilities and make recommender systems applicable to an even broader range of applications. These extensions include, among others, an improvement of understanding of users and items, incorporation of the contextual information into the recommendation process, support for multicriteria ratings, and a provision of more flexible and less intrusive types of recommendations.
|
| [15] |
Amazon.com Recommendations: Item-to-Item Collaborative Filtering [J].https://doi.org/10.1109/MIC.2003.1167344 URL [本文引用: 1] 摘要
By comparing similar items rather than similar customers, item-to-item collaborative filtering scales to very large data sets and produces high-quality recommendations.
|
| [16] |
Sochor H et al. Introduction to arules —A computational environment for mining association rules and frequent item sets [J].https://doi.org/10.1016/j.jspi.2004.04.017 URL [本文引用: 1] 摘要
Mining frequent itemsets and association rules is a popular and well researched approach to discovering interesting relationships between variables in large databases. The R package arules presented in this paper provides a basic infrastructure for creating and manipulating input data sets and for analyzing the resulting itemsets and rules. The package also includes interfaces to two fast mining algorithms, the popular C implementations of Apriori and Eclat by Christian Borgelt. These algorithms can be used to mine frequent itemsets, maximal frequent itemsets, closed frequent itemsets and association rules. (author's abstract)
|
| [17] |
The arules R-Package Ecosystem: Analyzing Interesting Patterns from Large Transaction Data Sets [J].https://doi.org/10.1093/imamci/dnr006 URL [本文引用: 1] 摘要
Summary: This paper describes the ecosystem of R add-on packages developed around the infrastructure provided by the package arules. The packages provide comprehensive functionality for analyzing interesting patterns including frequent itemsets, association rules, frequent sequences and for building applications like associative classification. After discussing the ecosystem’s design we illustrate the ease of mining and visualizing rules with a short example.
|
| [1] |
西安市生产者服务业空间布局特征与集聚模式研究 [J].
以西安市为例,根据相关资料,采用定性与定量、静态与动态分析相结合的方法,借助ArcGIS软件,通过地理集中指数的测算,对西安市生产者服务业发展水平及其空间布局特征与集聚模式进行研究。主要结论:① 生产者服务业具有一定专业化水平,集聚特征明显,产值和从业人数占第三产业的比重呈上升的趋势,但仍处于较低水平;② 生产者服务业在城市内部空间集聚度偏低,但逐渐趋于集中,且分行业集聚程度参差不齐;③ 生产者服务业整体呈现多核心的集聚模式,分行业表现出不同的集聚模式类型;④ 空间结构形成机制主要是市场导向、区位因子、政府导向。对促进产业结构升级转换,确定合理的产业发展方向和城市产业规划、布局,加快西安市经济发展及提升城市竞争力都具有借鉴意义。
Spatial Features and Agglomeration of Producer Services in Xi’an City, China.
以西安市为例,根据相关资料,采用定性与定量、静态与动态分析相结合的方法,借助ArcGIS软件,通过地理集中指数的测算,对西安市生产者服务业发展水平及其空间布局特征与集聚模式进行研究。主要结论:① 生产者服务业具有一定专业化水平,集聚特征明显,产值和从业人数占第三产业的比重呈上升的趋势,但仍处于较低水平;② 生产者服务业在城市内部空间集聚度偏低,但逐渐趋于集中,且分行业集聚程度参差不齐;③ 生产者服务业整体呈现多核心的集聚模式,分行业表现出不同的集聚模式类型;④ 空间结构形成机制主要是市场导向、区位因子、政府导向。对促进产业结构升级转换,确定合理的产业发展方向和城市产业规划、布局,加快西安市经济发展及提升城市竞争力都具有借鉴意义。
|
| [2] |
PMR 架构的兴趣点推荐研究 [J].Study of POI-s recommendation based on a PMR framework. |
| [3] |
中国生产性服务业空间集聚特征与模式研究——基于地级市的实证分析 [J].
<p>2000 年以后,中国生产性服务业高速发展,产业格局逐渐形成。利用2000 年、2005 年和2010 年3 个年份地级市行业从业人员的数据,通过区位基尼系数和空间自相关性分析,发现中国生产性服务业在地理空间中整体呈现点状集中的模式,进而对不同行业的集聚特点进行比较分析,认为信息服务业和商务服务业是首位城市集聚模式,科研技术服务业和房地产业是位序规模分布的模式,金融业则是均衡分布的模式。最后,结合主要城市行业的相对优势度分析,得出随着从业人员的增加,承担的生产性服务功能更加综合,符合中心地理论的特点,在省域和城市群内各城市具有较好的职能分工和互补性。</p>
Spatial Cluster Characteristics and Modes of Producer Services in China.
<p>2000 年以后,中国生产性服务业高速发展,产业格局逐渐形成。利用2000 年、2005 年和2010 年3 个年份地级市行业从业人员的数据,通过区位基尼系数和空间自相关性分析,发现中国生产性服务业在地理空间中整体呈现点状集中的模式,进而对不同行业的集聚特点进行比较分析,认为信息服务业和商务服务业是首位城市集聚模式,科研技术服务业和房地产业是位序规模分布的模式,金融业则是均衡分布的模式。最后,结合主要城市行业的相对优势度分析,得出随着从业人员的增加,承担的生产性服务功能更加综合,符合中心地理论的特点,在省域和城市群内各城市具有较好的职能分工和互补性。</p>
|
| [4] |
Methodologies for Cross-Domain Data Fusion: An Overview [J].https://doi.org/10.1109/TBDATA.2015.2465959 URL [本文引用: 1] 摘要
Traditional data mining usually deals with data from a single domain. In the big data era, we face a diversity of datasets from different sources in different domains. These datasets consist of multiple modalities, each of which has a different representation, distribution, scale, and density. How to unlock the power of knowledge from multiple disparate (but potentially connected) datasets is paramount in big data research, essentially distinguishing big data from traditional data mining tasks. This calls for advanced techniques that can fuse knowledge from various datasets organically in a machine learning and data mining task. This paper summarizes the data fusion methodologies, classifying them into three categories: stage-based, feature level-based, and semantic meaning-based data fusion methods. The last category of data fusion methods is further divided into four groups: multi-view learning-based, similarity-based, probabilistic dependency-based, and transfer learning-based methods. These methods focus on knowledge fusion rather than schema mapping and data merging, significantly distinguishing between cross-domain data fusion and traditional data fusion studied in the database community. This paper does not only introduce high-level principles of each category of methods, but also give examples in which these techniques are used to handle real big data problems. In addition, this paper positions existing works in a framework, exploring the relationship and difference between different data fusion methods. This paper will help a wide range of communities find a solution for data fusion in big data projects.
|
| [5] |
Wolfson O et al.Urban computing:Concepts,methodologies,and applications [J]. |
| [6] |
Trajectory data mining: An overview [J].https://doi.org/10.1145/2743025 URL [本文引用: 1] 摘要
The advances in location-acquisition and mobile computing techniques have generated massive spatial trajectory data, which represent the mobility of a diversity of moving objects, such as people, vehicles, and animals. Many techniques have been proposed for processing, managing, and mining trajectory data in the past decade, fostering a broad range of applications. In this article, we conduct a systematic survey on the major research into trajectory data mining, providing a panorama of the field as well as the scope of its research topics. Following a road map from the derivation of trajectory data, to trajectory data preprocessing, to trajectory data management, and to a variety of mining tasks (such as trajectory pattern mining, outlier detection, and trajectory classification), the survey explores the connections, correlations, and differences among these existing techniques. This survey also introduces the methods that transform trajectories into other data formats, such as graphs, matrices, and tensors, to which more data mining and machine learning techniques can be applied. Finally, some public trajectory datasets are presented. This survey can help shape the field of trajectory data mining, providing a quick understanding of this field to the community.
|
| [7] |
Learning travel recommendations from user-generated GPS traces [J].https://doi.org/10.1145/1889681.1889683 URL [本文引用: 1] 摘要
The advance of GPS-enabled devices allows people to record their location histories with GPS traces, which imply human behaviors and preferences related to travel. In this article, we perform two types of travel recommendations by mining multiple users' GPS traces. The first is a generic one that recommends a user with top interesting locations and travel sequences in a given geospatial region. The second is a personalized recommendation that provides an individual with locations matching her travel preferences. To achieve the first recommendation, we model multiple users' location histories with a tree-based hierarchical graph (TBHG). Based on the TBHG, we propose a HITS (Hypertext Induced Topic Search)-based model to infer the interest level of a location and a user's travel experience (knowledge). In the personalized recommendation, we first understand the correlation between locations, and then incorporate this correlation into a collaborative filtering (CF)-based model, which predicts a user's interests in an unvisited location based on her locations histories and that of others. We evaluated our system based on a real-world GPS trace dataset collected by 107 users over a period of one year. As a result, our HITS-based inference model outperformed baseline approaches like rank-by-count and rank-by-frequency. Meanwhile, we achieved a better performance in recommending travel sequences beyond baselines like rank-by-count. Regarding the personalized recommendation, our approach is more effective than the weighted Slope One algorithm with a slightly additional computation, and is more efficient than the Pearson correlation-based CF model with the similar effectiveness.
|
| [8] |
Discovering Urban Functional Zones Using Latent Activity Trajectories [J].https://doi.org/10.1109/TKDE.2014.2345405 URL [本文引用: 1] 摘要
The step of urbanization and modern civilization fosters different functional zones in a city, such as residential areas, business districts, and educational areas. In a metropolis, people commute between these functional zones every day to engage in different socioeconomic activities, e.g., working, shopping, and entertaining. In this paper, we propose a data-driven framework to discover functional zones in a city. Specifically, we introduce the concept of latent activity trajectory (LAT), which captures socioeconomic activities conducted by citizens at different locations in a chronological order. Later, we segment an urban area into disjointed regions according to major roads, such as highways and urban expressways. We have developed a topic-modeling-based approach to cluster the segmented regions into functional zones leveraging mobility and location semantics mined from LAT. Furthermore, we identify the intensity of each functional zone using Kernel Density Estimation. Extensive experiments are conducted with several urban scale datasets to show that the proposed framework offers a powerful ability to capture city dynamics and provides valuable calibrations to urban planners in terms of functional zones.
|
| [9] |
Luo Q et al. Inferring social ties between users with human location history [J].https://doi.org/10.1007/s12652-012-0117-z URL [本文引用: 1] 摘要
The location-based social networks have been becoming flourishing in recent years. In this paper, we aim to estimate the similarity between users according to their physical location histories (represented by GPS trajectories). This similarity can be regarded as a potential social tie between users, thereby enabling friend and location recommendations. Different from previous work using social structures or directly matching users’ physical locations, this approach model a user’s GPS trajectories with a semantic location history (SLH), e.g., shopping malls 02 → 02 restaurants 02 → 02 cinemas . Then, we measure the similarity between different users’ SLHs by using our maximal travel match (MTM) algorithm. The advantage of our approach lies in two aspects. First, SLH carries more semantic meanings of a user’s interests beyond low-level geographic positions. Second, our approach can estimate the similarity between two users without overlaps in the geographic spaces, e.g., people living in different cities. When matching SLHs, we consider the sequential property, the granularity and the popularity of semantic locations. We evaluate our method based on a real-world GPS dataset collected by 109 users in a period of 102year. The results show that SLH outperforms a physical-location-based approach and MTM is more effective than several widely used sequence matching approaches given this application scenario.
|
| [18] |
Exploiting empirical knowledge for automatic delineation of city centres from large-scale topographic databases [J].https://doi.org/10.1016/j.compenvurbsys.2012.07.001 URL [本文引用: 1] 摘要
Current topographic databases rarely represent higher order geographic phenomena, such as city centres. However, such concepts are often referred to by humans and used in various forms of spatial analysis. Hence, the value and usability of topographic databases can greatly be improved by methods that automatically create such higher order phenomena through cartographic pattern recognition techniques, departing from the very detailed, geometry-oriented representations of topographic databases. As many higher order phenomena are only vaguely defined, this paper develops and evaluates a methodology to acquire definitional knowledge about geographic phenomena by participant experiments and use this knowledge to drive the cartographic pattern recognition process. The method is applied to acquire knowledge about British city centres and delineate referents of city centre from topographic data. City centres produced for ten British cities are compared to areas derived from alternative sources. F-1-scores between 0.45 and 0.88 are achieved, suggesting that the delineation produced plausible city centre areas. The benefits of our work are better (and user-driven) descriptions of complex geographic phenomena that can form the basis for accurately enriching topographic databases with additional semantics, thus yielding added value for the data producer and the end user. (C) 2012 Elsevier Ltd. All rights reserved.
|

/
| 〈 |
|
〉 |