白景锋 , 张海军
, 张海军
南阳师范学院环境科学与旅游学院,河南 南阳 473061
Bai Jingfeng, Zhang Haijun
中图分类号: TV211;X24
文献标识码: A
文章编号: 1000-0690(2018)10-1653-08
收稿日期: 2018-05-9
修回日期: 2018-08-25
网络出版日期: 2018-12-12
版权声明: 2018 《地理科学》编辑部 本文是开放获取期刊文献,在以下情况下可以自由使用:学术研究、学术交流、科研教学等,但不允许用于商业目的.
基金资助:
作者简介:
作者简介:白景锋(1972-),男,陕西洛南人,教授,硕士,主要研究方向为区域发展与资源开发。E-mail: nybjf813@163.com
展开
摘要
采用主成分分析法,把构建的水资源、能源和粮食的压力指数分解为3个正交向量,以矢量合成法计算水-能源-粮食(W-E-F)总压力指数。在考察1997~2015年30个省区(香港、澳门和台湾无数据,西藏缺能源数据)的水资源压力指数、能源压力指数、粮食压力指数和W-E-F总压力指数的时序变化后,选取8个反映总压力指数变化的指标,截取1997、2004、2015年3个断面,采用地理加权回归(GWR)模型对影响中国W-E-F压力指数变化的因素进行分析。结论如下:① 时间上看,W-E-F总压力先升后降;空间上看,从东南沿海向西北内陆W-E-F总压力逐渐递减,东北和沿海城市化水平高的地区压力较大。② 能源压力对中国W-E-F总压力的贡献最大,中东部地区的能源压力指数更高,淮河以北地区的水资源压力指数更高,东部的长江口以南沿海区域和广大西部地区的粮食压力指数更高。③ 1997~2015年,全国水资源压力指数多数地区上升,能源压力指数和粮食压力指数大部分地区下降。④ 不同时段,W-E-F压力变化的驱动力不同。总体上看,大部分指标与W-E-F压力变化同向,人均受教育水平和人均GDP与W-E-F压力变化反向,人口密度增大、食物构成变化、粮食生产条件和经济发展是W-E-F压力升高的主因。在分析时段内,随着时间推移,社会因素和经济因素的影响在增大,提高人均受教育水平和经济转型发展是降低W-E-F压力的有效途径。
关键词:
Abstract
As the basis of regional development, water-energy-food (W-E-F) is usually a bottleneck too. China’s strategy of sustainable development has been threatened and challenged by the spatially unbalanced distribution and the insufficient total amount of the water-energy-food supply, and the unbalanced socioeconomic development. Each year from 1997 to 2015, three pressure indices (i.e. water pressure index, energy pressure index and food pressure index) were decomposed into three orthotropic vectors by using principal component analysis, and the W-E-F pressure index were then calculated and created by vector synthesis method. For the thirty province units in China (no data are available for Hong Kong, Macao and Taiwan and no energy data for Tibet), after the temporal variations of the water pressure index, the energy pressure index, the food pressure index and the W-E-F pressure index were checked, eight variables (i.e. degree of per capita education, per capita GDP, per capita farmland area, per capita meat production, per capita aquatic product, population density, effective irrigation area, urbanization rate) which related to the W-E-F pressure were employed and three cross-section (i.e. 1997, 2004 and 2015) were chosen to carry out the geographically weighted regression (GWR) analysis. In the three developed GWR models, the dependent variable was the z-score standardized W-E-F pressure index differences between the start year and the end year, i.e. 1997 and 2004 (for model 1), 2004 and 2015 (for model 2), 1997 and 2015 (for model 3), and the eight independent variables were the respective z-score standardized differences (i.e. for the eight employed variables) between the start year and the end year. The factors which influence the variation of W-E-F index can be discovered from the developed GWR models and the conclusions are as follows: 1) The W-E-F pressure index rose initially and then declined from 1997 to 2015. Spatially, the W-E-F pressure decreased progressively from Southeast China to Northwest China, and larger pressure happened in Northeast China and those coastal provinces where urbanization level was higher. 2) The energy pressure index had made more significant contribution to the W-E-F pressure index than the water pressure index and the food pressure index. The energy pressure index was higher in central and east China and the water pressure index was bigger for those provinces in the north of Huaihe river. However, the food pressure index was higher for those coastal provinces in the south of the Yangtze River and for those provinces in west China. 3) In China, the water pressure index rose in most provinces, and the energy pressure index and the food pressure index declined in most provinces from 1997 to 2015. 4) The driving forces of the W-E-F pressure changes were different for the different phases. Overall, the same change direction was observed between most of the variables and the W-E-F pressure index. However, the opposite change direction existed between degree of per capita education and the W-E-F pressure index, so did between per capita GDP and the W-E-F pressure index. The main causes of the increased W-E-F pressure were the increased population density, the changed component of food supply, the conditions of food production and the economic development. The influences of socioeconomic factors on the W-E-F pressure rose progressively from 1997 to 2015. The effectual ways to reduce the W-E-F pressure were to improve the degree of per capita education and to reshape the economic development.
Keywords:
水资源、能源和粮食是区域发展的重要限制性因素。从2011年《全球风险报告》提出“水-能源-粮食(W-E-F)风险群”概念以来,W-E-F系统的研究受到各国研究者的普遍关注[1,2,3,4]。水、能源和粮食都受制于其数量的有限性和对人类生存的不可替代性,作为区域发展的“慢变量”,只有合理配置,并不断调整人类活动,才能使W-E-F系统压力处于最优状态。中国,从资源总量看是一个大国,但从人均数量看又是一个小国。随着社会经济的发展,资源总量的降低和对资源需求量的增大,中国社会资源的供需矛盾日显突出。研究中国W-E-F压力的时空变化,有助于全面把握W-E-F系统的演变规律,为推进区域可持续发展服务。
目前,国外对W-E-F系统的研究主要集中于:W-E-F系统内2个子系统关联研究、W-E-F系统内部作用机理研究、区域W-E-F系统实证研究[5,6,7,8,9,10,11,12]。国内学者在这一领域的研究主要集中于:W-E-F系统管理政策、W-E-F系统内部相互作用机制的定性研究、区域W-E-F系统定量预测研究[13,14,15,16,17,18,19]。从研究维度看,主要集中于城市和跨国流域层面,研究方法以定性为主,定量方法主要是系统动力学、投入产出模型和网络分析[20,21,22,23]。鉴于W-E-F系统内部作用机制不明,本研究通过构建W-E-F系统压力指数并引入空间回归分析模型,对中国W-E-F系统压力的时空变化规律和驱动因素进行探索性分析。
中国的淡水资源只占全球的6%,由于全球气候变化,中国淡水资源总量有减少趋势。由于中国人口众多,多年人均水资源不足2 400 m3,属于水资源短缺国家。随着社会经济发展,2016年水资源消耗量是1978年的7.67倍,水资源压力巨大[24]。中国幅员辽阔,气候类型多样,水资源在空间分布上存在巨大差异,水资源压力也存在明显的空间异质性。中国能源消费增长很快,2015年能耗是1985年的5.8倍,由于能源储藏的空间差异性、能源消费的空间不平衡性,区域能源压力也存在很大差异。中国用占世界7%的耕地,养活了占世界10%的人口,但由于人口增长的持续性和社会经济发展对耕地的占用,2015年中国人均耕地面积比1980年减少了40.8%[25]。因粮食增产潜力的有限性,中国粮食生产也面临着很大压力。W-E-F系统内部存在着复杂的关系,特别是各种资源在生产、消费和管理中的冲突和取舍,查找W-E-F系统压力变动的主要动力可为协调水资源、能源和粮食的生产和消费提供参考和借鉴。
从《中国统计年鉴》[25]、《中国农村统计年鉴》[26]、《中国能源统计年鉴》[27]中提取30个省区(香港、澳门和台湾无数据,西藏缺能源数据)的水资源总量、总用水量、总人口、能源生产量、能源消耗量和粮食总产量,其中能源生产量按以下标准统一折算为标准煤:原煤1 kg折算0.714 36 kg标准煤,原油1 kg折算1.428 6 kg标准煤,天然气1 m3折算1.21 kg标准煤,电力1万kW折算0.404 kg标准煤。GWR分析的8个自变量:平均受教育水平、人均GDP、人均耕地面积、人均肉类产量、人均水产品产量、人口密度、有效灌溉面积、城市化率等指标均由《1998~2016中国统计年鉴》[25]计算得出,在分析前进行了标准差标准化处理。
为反映各地区W-E-F系统面临的压力,参考相关研究成果进行W-E-F系统总压力指数的构建[28,29,30,31]。把构建的水资源压力指数、能源压力指数和粮食压力指数以主成分分析法做正交旋转,以正交旋转后得到的3个主成分的矢量合成结果作为W-E-F系统总压力指数从而消除3个分压力指数间的冗余信息量。W-E-F压力指数构建过程见下式:
式中,Fwij为i省j年水资源压力指数,Cwij为i省j年用水总量,Pwij为i省j年可利用水资源量;Feij为i省j年能源压力指数,Ceij为i省j年能源消耗总量,Peij为i省j年能源生产量;Ffij为i省j年粮食压力指数,Cfij为i省j年粮食消耗总量,Pfij为i省j年粮食生产总量。Fij为i省j年W-E-F系统总压力指数。Fwij′, Feij′和Ffij′分别是Fwij,Feij和Ffij主成分正交分解后的压力指数(矢量),“+”表示以矢量合成法计算。可利用水资源量按照水资源总量的40%计算,粮食指谷物,不包含肉蛋奶等,粮食消耗总量按照当年人口数乘以400 kg/人计算[32]。鉴于数据的可获得性,假设不存在要素的区际流动,即水资源总量指当地地表水资源与地下水资源之和再减去二者重复计算部分,不含调入的水资源量。能源生产和粮食生产都指当地的产量,不包含外地调入量。
由于水资源、能源和人口的分布都与自然地理条件有密切的关系,因此,估计W-E-F系统压力指数的空间格局受到地理空间因素的影响,所以采用地理加权回归(GWR)法,分析影响W-E-F系统压力指数变化的因素。
地理加权回归模型如下:
式中,yi为分析时段内省区i的W-E-F系统总压力指数变化值,(ui,vi)为省区i的位置,β0为省区i的回归常数,βj为省区i的第j个回归参数,xij为分析时段内自变量xj在省区i的变化值,n为自变量数,
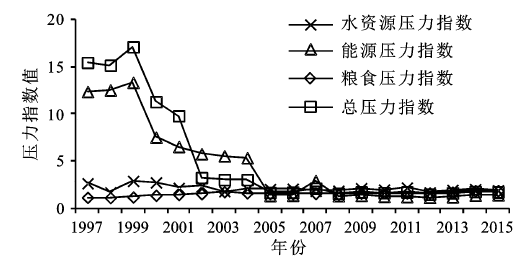
从图1可以看出中国W-E-F系统总压力指数先上升后下降。1997~1999年为上升阶段,1999~2004年为快速下降阶段,2005年以后趋于平稳。1997~1999年能源压力指数为上升期,2000年后为下降期。水资源压力指数的变化趋势和能源压力指数变化趋势大体一致,只是波动幅度更小。粮食压力指数一直保持平稳,变化不大。能源压力指数的变化对W-E-F系统总压力影响最突出。W-E-F系统总压力指数的上升是受能源压力指数上升的胁迫。1999年以后,国家政策推动,产业结构逐步升级,低耗能产业增多,经济迅速发展,W-E-F总压力指数下降。2005年以后,居民追求提高生活品质,社会的生态环境保护意识增强,产业升级初步完成,生产效率提高,W-E-F总压力指数趋于稳定。
图1 1997~2015年中国W-E-F的压力指数变化
Fig.1 Variation of the W-E-F pressure index in China from 1997 to 2015
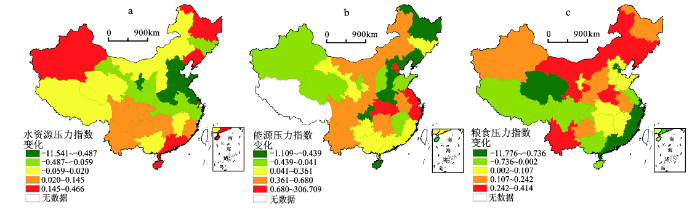
把多年压力指数的平均值用分位数法分类(图2)。水资源压力指数高的区域主要集中于淮河以北,宁夏最高,其次是北京、天津、河北、上海、江苏,长江以南普遍较低。水资源压力分布格局是水资源不足区与经济发展水平高的区域叠加的结果。能源压力指数高的区域集中于中东部,北京、上海和江浙一带最突出,与中国经济发展水平高的区域分布一致。低能源压力指数区是中国化石能源的主产区,如山西、陕西、内蒙古。粮食压力指数的高压区分布于东部的长江口以南沿海区域和广大西部地区,这是人口密度与区域食物生产力差异所致。
图2 1997~2015年中国平均水资源压力指数、能源压力指数和粮食压力指数分布
Fig.2 Distribution of the water pressure index, energy pressure index and food pressure index in China from 1997 to 2015
把30个省区1997年的压力指数减去2015年的压力指数,将结果做成指数变化图(图3),正值表示压力减小,负值表示压力增大。可以看出,1997~2015年水资源压力多数省区上升。上升的区域主要集中于黄淮海平原和陕甘宁地区,水资源压力降低的是上海、华南区、西南区、东北区和新疆,水资源压力上升区是水资源量少的区域与经济发展快的区域的交集。全国大多数省区能源压力指数呈下降趋势,压力上升区分布比较分散,主要有黑龙江、辽宁、河北、山西、山东、河南、重庆、江西、海南、青海和新疆。粮食压力指数上升的区域与经济发展水平好、城市化水平高的区域基本一致(青海、西藏除外),集中分布于东南沿海一带。多数省区粮食压力指数降低,这些省区集中于华北、东北和华中的粮食主产区。
图3 1997~2015年中国水资源压力指数、能源压力指数和粮食压力指数变化分布
Fig.3 Spatial variation of the water pressure index, energy pressure index and food pressure index from 1997 to 2015
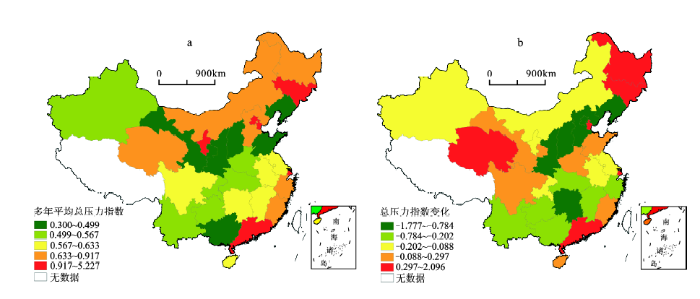
从图4可看出,W-E-F系统总压力指数的高值区有北京、天津、上海、广东、吉林和宁夏,压力指数低的区域呈“丁”字状镶嵌于其间,主要有甘肃、山西、陕西、河南、山东、辽宁、湖北、重庆、云南、贵州、广西和新疆。从1997~2015年的W-E-F总压力指数变化看,全国绝大多数省区压力上升,压力指数下降的区域镶嵌于其间,主要包括黑龙江、吉林、天津、上海、广东和青海。
图4 1997~2015年中国W-E-F系统总压力指数及其变化分布
Fig.4 Distribution and spatial variation of the W-E-F pressure index in China from 1997 to 2015
总之,经济发展水平和资源禀赋的空间差异仍然是影响中国W-E-F系统总压力空间格局的主要因素。1997~2015年W-E-F系统总压力指数变化南方大于北方,东部大于西部。
选取30个省区(不含港澳台和西藏)的1997年、2004年和2015年的W-E-F系统总压力指数做因变量原始值,选取社会因素、经济因素、生产环境因素3个方面包括人口密度、人均受教育水平、城市化率、人均GDP、人均耕地面积、有效灌溉面积、人均肉类产量、人均水产品产量8个指标做自变量的原始值。分1997~2004年、2005~2015年和1997~2015年这3个时间段,求每个时间段起始年与期末年相应变量的差,把W-E-F系统总压力指数的差作为因变量,其他指标的差作为自变量,对所有变量进行标准差标准化。通过计算条件系数(kappa系数)和方差膨胀因子(VIF)对GWR模型输入自变量的多重共线性进行检验。计算各指标得到的K值均小于100(最大为25.3),VIF值均小于5(最大为3.45)。因此,可排除GWR模型输入自变量间的多重共线问题。
由于资源禀赋的空间异质性、人口分布和经济发展等的空间不均衡性,W-E-F总压力指数变化存在空间异质性。本研究选用自适应型高斯核的GWR模型,以AICc最小化准则进行最优带宽的确定,以边邻接法构建空间权重矩阵,并作行标准化处理,通过计算局部Moran’s I指数检验模型残差的空间自相关性。结果显示,3个时段的断面数据拟合结果的R2均在0.6以上,AICc值均在110以下,残差的局部空间自相关性均不显著。
1997~2004年,与W-E-F总压力指数变化同向的因素,按影响程度(系数的绝对值,下同)从大到小有:人口密度、人均肉类产量、人均水产品产量、人均耕地面积和灌溉面积。与W-E-F总压力指数变化反向的因素,按影响度从大到小有:人均GDP、城市化率和人均受教育水平。由此可见,这一阶段对W-E-F总压力指数影响最大的是社会因素,其次是食物结构,生产环境因素、经济因素影响较小。
2005~2015年,与W-E-F总压力指数变化同向的因素,按影响程度从大到小有:人口密度、人均水产品量、人均肉类产量。与W-E-F总压力指数变化反向的因素有:城市化率。部分区域变化同向,另外的区域变化反向的因素有:人均GDP、平均受教育水平、人均耕地面积、灌溉面积。这一阶段影响最大的是社会因素,其次是食物结构、经济因素和生产环境因素。
不同社会经济发展阶段,影响W-E-F总压力指数变化的因素也是变动的。从发展时序看,社会经济影响力在增强,生产环境影响力在减弱。
1997~2015年W-E-F系统总压力指数变化的驱动因素分析结果如下:
从图5可以看出,与W-E-F总压力指数变化同向且影响程度从大到小的因素有:人口密度、有效灌溉面积、人均肉类产量、人均GDP、城市化率、人均水产品产量,即这些因素增大W-E-F总压力指数上升,这些因素减小W-E-F总压力指数下降。总体上看,与W-E-F总压力指数变化逆向的因素是平均受教育水平,即平均受教育水平降低,W-E-F总压力指数升高。在变化方向上既有同向又有反向的因素是人均耕地,该因素在不同区域对W-E-F总压力指数的影响方向和影响程度存在差异。
图5 1997~2015年GWR模型各自变量回归系数估计空间分布
Fig.5 Spatial variation of the coefficient estimation of independent variable in 1997-2015
人口密度增大是引起各省区W-E-F总压力指数增加的第一因素。从空间上看,其影响度从南到北增加,这主要是由于区域人口承载能力不同,南方人口承载力大于北方。其次是有效灌溉面积,其影响强度在空间上呈现从东向西降低,主要原因是东部地区增加单位灌溉面积所引起的人口和经济吸引力大于西部,因而压力指数增加更快。人均肉类产量的影响度从东南向西北增加,这是由于西部地区土地生产力低,水资源短缺,而单位肉类产品消耗水、土地和能源相对量高,而东部地区生产力水平高,水资源丰富,单位肉类产品消耗资源相对量低,故而,东部比西部压力增加值小。城市化率的影响表现为从西南向东北增大,主要是由于南方人劳动力—经济弹性系数大,而且更追求生活品味,每增加一个城市人口所消耗的能源、水资源和粮食比北方要多。因此,造成单位城市化率引起的W-E-F总压力指数变化南方高于北方。人均GDP和人均水产品占有量的影响都表现为从东南向西北降低。平均受教育水平对W-E-F总压力指数变化表现为:平均受教育水平提高越快W-E-F总压力指数就降低越快,且呈现从东向西影响程度逐渐降低趋势,主要是由于东部地区开发程度高,平均受教育水平的提高使得环保和节约意识更强,技术开发能力也越强,压力降低效果更明显。人均耕地对W-E-F总压力指数变化的影响有明显区域差异,在西部为同向变化,即人均耕地增加则W-E-F总压力指数增大;在东部地区为逆向变化,即人均耕地增加则W-E-F总压力指数减小。
从较长时间段看,社会因素的人口密度、食物构成是第一驱动因素,生产条件的有效灌溉面积、人均耕地面积是第二驱动因素,经济因素的城市化率和人均GDP为第三驱动因素。从单一指标看,人口密度一直影响最大,有效灌溉面积次之,人均肉类生产量和人均水产品量排第三位。但在较短时段内,各个因素的重要程度有所变动,特别是各个因素的作用方向变化较为复杂。值得一提的是,平均受教育水平作为逆向指标,对减轻W-E-F系统压力具有现实意义。
1) 人口分布、经济格局和生产的自然环境决定了中国W-E-F总压力分布的空间态势。京津沪直辖市和广东等沿海区域的W-E-F总压力高于一般省区,W-E-F总压力从东南沿海向西北内陆降低,这一分布格局和中国的经济分布、人口分布相一致。从单一形态看,水资源压力、能源压力与中国水资源与能源基地、经济发展状况密切相关,粮食压力与人口分布和粮食生产条件相关。
2) 中国W-E-F总压力随时间呈“升-降-稳”的特点,其中能源压力指数和水资源压力指数对总压力指数的变动影响贡献突出。
3) GWR分析发现,中国W-E-F总压力变化在不同时间段驱动力不同。整体上看,大部分指标与W-E-F总压力变化同向,平均受教育水平和人均GDP与W-E-F总压力变化反向。中国W-E-F系统总压力加大的主因是人口密度增大、食物构成变化、粮食生产条件的禀赋和经济发展。随时间推移,社会因素和经济因素的影响力在提高。平均受教育水平的提高和经济转型发展是降低W-E-F压力的有效途径。
由于中国自然条件的多样性、人口分布的聚集性和经济发展不均衡性所造成的W-E-F压力增大、压力空间不平衡将在相当长时间内存在。为缓解中国W-E-F的压力,首先,要缩小地区发展差距,均衡布局人口。其次,要大力提高国民受教育水平,推进科技进步,提高国民生活水平和可持续发展意识。第三,合理利用土地资源,保护耕地,提高粮食产量,推进食物结构多样化。第四,结合区域资源禀赋布局相关产业,并对高耗能、高耗水产业进行技术改造和升级,不断调整产业结构。
由于相关数据难以获取,本文对W-E-F系统压力的研究没有考虑区际要素流动。从小尺度,如村镇,立足于调查把要素流动考虑在内,从开放系统的角度对W-E-F系统压力的驱动力进行探究是后续研究需要深入考虑和对本研究进行改进的方向。
The authors have declared that no competing interests exist.
| [1] |
Global Risks 2011 Report (6th edition) [R] . |
| [2] |
Understanding the Nexus[R]. Background paper for the Bonn 2011 Conference: The Water Energy and Food Security Nexus, |
| [3] |
Water-food-energy nexus in Asia and the Pacific Region [J]. |
| [4] |
The water-energy-food nexus: a new approach in support of food security and sustainable agriculture[R] . |
| [5] |
McCornick P. Interactions between water, energy, food and environment: Evolving perspectives and policy issues [J].https://doi.org/10.2166/wp.2008.048 URL [本文引用: 1] 摘要
Major changes are occurring with far reaching implications for the existing equilibria or disequilibria in the water-energy-food-environment interface. The increased demand of energy worldwide will reflect directly and indirectly on water-dependent systems. Direct implications will come from higher energy prices, which make extraction and conveyance of water more costly. Indirect implications will be in the form of demand for alternative energy sources. It triggers demand for hydropower and remains a major driver驴along with some environmental policies驴for biofuel expansion. The key question is how these effects may alter water allocation and influence food security, rural poverty and environmental sustainability. This paper sets the background and context of this special issue by highlighting some of the major water-related policy issues related to the subject and provides an overview and synthesis of the papers in this special issue. Besides offering insight into how these papers address these questions in the practical context of few selected countries and basins, this paper also indicates some key areas for future research on the subject
|
| [6] |
Considering the energy, water and food nexus: Towards an integrated modeling approach [J].https://doi.org/10.1016/j.enpol.2011.09.039 URL [本文引用: 1] 摘要
The areas of energy, water and food policy have numerous interwoven concerns ranging from ensuring access to services, to environmental impacts to price volatility. These issues manifest in very different ways in each of the three “spheres”, but often the impacts are closely related. Identifying these interrelationships a priori is of great importance to help target synergies and avoid potential tensions. Systems thinking is required to address such a wide swath of possible topics. This paper briefly describes some of the linkages at a high-level of aggregation – primarily from a developing country perspective – and via case studies, to arrive at some promising directions for addressing the nexus. To that end, we also present the attributes of a modelling framework that specifically addresses the nexus, and can thus serve to inform more effective national policies and regulations. While environmental issues are normally the ‘cohesive principle’ from which the three areas are considered jointly, the enormous inequalities arising from a lack of access suggest that economic and security-related issues may be stronger motivators of change. Finally, consideration of the complex interactions will require new institutional capacity both in industrialised and developing countries.
|
| [7] |
The water energy food security nexus: Challenges and opportunities for food security in South Africa [J].https://doi.org/10.1016/j.aqpro.2013.07.013 URL [本文引用: 1] 摘要
The interconnectedness of water, energy and food production cycles translates into the interdependence of water, energy and food pricing. This paper interrogates the level of interconnectedness between these systems in South Africa and discusses how energy and water costs influence food prices in the country and affect the country's level of food security. The paper emphasizes that sustainable solutions to food security necessitate integrative thinking in the process of strategic planning for these resources.
|
| [8] |
Governance of transitions towards sustainable development the Water-Energy-Food Nexus in Cyprus [J].https://doi.org/10.1080/02508060.2015.1070328 URL [本文引用: 1] 摘要
This paper presents a methodological framework to analyse sustainability innovations in the water–energy–food nexus and strategies for governing transition processes towards their widespread implementation. An application to a case study in Cyprus shows the interrelations of several sustainability innovations in the water, energy and food sectors, and specific learning requirements that need to be addressed to achieve a transition towards sustainable development. The framework helps to explore systematically responsibilities of different stakeholders for the implementation of innovations and thereby provides critical information for reflexive governance processes.
|
| [9] |
Rapid assessment of the water-energy-food-climate nexus in six selected basins of north africa and west Asia undergoing transitions and scarcity threats [J]. |
| [10] |
Tackling complexity: Understanding the food-energy-environment nexus in Ethiopia's Lake Tana sub-basin [J].
Ethiopia has embarked upon a rapid growth and development trajectory aiming to become a middle-income country by 2025. To achieve this goal, an agricultural development led industrialization strategy is being implemented which aims to intensify and transform agriculture, thereby boosting yields and, subsequently, economic returns. At the same time, the energy use which currently consists of more than 90% traditional biomass use is shifting towards increasing electricity production predominantly from large-scale hydropower plants, with the aim to improve access to modern energy sources. While the targets are commendable it is not clear that either all direct impacts or potential conflicts between goals have been considered. In this paper we evaluate and compare the impacts of alternative development trajectories pertaining to agriculture, energy and environment for a case-study location, the Lake Tana Subbasin, with a focus on current national plans and accounting for cross-sector interlinkages and competing resource use: the food-energy-environment nexus. Applying a nexus toolkit (WEAP and LEAP) in participatory scenario development we compare and evaluate three different future scenarios. We conclude that the two processes agricultural transformation and energy transition are interdependent and could be partly competitive. As agriculture becomes increasingly intensified, it relies on more energy. At the same time, the energy system will, at least in the foreseeable future, continue to be largely supported by biomass, partly originating from croplands. Two outstanding dilemmas pertaining to resources scarcity were identified. Water needed for energy and agricultural production, and to sustain ecosystem services, sometimes exceeds water availability. Moreover, the region seems to be hitting a biomass ceiling where the annual increments in biomass from all terrestrial ecosystems are in the same order of magnitude as biomass needs for food, fodder and fuel. We propose that a stakeholder-driven nexus approach, underpinned by quantitative and spatially explicit scenario and planning tools, can help to resolve these outstanding dilemmas and can support more consistent policy and decision making, towards improved resource productivities, lower environmental pressures and enhanced human securities.
|
| [11] |
Sharing benefits in Transboundary Rivers: An experimental case study of central Asian Water-Energy-Agriculture Nexus[J] .https://doi.org/10.3390/w7094778 URL [本文引用: 1] 摘要
Cooperation in transboundary river basins is challenged by the riparian countriesdiffering needs for water use. This is the case especially in Amu Darya Basin in Central Asia, where upstream Tajikistan is building the Rogun Hydropower Plant (RHP) to increase its energy security, while the downstream countries oppose the plant due to the feared negative impacts to their irrigated agriculture. Several experimental scenarios illustrate how the concept of benefit sharing could be used as a framework to investigate these water-energy-agriculture linkages in a transboundary context. Using a hydro-economic model, we investigate the economic benefits of various scenarios emphasizing agricultural and/or energy production, thus benefiting the riparian countries uniquely. Subsequently, we discuss how benefit-sharing arrangements with different forms of compensations could be used as a mechanism to facilitate transboundary cooperation. Our results indicate that several scenarios have a potential to increase the total energy-agriculture benefits in the basin. Yet, agreeing on the actual benefit-sharing mechanism between the countries poses special challenges as each may require countries to give up some of their anticipated maximum potential benefits. The presented scenarios provide a potential starting point for debates over benefit-sharing arrangements across countries needing to address the water-energy-agriculture nexus
|
| [12] |
Climate and southern Africa’s water-energy-food nexus [J].https://doi.org/10.1038/NCLIMATE2735 URL [本文引用: 1] 摘要
In southern Africa, the connections between climate and the water揺nergy揻ood nexus are strong. Physical and socioeconomic exposure to climate is high in many areas and in crucial economic sectors. Spatial interdependence is also high, driven, for example, by the regional extent of many climate anomalies and river basins and aquifers that span national boundaries. There is now strong evidence of the effects of individual climate anomalies, but associations between national rainfall and gross domestic product and crop production remain relatively weak. The majority of climate models project decreases in annual precipitation for southern Africa, typically by as much as 20% by the 2080s. Impact models suggest these changes would propagate into reduced water availability and crop yields. Recognition of spatial and sectoral interdependencies should inform policies, institutions and investments for enhancing water, energy and food security. Three key political and economic instruments could be strengthened for this purpose: the Southern African Development Community, the Southern African Power Pool and trade of agricultural products amounting to significant transfers of embedded water.
|
| [13] |
未来30年我国粮食,淡水,能源需求的系统仿真 [J].
本文以系统动力学为主要方法,对未来我国的人口总量和经济水平进行了预测,在此基础上对未来粮食、淡水和能源的需求规模进行了仿真,提炼出人口、经济与粮食、淡水和能源需求的关联模式,并进行了灵敏度分析,探讨了为确保粮食、水、能源安全所能采取的有效措施。
The system simulation of China’s grain, freshwater and energy demand in the next 30 years .
本文以系统动力学为主要方法,对未来我国的人口总量和经济水平进行了预测,在此基础上对未来粮食、淡水和能源的需求规模进行了仿真,提炼出人口、经济与粮食、淡水和能源需求的关联模式,并进行了灵敏度分析,探讨了为确保粮食、水、能源安全所能采取的有效措施。
|
| [14] |
水–能源–粮食关联关系:区域可持续发展研究的新视角 [J].
水-能源-粮食关联关系(WEF—Nexus)的研究正逐步发展成为可持续发展领域的重要课题,学术界和实践者们从各个方面对其进行了理论和实证探究。笔者从WEF—Nexus概念的重新界定开始,通过分析2006年以来WEF—Nexus的发展历程,并基于当前研究的基础理论差异,提出开展WEF-Nexus研究的两个基本观点,即“慢变量观”和“资源整合观”;回答了区域可持续发展中水-能源-粮食关联关系(WEF—Nexus)研究的两个基本问题,“什么是WEF-Nexus?”和“为什么是WEF—Nexus?”。在此基础上,笔者通过WEF—Nexus关系描述性研究及卖证研究的进展分析,从平面维度、时间空间维度和数据与工具的应用视角,指出该领域的核心研究议题、关键分析工具和未来面临的挑战。我们认为,要从新的视角认识WEF—Nexus领域理论与实证研究的前沿问题,其未来的研究应从注重实践经验的总结转向理论框架的构建,尤其要关注水、能源和粮食三者作为“慢变量”的理论证明,研究的维度也应由区域维度向城市维度转变,在研究方法上更多地借助系统动力学、复杂网络分析等系统科学的方法。
Water-energy-food nexus: New perspective on regional sustainable development .
水-能源-粮食关联关系(WEF—Nexus)的研究正逐步发展成为可持续发展领域的重要课题,学术界和实践者们从各个方面对其进行了理论和实证探究。笔者从WEF—Nexus概念的重新界定开始,通过分析2006年以来WEF—Nexus的发展历程,并基于当前研究的基础理论差异,提出开展WEF-Nexus研究的两个基本观点,即“慢变量观”和“资源整合观”;回答了区域可持续发展中水-能源-粮食关联关系(WEF—Nexus)研究的两个基本问题,“什么是WEF-Nexus?”和“为什么是WEF—Nexus?”。在此基础上,笔者通过WEF—Nexus关系描述性研究及卖证研究的进展分析,从平面维度、时间空间维度和数据与工具的应用视角,指出该领域的核心研究议题、关键分析工具和未来面临的挑战。我们认为,要从新的视角认识WEF—Nexus领域理论与实证研究的前沿问题,其未来的研究应从注重实践经验的总结转向理论框架的构建,尤其要关注水、能源和粮食三者作为“慢变量”的理论证明,研究的维度也应由区域维度向城市维度转变,在研究方法上更多地借助系统动力学、复杂网络分析等系统科学的方法。
|
| [15] |
水—能源—粮食纽带关系概述及对我国的启示 [J].https://doi.org/10.13928/j.cnki.wrdr.2016.05.019 URL [本文引用: 1] 摘要
近年来,国际社会十分关注"水—能源—粮食"之间的纽带关系。文章梳理了"纽带关系"这一概念的提出与发展,提炼了其核心内容,总结了国际社会对"纽带关系"概念的相关拓展及应用,并对我国相关领域政策制定提出了启示与建议。
Overview of water-energy-food nexus and implications for China .https://doi.org/10.13928/j.cnki.wrdr.2016.05.019 URL [本文引用: 1] 摘要
近年来,国际社会十分关注"水—能源—粮食"之间的纽带关系。文章梳理了"纽带关系"这一概念的提出与发展,提炼了其核心内容,总结了国际社会对"纽带关系"概念的相关拓展及应用,并对我国相关领域政策制定提出了启示与建议。
|
| [16] |
水资源的有效规划将结合能源,粮食采取三位一体的思考方式 [J].A trinity of thinking: The effective planning of water resources will combine energy and food . |
| [17] |
区域“水–土–能–碳”耦合作用机制分析 [J].The coupling interaction mechanism of regional water-land-energy-carbon system . |
| [18] |
全球气候变化背景下跨界流域水、能源和粮食安全的合作 [J].
国家、地区社会经济发展议程涉及到水、能源和粮食安全问题。全世界约40%的人口在跨界流域居住,许多与跨界相关的发展问题也随之衍生。湄公河委员会举行了一次国际会议,分享学习了跨界水资源开发管理的全球性经验。作为湄公河委员会会议的删节版报告,重点介绍了跨界流域的可持续发展、跨界背景下适应气候变化的有效策略,阐述了针对跨界合作的新方法,并涉及到适应气候措施的长期承诺以及加强利益相关者之间的政策对话等。
Cooperation on water, energy and food security in transboundary river basins in the global climate change .
国家、地区社会经济发展议程涉及到水、能源和粮食安全问题。全世界约40%的人口在跨界流域居住,许多与跨界相关的发展问题也随之衍生。湄公河委员会举行了一次国际会议,分享学习了跨界水资源开发管理的全球性经验。作为湄公河委员会会议的删节版报告,重点介绍了跨界流域的可持续发展、跨界背景下适应气候变化的有效策略,阐述了针对跨界合作的新方法,并涉及到适应气候措施的长期承诺以及加强利益相关者之间的政策对话等。
|
| [19] |
There are conflicts over water, energy and food in China and the United States . |
| [20] |
中国不同地区水—能源—粮食投入产出效率评价研究 [J].
水、能源、粮食(WEF)是生产生活的基本要素。文章将三者视为一个相互依赖的系统,构建了以“用水总量、能源消费量、粮食消费支出、常住人口”作为输入变量,以“人均GDP、环境污染指数”作为输出变量的评价指标体系。并采用数据包络分析方法,从静态截面、动态时序及动静对比三个角度,评价了2005~2015年中国30个地区的WEF投入产出效率。结果显示,目前我国大部分地区的DEA效率值较低,管理和技术水平亟待提高。
Evaluation on efficiency of the input and output of water-energy-food in different regions of China .
水、能源、粮食(WEF)是生产生活的基本要素。文章将三者视为一个相互依赖的系统,构建了以“用水总量、能源消费量、粮食消费支出、常住人口”作为输入变量,以“人均GDP、环境污染指数”作为输出变量的评价指标体系。并采用数据包络分析方法,从静态截面、动态时序及动静对比三个角度,评价了2005~2015年中国30个地区的WEF投入产出效率。结果显示,目前我国大部分地区的DEA效率值较低,管理和技术水平亟待提高。
|
| [21] |
北京市水–能源–粮食可持续发展系统动力学模型构建与仿真 [J].
<p>资源与环境是人类生存和发展的重要基础。北京是中国的政治文化中心,资源高度依赖外省市供应,随着需求的不断增加,其可持续发展将面临更加严峻的挑战。本研究通过构建以水-能源-粮食(W-E-F)三者为主体并涵盖社会、经济和环境子系统的复杂系统因果关联网络;运用系统动力学仿真技术,实现了对北京市水-能源-粮食关联(W-E-F Nexus)系统的动力学仿真模拟,预测了北京市W-E-F变化趋势,并开展了W-E-F Nexus系统敏感性分析。研究发现2020年水资源消耗总量预计超过38亿吨;能源供应数量预计不足2600万吨标准煤,地热能等清洁一次能源供应逐渐占据主导地位,能源消费总量预计下降至6865万吨标准煤,其中超过62%的能源消耗将依赖省外调入;粮食消费总量预计将超过730万吨,粮食单产数量在2014-2016年经过短暂调整后开始持续提升,到2020年每公顷产量预计将超过7800公斤,粮食自给率经过调整将再度恢复到2012年20%的水平;能源系统是现阶段提升北京W-E-F综合可持续发展能力的突破口;相比于单一资源政策,基于非资源系统的决策行为影响效果将更为深广。</p>
Establishment and simulation study of system dynamic on sustainable development of Water-energy-food nexus in Beijing .
<p>资源与环境是人类生存和发展的重要基础。北京是中国的政治文化中心,资源高度依赖外省市供应,随着需求的不断增加,其可持续发展将面临更加严峻的挑战。本研究通过构建以水-能源-粮食(W-E-F)三者为主体并涵盖社会、经济和环境子系统的复杂系统因果关联网络;运用系统动力学仿真技术,实现了对北京市水-能源-粮食关联(W-E-F Nexus)系统的动力学仿真模拟,预测了北京市W-E-F变化趋势,并开展了W-E-F Nexus系统敏感性分析。研究发现2020年水资源消耗总量预计超过38亿吨;能源供应数量预计不足2600万吨标准煤,地热能等清洁一次能源供应逐渐占据主导地位,能源消费总量预计下降至6865万吨标准煤,其中超过62%的能源消耗将依赖省外调入;粮食消费总量预计将超过730万吨,粮食单产数量在2014-2016年经过短暂调整后开始持续提升,到2020年每公顷产量预计将超过7800公斤,粮食自给率经过调整将再度恢复到2012年20%的水平;能源系统是现阶段提升北京W-E-F综合可持续发展能力的突破口;相比于单一资源政策,基于非资源系统的决策行为影响效果将更为深广。</p>
|
| [22] |
区域水-能源-粮食耦合协调演化特征研究——以江苏省为例 [J].
随着我国淡水资源减少,能源需求增加,粮食供给的不确定性愈加严重。以江苏省为研究对象,通过构建水资源-能源-粮食(W-E-F)系统耦合协调评价指标体系,采用熵值法对各子系统指标赋权,利用耦合协调模型进行对协调发展水平进行定量评价,并基于灰色GM(1.1)模型预测未来5年的耦合协调度。结果表明:江苏省2000-2015年W-E-F系统的综合评价指数整体上随时间呈上升趋势;耦合度基本保持高水平耦合;耦合协调度呈倒“U”型曲线,经历了初级协调、勉强协调、中级协调3个阶段,并在未来5年内向良好协调类过渡。但水资源与能源的发展水平仍滞后于粮食,故提高水与能源的利用效率,以促进区域的可持续发展。
The evolutionary and characteristics analysis of the coupling and coordination among water, energy and food: Taking Jiangsu province as an example .
随着我国淡水资源减少,能源需求增加,粮食供给的不确定性愈加严重。以江苏省为研究对象,通过构建水资源-能源-粮食(W-E-F)系统耦合协调评价指标体系,采用熵值法对各子系统指标赋权,利用耦合协调模型进行对协调发展水平进行定量评价,并基于灰色GM(1.1)模型预测未来5年的耦合协调度。结果表明:江苏省2000-2015年W-E-F系统的综合评价指数整体上随时间呈上升趋势;耦合度基本保持高水平耦合;耦合协调度呈倒“U”型曲线,经历了初级协调、勉强协调、中级协调3个阶段,并在未来5年内向良好协调类过渡。但水资源与能源的发展水平仍滞后于粮食,故提高水与能源的利用效率,以促进区域的可持续发展。
|
| [23] |
黄河流域水资源-能源-粮食的协同优化 [J].
黄河流域是中国重要能源和粮食主产区,然而水资源短缺已成为制约能源、粮食发展的关键要素。为优化流域水资源、能源、粮食之间的关系,引入协同学原理构建水资源-能源-粮食整体分析框架,建立具有总分结构、互馈关联的协同优化模型,采用多要素均衡智能算法,提出黄河流域粮食生产、能源开发与水资源调配一体优化的布局方案。结果表明,通过水资源-能源-粮食协同优化,2030年增加流域供水量23.98亿m3;优化了流域粮食生产布局,人均粮食产量提高12%;优选了能源产业规模和结构,煤炭开采、石油加工和火电总装机分别增加了2.86倍、4.08倍和0.80倍;在满足生活、生态环境用水的同时实现了粮食增收、能源增产。
Study on water-energy-food collaborative optimization for Yellow river basin .
黄河流域是中国重要能源和粮食主产区,然而水资源短缺已成为制约能源、粮食发展的关键要素。为优化流域水资源、能源、粮食之间的关系,引入协同学原理构建水资源-能源-粮食整体分析框架,建立具有总分结构、互馈关联的协同优化模型,采用多要素均衡智能算法,提出黄河流域粮食生产、能源开发与水资源调配一体优化的布局方案。结果表明,通过水资源-能源-粮食协同优化,2030年增加流域供水量23.98亿m3;优化了流域粮食生产布局,人均粮食产量提高12%;优选了能源产业规模和结构,煤炭开采、石油加工和火电总装机分别增加了2.86倍、4.08倍和0.80倍;在满足生活、生态环境用水的同时实现了粮食增收、能源增产。
|
| [24] |
|
| [25] |
|
| [26] |
|
| [27] |
|
| [28] |
中国环境污染的健康压力时空差异特征 [J].
构建基于环境污染的人口健康压力指数模型,引入空间集聚和收敛性检验方法,对中国各省区2005~2014年的污染健康压力的时空差异特征进行研究,结果表明:①2005-2014年各省区的污染健康压力指数发生明显下降,省际差异程度有所降低,但“东高、西低、中部居中”的基本格局没有变化。②各省区健康压力指数的空间分布在宏观上呈现出一定的空间集聚性,集聚趋势随时间有所弱化。③在控制城市化率、人均GDP、人口死亡率、森林覆盖率等变量的条件下,考察时段内各省区健康压力指数变化存在微弱的收敛性,各省区的健康压力预期将逐步趋同于某一较低水平。
Spatio-temporal difference characteristic of pollution’s health stress of China .
构建基于环境污染的人口健康压力指数模型,引入空间集聚和收敛性检验方法,对中国各省区2005~2014年的污染健康压力的时空差异特征进行研究,结果表明:①2005-2014年各省区的污染健康压力指数发生明显下降,省际差异程度有所降低,但“东高、西低、中部居中”的基本格局没有变化。②各省区健康压力指数的空间分布在宏观上呈现出一定的空间集聚性,集聚趋势随时间有所弱化。③在控制城市化率、人均GDP、人口死亡率、森林覆盖率等变量的条件下,考察时段内各省区健康压力指数变化存在微弱的收敛性,各省区的健康压力预期将逐步趋同于某一较低水平。
|
| [29] |
水资源承载能力评价方法研究及应用 [J].An evaluation method of water resources carrying capacity and application . |
| [30] |
中国耕地压力的空间分异及社会经济因素影响—基于342个地级行政区的面板数据 [J].
以342个地级行政区为基本单元,利用耕地压力指数、GDI指数、空间自相关、平均增长指数等方法分析2001-2013年中国耕地压力的时空分异格局与过程;在粮食生产因素基础上重点分析社会经济因素对耕地压力变动的影响。结果表明:①2001年以来中国耕地压力状况逐渐减轻,但空间分异程度扩大、空间集聚趋势增强;②中国耕地压力格局总体稳定、局部变化,南北分化趋势显著;③耕地质量是决定中国耕地压力的基础性因素,农民收入、产业结构和经济水平等社会经济因素对耕地压力变动有更为显著的影响,作用超过了粮食生产投入因素。
Spatial differentiation of cropland pressure and its socio-economic factors in China based on panel data of 342 prefectural-level units .
以342个地级行政区为基本单元,利用耕地压力指数、GDI指数、空间自相关、平均增长指数等方法分析2001-2013年中国耕地压力的时空分异格局与过程;在粮食生产因素基础上重点分析社会经济因素对耕地压力变动的影响。结果表明:①2001年以来中国耕地压力状况逐渐减轻,但空间分异程度扩大、空间集聚趋势增强;②中国耕地压力格局总体稳定、局部变化,南北分化趋势显著;③耕地质量是决定中国耕地压力的基础性因素,农民收入、产业结构和经济水平等社会经济因素对耕地压力变动有更为显著的影响,作用超过了粮食生产投入因素。
|
| [31] |
基于STIRPIT模型的中国能源压力分析基于空间计量经济学模型的视角 [J].China’s energy stress based on the STIRPIT model: A spatial econometric perspective . |
| [32] |
基于粮食发展指数的我国粮食生产发展变化和区域差异分析 [J].https://doi.org/10.15889/j.issn.1002-1302.2017.14.066 URL [本文引用: 1] 摘要
在分析近9年我国粮食生产变化态势基础上,构建粮食发展指数模型,计算我国省级单位的粮食发展指数,比较不同省级单位在粮食发展方面的区域差异,并针对不同变化原因提出建议与对策.结果表明:(1)自2003年以来,我国粮食总产量和人均粮食产量整体呈增长态势,人均粮食产量达到400 kg的营养安全要求,粮食供需处于低水平的紧平衡状态下;(2)粮食发展水平最高的4个省级单位,区域粮食播种面积、单位播种面积产量、人均粮食产量均提高较快,2011年人均粮食产量为营养安全标准的2.26倍,为国家粮食生产和提供余粮作出重大贡献;(3)粮食发展水平居中的10个省级单位,在粮食播种面积、单位播种面积产量、人均粮食产量等方面的增长速度均处于中等水平,人均粮食产量略有盈余.此区今后在播种面积提高方面潜力有限,增产方面须要加大经济和科技投入,在单位播种面积产量提高上实现突破,才有望在今后的粮食生产中提高本区的地位和作用;(4)粮食发展水平最低的17个省级单位,粮食播种面积总体呈减少趋势,单位播种面积产量提高速度较低,人均粮食产量增长总体较低,其中较多单位人均粮食产量呈减少态势.这17个省级单位2011年人均粮食仅为251 kg,远远低于营养安全要求,须大量由外区调入粮食.此区人口稠密,今后在播种面积提高方面潜力有限,增产方面由于基数较低,加大经济和科技投入,大力提高单位播种面积产量是提高粮食自给程度,承担国家粮食安全责任的重要途径.
Analysis of China's food production development change and regional differences based on food development index .https://doi.org/10.15889/j.issn.1002-1302.2017.14.066 URL [本文引用: 1] 摘要
在分析近9年我国粮食生产变化态势基础上,构建粮食发展指数模型,计算我国省级单位的粮食发展指数,比较不同省级单位在粮食发展方面的区域差异,并针对不同变化原因提出建议与对策.结果表明:(1)自2003年以来,我国粮食总产量和人均粮食产量整体呈增长态势,人均粮食产量达到400 kg的营养安全要求,粮食供需处于低水平的紧平衡状态下;(2)粮食发展水平最高的4个省级单位,区域粮食播种面积、单位播种面积产量、人均粮食产量均提高较快,2011年人均粮食产量为营养安全标准的2.26倍,为国家粮食生产和提供余粮作出重大贡献;(3)粮食发展水平居中的10个省级单位,在粮食播种面积、单位播种面积产量、人均粮食产量等方面的增长速度均处于中等水平,人均粮食产量略有盈余.此区今后在播种面积提高方面潜力有限,增产方面须要加大经济和科技投入,在单位播种面积产量提高上实现突破,才有望在今后的粮食生产中提高本区的地位和作用;(4)粮食发展水平最低的17个省级单位,粮食播种面积总体呈减少趋势,单位播种面积产量提高速度较低,人均粮食产量增长总体较低,其中较多单位人均粮食产量呈减少态势.这17个省级单位2011年人均粮食仅为251 kg,远远低于营养安全要求,须大量由外区调入粮食.此区人口稠密,今后在播种面积提高方面潜力有限,增产方面由于基数较低,加大经济和科技投入,大力提高单位播种面积产量是提高粮食自给程度,承担国家粮食安全责任的重要途径.
|
| [33] |
Assessment of spatiotemporal varying relationships between rainfall, land cover and surface water area using geographically weighted regression [J].https://doi.org/10.1007/s10666-011-9289-8 URL [本文引用: 1] 摘要
Traditional regression techniques such as ordinary least squares (OLS) are often unable to accurately model spatially varying data and may ignore or hide local variations in model coefficients. A relatively new technique, geographically weighted regression (GWR) has been shown to greatly improve model performance compared to OLS in terms of higher R 2 and lower corrected Akaike information criterion (AIC C ). GWR models have the potential to improve reliabilities of the identified relationships by reducing spatial autocorrelations and by accounting for local variations and spatial non-stationarity between dependent and independent variables. In this study, GWR was used to examine the relationship between land cover, rainfall and surface water habitat in 149 sub-catchments in a predominately agricultural region covering 2.6 million ha in southeast Australia. The application of the GWR models revealed that the relationships between land cover, rainfall and surface water habitat display significant spatial non-stationarity. GWR showed improvements over analogous OLS models in terms of higher R 2 and lower AIC C . The increased explanatory power of GWR was confirmed by the results of an approximate likelihood ratio test, which showed statistically significant improvements over analogous OLS models. The models suggest that the amount of surface water area in the landscape is related to anthropogenic drainage practices enhancing runoff to facilitate intensive agriculture and increased plantation forestry. However, with some key variables not present in our analysis, the strength of this relationship could not be qualified. GWR techniques have the potential to serve as a useful tool for environmental research and management across a broad range of scales for the investigation of spatially varying relationships.
|

/
| 〈 |
|
〉 |

