黄群芳 , 陆玉麒
, 陆玉麒
Huang Qunfang, Lu Yuqi
中图分类号: P463.3
文献标识码: A
文章编号: 1000-0690(2018)10-1715-09
收稿日期: 2017-12-23
修回日期: 2018-07-17
网络出版日期: 2018-12-12
版权声明: 2018 《地理科学》编辑部 本文是开放获取期刊文献,在以下情况下可以自由使用:学术研究、学术交流、科研教学等,但不允许用于商业目的.
基金资助:
作者简介:
作者简介:黄群芳(1979-),女,湖南益阳人,博士,主要从事城市热岛效应与城市宜居研究。E-mail: flyingfangzi@163.com
展开
摘要
选择北京地区为研究区,基于1967~2016年城市站(北京站)和城郊农村站(密云站)的长期气象观测数据,研究平均气温、最高气温、最低气温对应的城市热岛强度长期变化特征及其气候学影响机制。研究发现,过去50 a平均气温和最低气温对应的城市热岛强度显著增加,增温率分别为0.29℃/10a和0.45℃/10a,而最高气温对应的城市热岛强度则没有明显变化趋势;统计分析显示过去50 a北京地区相对湿度、风速和日照时数显著降低以及气温显著上升有利于城市热岛的形成,强化城市热岛强度;未来全球变暖和快速城市化背景下北京地区城市热岛效应将进一步加剧,形成更频繁和持续时间更长的夏季城市高温热浪,严重危及城市居民生产生活和生命健康。
关键词:
Abstract
Urban heat island (UHI) has an important effect on urban eco-environment, living and production, and physical and mental health of the residents. In addition, urban warming especially summer heat wave caused by UHI significantly affects many aspects of the global economy, such as energy and water consumption, transportation, and social economy. Understanding of long-term trend of urban heat island intensity and its climatological driving mechanism will help the rational urban planning, urban livable construction, and urban sustainable development. Beijing is the center of the Beijing-Tianjin-Hebei metropolitan area, and has experienced a rapid urbanization process in the past few decades. This study aims to elucidate the long-term trends of UHI intensities of mean air temperature, minimum air temperature, and maximum air temperature and the climatological driving mechanism based on 50 years (1967-2016) meteorological observation data from urban station (Beijing station) and rural station (Miyun station). In the past five decades, the UHI intensities of mean air temperature, and minimum air temperature showed a significant increasing trend with the increasing rates of 0.29℃/decade (r2=0.59, P<0.001) and 0.45℃/decade (r2=0.62, P<0.001) respectively. In contrast, no marked variability trend was observed for the UHI intensities of maximum air temperature. Statistical analysis has shown that relative humidity, wind speed, and sunshine duration decreased significantly and air temperature increased significantly in Beijing over the past 50 years, which is conducive to the formation of UHI and the enhancement of UHI intensity. Multiple stepwise linear regressions showed that relative humidity, maximum wind speed, and atmospheric pressure were the key climatological factors controlling UHI intensities of mean air temperature and minimum air temperature, which could explain 92.4% and 87.6% of variabilities respectively. Atmospheric pressure, relative humidity, and sunshine duration were the key climatological factors controlling UHI intensities of maximum air temperature. Under the background of global warming and rapid urbanization, UHI effect in Beijing will further intensify, resulting in more frequent and prolonged summer urban heat waves, which will seriously endanger urban residents' production, life and health. Therefore, it is necessary to consider the effects of UHI on the future urban planning and construction. By optimizing urban layout, carrying out reasonable road system planning, energy planning and ecosystem planning and other measures, we can alleviate UHI effects and reduce high temperature and heat waves harm caused by UHI.
Keywords:
IPCC第五次评估报告表明,近60 a来地面气温每十年上升0.12℃,约为过去100 a气温增温率的2倍[1]。相对于全球气候变暖,作为土地利用/土地覆盖变化最激烈形式的城市地区经历了更剧烈的增温[2,3,4],形成了城市气温显著高于周边乡村和郊区的城市热岛现象。城市热岛效应广泛存在于全球各类、各级别城市中,据研究,全球超过1 100个城市、中国98.9%的城市都观测到了城市热岛效应[5,6]。在当前城市快速发展的背景下,2050年全球城市化率将达到70%[7],未来的城市热岛效应强度和发生范围将进一步强化,可以预见,城市热岛将成为当今世界面临的巨大挑战。因此,在城市热岛效应被发现的100多年时间内,国内外不同领域包括气象、城市规划、环境保护、园林设计和医疗卫生等专家学者从各个角度对城市热岛的形成和生态环境效应开展了大量的研究。在Web of Science数据库以“Urban heat island”作为关键词进行检索,1997~2016年与城市热岛相关的研究论文呈现快速增长态势,由1997年的20篇左右增加到2016年的500余篇,翻了近30倍。
相对于全球气候变暖,居民更容易受到区域和地区气候热环境的影响,如全球变暖速度最快的10 a(2003~2012年)温度增长了0.78℃(相对于1850~1900年),而城市热岛带来的短时增温可达15.4℃[1,8]。城市高温会加剧大气环境污染、促进流行病的爆发、加剧夏季高温热浪,从而对区域生态环境、人们生活健康带来重要的影响[9,10,11],甚至会造成重大人员伤亡[12,13,14]。此外,热岛带来的城市增温特别是极端高温热浪还会影响能源、交通、水消费和社会经济生活的各个方面[15]。因此,研究城市热岛的形成机制及对策建议对于区域气候变化的响应和适应、全球社会经济生活和城市生态系统的健康、持续发展至关重要[16]。
已有的研究表明日最大热岛强度发生在反气旋、静风、少云的夜晚[17,18],有研究基于此理想条件筛选出的气象数据进行了城市热岛效应的气候学机制分析[19,20,21],但关于正常大气状态对城市热岛效应的长时间作用机制的认识还存在不足。有研究通过对城市热岛效应案例进行强弱分组并与气象条件进行关联来探讨气象因素对城市热岛效应的影响[22],但研究结果一定程度上也混淆了其他环境因素对城市热岛的影响。此外,一些研究通过对比典型强热岛日和弱热岛日地面气象要素的变化来得到影响城市热岛形成、减弱和消失的核心气象因子[23],加强了典型气象要素对城市热岛效应发生、发展的认识,但有限的数据限制了结果的说服力。因此,迫切需要丰富不同气候区、不同等级城市的城市热岛强度长期变化数据集和成因机制解释。
北京是京津冀城市群的核心城市,过去的许多研究已显示北京城区是典型的“热岛”,其热岛强度比中国沿海城市明显,其结果是造成北京冬季寒冷期缩短和夏季炎热期增强,未来城市高温热浪等灾害更加频繁[13,24,25],但关于其长期气候学形成机制还不甚明了。因此,本文选择城市化快速发展的北京地区为研究对象非常具有代表性,基于1967~2016年长期气象观测数据,研究城市热岛强度长期变化特征,筛选和厘清其影响的主要气象因子,构建基于主要气象因子的城市热岛强度估算模型,以更好服务于区域气候变化的响应和适应研究,也为城市规划、园林景观设计和城市高温热浪的应对管理提供科学依据。
研究基于城区的北京站和郊区的密云站开展研究,其中北京站(116°28′E,39°48′N,海拔31.3 m)位于北京市东南部高度城市化区域,周边高楼大厦环绕,土地利用以工业用地为主,是典型的城市站(图1a)。密云站(116°52′E,40°23′N,海拔71.8 m)位于北京市东北部临近森林和水库的远郊区,周围建筑多为低矮平房(图1a),土地利用以农业用地和森林用地为主,属于典型乡村站(图1a)。此外,基于中国科学院资源环境科学数据中心(http://www.resdc.cn/)提供的2010年人口分布数据也可以发现北京站人口密度显著高于密云站,其分别能作为城市站和乡村站代表(图1b)。由于2个站点海拔高度非常接近,因此本研究在开展比较分析时没有对数据进行海拔校正。
图1 气象站位置和北京市土地利用类型(a)及总人口(b)空间分布
Fig.1 Location of two meteorological stations and distributions of land use type (a) and total population (b) in Beijing City
1957~2016年2个站点长期日观测数据均来自于中国气象局下属的中国气象数据网(http://data.cma.cn/[2017-08-16])。考虑到1957~1966年日最大风速缺测较多,为了保证数据的连续性、一致性和完整性,选取1967~2016年数据进行研究。此外,中国气象局对中国气象数据网公布的数据进行严格质量控制,校正和调整了数据的不连续性,以确保资料的代表性、准确性和可比性[26,27],也被广泛应用于各类研究和气候变化评价中[21,23~25]。
城市热岛强度通过城区的北京站气温减去郊区的密云站气温得到,分别计算获得年日平均气温、年日最高气温和年日最低气温分别对应的城市热岛强度。在探讨城市热岛强度长期变化的气候学影响机制时,仅考虑利用城区北京站各气象要素与城市热岛强度进行趋势和统计相关分析。
采用SPSS 16.0软件对数据结果进行统计分析,包括线性趋势拟合,单要素线性相关分析和逐步多元线性回归分析。单要素线性相关分析用于阐明城市热岛强度与气象要素间是否存在显著相关,而多元线性回归分析用于从众多气象要素中遴选出影响最显著的关键气象要素,用于城市热岛强度的预测。
采用ArcGIS 9.2绘制北京地区土地利用和人口空间分布图,利用Origin 8.5软件绘制其他数据图。
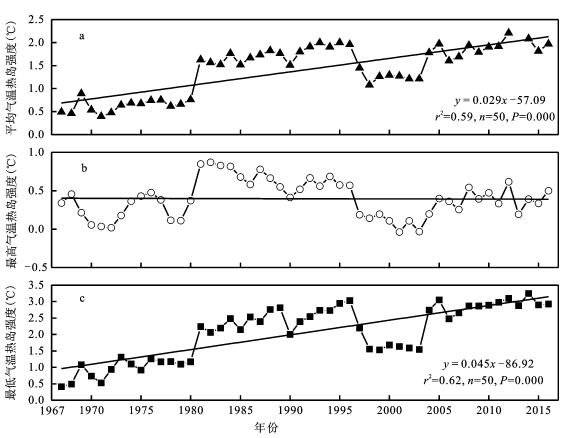
北京城区和密云站长期气温观测数据显示,北京地区存在明显的城市热岛效应(图2)。整体而言过去50 a北京地区平均气温和最低气温对应的热岛强度显著增加,热岛强度增温率分别为0.29℃/10a和0.45℃/10a,城市夜间增温更明显(图2a、2c)。可以看出,不同时段城市热岛强度变化也存在一些波动,未表现出均一的增加趋势,如1980年之前是一个缓慢的增加过程,1980年之后城市热岛强度快速增加,在1997~2003年城市热岛强度曾出现停滞甚至有时下降,但在2004年后又呈现逐渐增加趋势。此外,2011~2016年北京地区城市最低气温热岛强度为3.01℃(图2c),说明当前城区夜间气温比乡村要高3℃,这一数值与以往关于北京城市热岛强度研究结果较为一致[28]。相反,过去50 a白天最高气温对应的热岛强度变化不大,没有显著的增加趋势,城市和乡村站最高气温相差约0.5℃(图2b)。
图2 日平均气温(a)、日最高气温(b)和日最低气温(c)计算得到的城市热岛强度长期变化
Fig.2 Long-term trends of urban heat island intensities of daily mean temperature (a), daily maximal temperature (b), and daily minimal temperature (c)
北京地区夜间最低气温城市热岛强度明显高于白天最高气温城市热岛强度这一研究结论与国际上同类研究结果一致[17,29],平均气温城市热岛强度0.29℃/10a的增温率与雅典平均气温城市热岛强度0.21~0.22℃/10a的增温率比较接近[29]。此外,北京作为世界上快速城市化地区和大都市聚集区,其目前城市热岛强度与国际上已高度城市化的大都市聚集区比较接近[30],如日本东京都市区20世纪90年代初,晴朗静风的夏季夜间城市热岛强度为3℃,白天的城市热岛强度为1.0℃[31,32],同样在欧洲雅典,夜间最低气温热岛强度在3℃以上[29],而在纽约都市区夏秋季城市热岛强度为3℃,冬春季为4℃[33]。但与一些中小城市相比,北京地区城市热岛强度要明显高得多,如临近的廊坊市晴朗无风时城市平均热岛强度最大,只有1.25℃[19],而济宁市城市热岛强度仅为0.79℃[20],反映了随着城市等级和密集程度的增加,城市热岛强度明显增加,相应的未来受夏季城市高温热浪影响的风险也在增加。
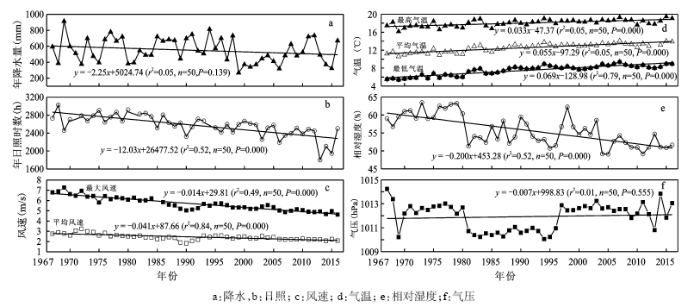
城市热岛的形成与气象条件密切相关,晴朗少云、静风、气压梯度小等天气条件会促进城市热岛效应的形成和发展[34,35]。反过来,城市化建设改变了城市的下垫面状况,坚硬、不透水下垫面的增加及建筑物的增多、增密、增高,导致城市下垫面粗糙度增大,也会改变城市的风速、相对湿度和气温等气象条件进而影响到城市热岛效应。北京城区站长期气象观测数据显示,过去50 a北京市气象条件也发生了明显变化,主要表现为日照时数、风速和相对湿度的显著降低(图3b、3c、3e),和平均气温、最低气温和最高气温的显著增加(图3d);北京市的降水和气压呈现轻微降低趋势(图3a、3f),但统计检验显示不显著。日照时数显著下降与全球变暗和北京地区雾霾污染密切相关[36,37],而风速的显著降低与全国范围内南北增温差异以及城市建筑物引起地面粗糙度变化有关[38,39]。
城市热岛强度主要受3方面因素影响:① 城市物理与形态特征,包括城市建筑材料的反射率、城市街谷结构、城市周边地形、城市用地组成;② 气象条件,包括风速、云量、相对湿度、降水、大气稳定性、热对流状况等;③ 人为热排放:工业能源消费产生的热量、交通道路车辆废热、居民生活排热及人类自身新陈代谢产生的热量。在既定城市下垫面条件下,一定时间点的热岛强度主要受背景气候和天气条件的影响,因此本文主要分析城市热岛强度与主要气象要素间的相关性,探讨城市热岛强度长期变化的气候学影响机制。
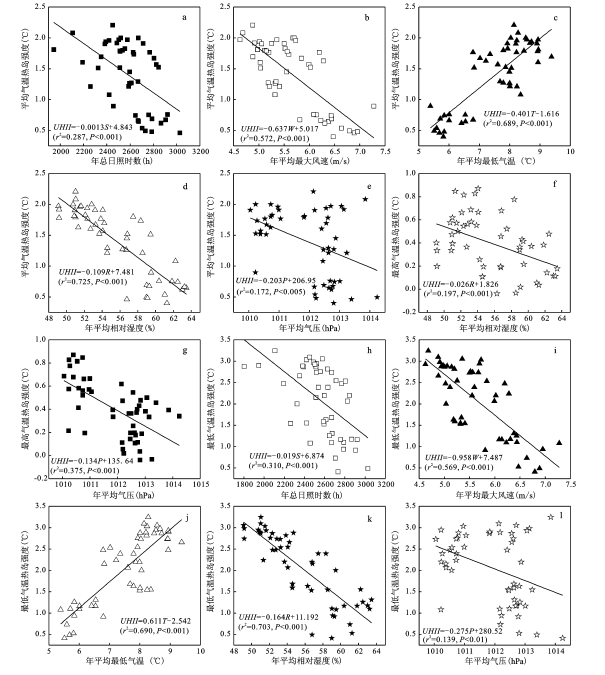
根据线性相关分析结果,对于平均气温和最低气温热岛强度而言,除了降水以外的其他气象要素均与之存在显著线性关系,其中与相对湿度线性相关的决定系数最高,其次是最低温、平均温、最大风速和平均风速;相比较而言,最大风速线性相关决定系数要高于平均风速,最低气温线性相关决定系数要高于平均气温和最高气温(表1、图4)。而对于最高气温热岛强度,只有相对湿度和平均气压与之存在显著线性关系,且与平均气压的相关性更好(表1、图4)。整体而言,城市热岛强度与日照时数、风速、相对湿度和气压存在负相关,而与气温则存在正相关。据IPCC第五次报告情景预估未来全球气候将继续变暖[1],因此在未来全球变暖背景下,可以预见北京城市化过程中城市热岛效应还将进一步加强,进而强化夏季城市高温热浪强度、频次和持续时间,给城市居民健康带来极大危害[13,40]。因此,未来城市规划和建设中应充分考虑城市热岛效应影响,通过优化城市布局、进行合理道路系统规划、能源规划和生态系统规划等措施减缓城市热岛效应影响。
表1 城市热岛强度与城区北京站主要气象要素间的线性相关决定系数和显著性水平
Table 1 Determination coefficient and significance level of linear relationships between urban heat island intensity of daily mean temperature, daily maximal temperature, and daily minimal temperature and main meteorological factors of urban station (Beijing station)
| 降水 | 日照时数 | 平均风速 | 最大风速 | 平均气温 | 最高气温 | 最低气温 | 平均相对湿度 | 平均气压 | ||
|---|---|---|---|---|---|---|---|---|---|---|
| 平均温热岛强度 | r2 | 0.001 | 0.287 | 0.521 | 0.572 | 0.591 | 0.323 | 0.689 | 0.725 | 0.172 |
| P | 0.824 | 0.000 | 0.000 | 0.000 | 0.000 | 0.000 | 0.000 | 0.000 | 0.003 | |
| 最高温热岛强度 | r2 | 0.047 | 0.030 | 0.077 | 0.008 | 0.027 | 0.023 | 0.032 | 0.197 | 0.375 |
| P | 0.129 | 0.244 | 0.052 | 0.542 | 0.259 | 0.292 | 0.215 | 0.001 | 0.000 | |
| 最低温热岛强度 | r2 | 0.001 | 0.310 | 0.484 | 0.569 | 0.579 | 0.303 | 0.690 | 0.703 | 0.139 |
| P | 0.859 | 0.000 | 0.000 | 0.000 | 0.000 | 0.000 | 0.000 | 0.000 | 0.008 |
图4 城市热岛强度与气象要素关系
Fig.4 Linear relationships between urban heat island intensities and climatological factors
为进一步遴选影响城市热岛强度的关键气象要素,本文对城市热岛强度与主要气象要素进行了逐步多元回归分析,考虑到最大风速和最低气温相关性要更好,多元线性逐步回归风速和气温分别取最大风速和最低气温进行分析。结果表明,影响平均气温和最低气温热岛强度的核心气象要素依次是相对湿度、最大风速和气压,3个要素对城市热岛强度的总解释率分别为92.4%和87.6%。而对于最高气温热岛强度,影响最大的气象要素依次是气压、相对湿度和日照时数,3个要素对城市热岛强度的总解释率52.5%。与单要素线性相关分析相比,多元逐步回归遴选出来的3个关键气象要素对城市热岛强度的解释率显著上升(表1),特别是平均气温和最低气温城市热岛强度的解释率都在87%以上,由此得到如下多元线性回归模型,以便对未来城市热岛强度进行预测。
UHIIMean=-0.065RH-0.397WSMax-0.160AP+
168.90 (r2=0.924,P<0.001,n=50) (1)
UHIIMin=-0.101RH-0.572WSMax-0.201AP+
213.93 (r2=0.876,P<0.001,n=50) (2)
式中,UHIIMean、UHIIMin分别为平均气温和最低气温城市热岛强度,RH、WSMax和AP分别为北京城市站平均相对湿度、最大风速和平均气压。
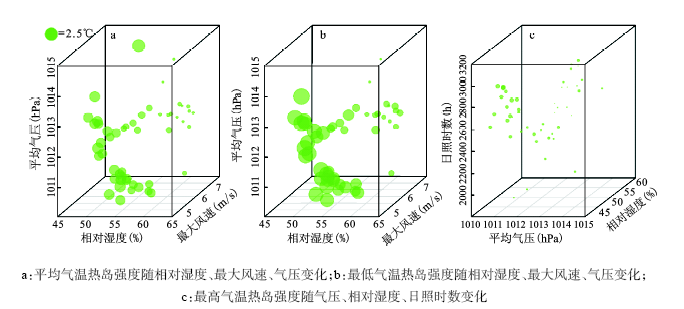
为了描述3个气象要素对城市热岛强度的组合影响,本文研究了平均气温、最低气温和最高气温城市热岛强度随3个关键气象要素的变化(图5)。图中显示城市热岛强度与3个关键气象要素均呈负相关关系,相对干燥的空气、静风、微风条件有利于城市热岛效应的形成,对应的城市热岛强度大。综合起来,相对湿度、最大风速和气压是影响北京城市热岛强度的关键气象要素。相对湿度、风速和云量是影响城市热岛强度的关键气象要素[17,30],因云量数据的缺失无法判断其对北京市城市热岛强度的影响,但相对湿度和风速对城市热岛强度的影响与以往研究结果一致,并突出了气压对北京市城市热岛强度的影响。
图5 城市热岛强度随关键气象要素变化
Fig.5 Urban heat island intensity charge with key meteorological factors
利用北京站和密云站1967~2016年的长期气象观测数据分析了北京市热岛强度的长期变化趋势并探讨其气候学形成机制,结果如下:
1) 过去50 a,北京地区平均气温和最低气温的城市热岛强度显著增加,并且最低气温的城市热岛强度增温率明显高于平均气温的城市热岛强度,其增温率分别为0.45℃/10a 和0.29℃/10a,而最高气温的城市热岛强度没有明显变化趋势。
2) 日照时数、风速、平均相对湿度和平均气压与平均气温和最低气温的城市热岛强度均存在不同程度的显著负相关,而气温与平均气温和最低气温的城市热岛强度则存在显著的正相关,反映随着全球气候变暖城市热岛强度存在增加趋势。
3) 平均相对湿度、最大风速和平均气压是影响北京地区平均气温和最低气温城市热岛强度的控制性气象因子,而平均气压、平均相对湿度和日照时数是影响最高气温城市热岛强度的核心气象因子。
致谢:感谢中国科学院南京地理与湖泊研究所的张毅博和邓建明帮助绘制了部分图件。
The authors have declared that no competing interests exist.
| [1] |
The physical science basis. Working Group I Contribution to the Fifth Assessment Report of the Intergovernmental Panel on Climate Change [M]. |
| [2] |
The effect of urban heat island on climate warming in the Yangtze River Delta urban agglomeration in China [J].https://doi.org/10.3390/ijerph120808773 URL PMID: 4555247 [本文引用: 1] 摘要
The Yangtze River Delta (YRD) has experienced rapid urbanization and dramatic economic development since 1978 and the Yangtze River Delta urban agglomeration (YRDUA) has been one of the three largest urban agglomerations in China. We present evidence of a significant urban heat island (UHI) effect on climate warming based on an analysis of the impacts of the urbanization rate, urban population, and land use changes on the warming rate of the daily average, minimal (nighttime) and maximal (daytime) air temperature in the YRDUA using 41 meteorological stations observation data. The effect of the UHI on climate warming shows a large spatial variability. The average warming rates of average air temperature of huge cities, megalopolises, large cities, medium-sized cities, and small cities are 0.483, 0.314 ± 0.030, 0.282 ± 0.042, 0.225 ± 0.044 and 0.179 ± 0.046 °C/decade during the period of 1957–2013, respectively. The average warming rates of huge cities and megalopolises are significantly higher than those of medium-sized cities and small cities, indicating that the UHI has a significant effect on climate warming (t-test, p < 0.05). Significantly positive correlations are found between the urbanization rate, population, built-up area and warming rate of average air temperature (p < 0.001). The average warming rate of average air temperature attributable to urbanization is 0.124 ± 0.074 °C/decade in the YRDUA. Urbanization has a measurable effect on the observed climate warming in the YRD aggravating the global climate warming.
|
| [3] |
Urban and rural temperature trends in proximity to large US cities: 1951-2000 [J].https://doi.org/10.1002/joc.1555 URL [本文引用: 1] 摘要
This paper presents a study of urban and rural temperature trends in proximity to the most populous metropolitan areas of the US. As data from urban meteorological stations are typically eliminated or adjusted for use in continental and global analyses of climate change, few studies have addressed how temperatures are changing in the areas most vulnerable to the public health impacts of warming: large cities. In this study, temperature data from urban and proximate rural stations for 50 large US metropolitan areas are analysed to establish the mean decadal rate of change in urban temperatures, rural temperatures, and heat island intensity over five decades. The results of this analysis find the mean decadal rate of change in the heat island intensity of large US cities between 1951 and 2000 to be 0.05 C and further show a clear division in temperature trends between cities situated in the northeastern and southern regions of the country. Copyright 2007 Royal Meteorological Society
|
| [4] |
Evidence for a significant urbanization effect on climate in China [J]. |
| [5] |
Spatial-temporal change of land surface temperature across 285 cities in China: An urban-rural contrast perspective [J].https://doi.org/10.1016/j.scitotenv.2018.04.105 URL PMID: 29677674 [本文引用: 1] 摘要
Abstract As an important theme in global climate change and urban sustainable development, the changes of land surface temperature (LST) and surface urban heat island (SUHI) have been more and more focused by urban ecologists. This study used land-use data to identify the urban-rural areas in 285 cities in China and comparatively analyzed LST in urban-rural areas with the perspective of spatial-temporal dynamics heterogeneity. The results showed that, 98.9% of the cities exhibited SUHI effect in summer nighttime and the effect was stronger in northern cities than that in southern cities. In 2010, the mean SUHI intensity was the largest in summer daytime, with 4.6% of the cities having extreme SUHI of over 4C. From 2001 to 2010, the nighttime LST of most cities increased more quickly in urban areas compared with rural areas, with an increasing tendency of the urban-rural LST difference. The difference in the urban- rural LST change rate was concentrated in the range of 0-0.1C/year for 68.0% of cities in winter and 70.8% of cities in summer. For the higher LST increasing in urban areas compared with rural areas, there were more cities in summer than winter, indicating that the summer nighttime was the key temporal period for SUHI management. Based on the change slope of urban-rural LST, cities were clustered into four types and the vital and major zones for urban thermal environment management were identified in China. The vital zone included cities in Hunan, Hubei and other central rising provinces as well as the Beibu Gulf of Guangxi Province. The major zone included most of the cities in Central Plain Urban Agglomeration, Yangtze River Delta and Pearl River Delta. These results can provide scientific basis for SUHI adaptation in China.
|
| [6] |
A systematic review and scientific critique of methodology in modern urban heat island literature [J].https://doi.org/10.1002/joc.2141 URL Magsci [本文引用: 1] 摘要
In the modern era of urban climatology, much emphasis has been placed on observing and documenting heat island magnitudes in cities around the world. Urban climate literature consequently boasts a remarkable accumulation of observational heat island studies. Through time, however, methodologists have raised concerns about the authenticity of these studies, especially regarding the measurement, definition and reporting of heat island magnitudes. This paper substantiates these concerns through a systematic review and scientific critique of heat island literature from the period 1950–2007. The review uses nine criteria of experimental design and communication to critically assess methodological quality in a sample of 190 heat island studies. Results of this assessment are discouraging: the mean quality score of the sample is just 50 percent, and nearly half of all urban heat island magnitudes reported in the sample are judged to be scientifically indefensible. Two areas of universal weakness in the literature sample are controlled measurement and openness of method: one-half of the sample studies fail to sufficiently control the confounding effects of weather, relief or time on reported ‘urban’ heat island magnitudes, and three-quarters fail to communicate basic metadata regarding instrumentation and field site characteristics. A large proportion of observational heat island literature is therefore compromised by poor scientific practice. This paper concludes with recommendations for improving method and communication in heat island studies through better scrutiny of findings and more rigorous reporting of primary research. Copyright 08 2010 Royal Meteorological Society
|
| [7] |
|
| [8] |
Simulation of the urban heat island phenomenon in Mediterranean climates [J].https://doi.org/10.1007/s00024-003-2447-4 URL Magsci [本文引用: 1] 摘要
An intelligent 渄ata-drivenmethod is used in the present study for investigating, analyzing and quantifying the urban heat island phenomenon in the major Athens region where hourly ambient air-temperature data are recorded at twenty-three stations. The heat island phenomenon has a serious impact on the energy consumption of buildings, increases smog production, while contributing to an increasing emission of pollutants from power plants, including sulfur dioxide, carbon monoxide, nitrous oxides and suspended particulates. The intelligent method is an artificial neural network approach in which the urban heat island intensity at day and nighttime are estimated using as inputs several climatic parameters. Various neural network architectures are designed and trained for the output estimation, which is the daytime and nighttime urban heat island intensity at each station for a two-year time period. The results are tested with extensive sets of non-training measurements and it is found that they correspond well with the actual values. Furthermore, the influence of several input climatic parameters measured at each station, such as solar radiation, daytime and nighttime air temperature, and maximum daily air temperature, on the urban heat island intensity fluctuations is investigated and analyzed separately for the day and nighttime period. From this investigation it is shown that heat island intensity is mainly influenced by urbanization factors. A sensitivity investigation has been performed, based on neural network techniques, in order to adequately quantify the impact of the above input parameters on the urban heat island phenomenon.
|
| [9] |
上海的雾霾天气特征及影响因素 [J].https://doi.org/10.13770/j.cnki.issn2095-705x.2015.08.005 URL [本文引用: 1] 摘要
对1961至今的上海雾霾日数变化特征及影响因素进行了调研和分析,特别是对2008年以来上海大气环境中粒径2.5μm及以下颗粒物(PM2.5)的年变化、月变化及日变化特征及影响因素做了相关分析,并从PM2.5的角度反映近年来的雾霾天气变化。经分析可知,上海市雾日数整体呈减少趋势,而霾日数呈增加趋势,且增幅明显。上海市PM2.5年平均质量浓度在2008-2014年期间呈降-升-降的趋势,仅2011年的年均值(34μg/m3)达到《环境空气质量标准》(GB3095-2012)中二级标准。另外,上海市PM2.5的月均值冬季高,夏季低,符合霾天气的冬多夏少,春秋季居中的规律,并且其浓度变化与气温和降水量等气象因素有较为明显的相关性。
Shanghai fog and haze weather characteristics and influencing factors .https://doi.org/10.13770/j.cnki.issn2095-705x.2015.08.005 URL [本文引用: 1] 摘要
对1961至今的上海雾霾日数变化特征及影响因素进行了调研和分析,特别是对2008年以来上海大气环境中粒径2.5μm及以下颗粒物(PM2.5)的年变化、月变化及日变化特征及影响因素做了相关分析,并从PM2.5的角度反映近年来的雾霾天气变化。经分析可知,上海市雾日数整体呈减少趋势,而霾日数呈增加趋势,且增幅明显。上海市PM2.5年平均质量浓度在2008-2014年期间呈降-升-降的趋势,仅2011年的年均值(34μg/m3)达到《环境空气质量标准》(GB3095-2012)中二级标准。另外,上海市PM2.5的月均值冬季高,夏季低,符合霾天气的冬多夏少,春秋季居中的规律,并且其浓度变化与气温和降水量等气象因素有较为明显的相关性。
|
| [10] |
Role of climate anomalies on decadal variation in the occurrence of wintertime haze in the Yangtze River Delta, China [J].https://doi.org/10.1016/j.scitotenv.2017.05.015 URL PMID: 28501016 [本文引用: 1] 摘要
Abstract The wintertime haze day (HD) in the Yangtze River Delta (YRD) region of China shows a significant upward trend during the past decades due to the rapid industrialization and urbanization. Besides the enhanced anthropogenic emission, climate change also plays the important role in the long term HD variations. In this study, the significant decadal variation of wintertime HD during the period 1960-2012 in YRD is examined by the empirical orthogonal function (EOF) analysis, featured as less HD occurrence before 1980 and more occurrence after 2000. The numerical simulations by the global transport and chemical model (Model for Ozone and Related chemical Tracers, MOZART) with the same emission inventory suggest 8.4% enhancement of wintertime PM 2.5 (particulate matter with the equivalent diameter of air dynamics less than or equal to 2.5m) mass concentration in YRD during 2001-2009 compared with that during 1971-1979 attributed to meteorological changes, indicating the significant effect of climate anomaly on the decadal variations of wintertime HD. Through the composite analysis on the atmospheric dynamical and thermal conditions based on the reanalysis data, the faster warming in the lower and middle troposphere over the continent in the recent decade is suggested to be important for the out-of-phase decadal HD variation in YRD. The thermal anomaly not only reverses the zonal thermal difference of land-sea to stimulate the anomalous southerlies over YRD leading to reduced prevailing north wind in winter, but also develops the deep inversion below the mid-troposphere to enhance the atmospheric stability. As a result, more frequent and persistent air stagnations in recent decade are expected for the reduction of atmospheric horizontal dispersion and vertical diffusion capacity leading to more occurrence of wintertime HD in YRD. Copyright 2017 Elsevier B.V. All rights reserved.
|
| [11] |
城市地表热环境研究进展 [J].
近50年来,以中国为代表的发展中国家快速城市化过程所引起的生态环境问题直接导致了城市地表热环境的剧烈变化。当前,采用定量化的研究方法开展城市地表热环境研究已成为国内外城市生态环境与气候领域的研究热点之一。因此,厘清城市地表热环境的研究进展对于今后更好地开展城市空间热环境定量评价研究以及进一步促进城市可持续发展具有重要的现实意义。在对城市空间热环境和城市热岛等相关概念、主要研究方法和数据获取方式进行简要叙述的基础上,着重从城市地表热环境的时空特征及其变化、驱动力和驱动机制、城市地表辐射与能量平衡、城市地表热岛与城市大气热岛的关系及其演变规律、城市绿地和水体对城市热岛效应的缓解、城市地表热岛的尺度转换等6个主要方面对当前国内外已开展的城市地表热环境研究进行了归纳总结,并就当前研究过程中存在的问题以及未来的研究重点进行了探讨,以期为今后更好地开展城市地表热环境定量化研究提供参考。
Research progress on the thermal environment of the urban surfaces .
近50年来,以中国为代表的发展中国家快速城市化过程所引起的生态环境问题直接导致了城市地表热环境的剧烈变化。当前,采用定量化的研究方法开展城市地表热环境研究已成为国内外城市生态环境与气候领域的研究热点之一。因此,厘清城市地表热环境的研究进展对于今后更好地开展城市空间热环境定量评价研究以及进一步促进城市可持续发展具有重要的现实意义。在对城市空间热环境和城市热岛等相关概念、主要研究方法和数据获取方式进行简要叙述的基础上,着重从城市地表热环境的时空特征及其变化、驱动力和驱动机制、城市地表辐射与能量平衡、城市地表热岛与城市大气热岛的关系及其演变规律、城市绿地和水体对城市热岛效应的缓解、城市地表热岛的尺度转换等6个主要方面对当前国内外已开展的城市地表热环境研究进行了归纳总结,并就当前研究过程中存在的问题以及未来的研究重点进行了探讨,以期为今后更好地开展城市地表热环境定量化研究提供参考。
|
| [12] |
Impact of regional climate change on human health [J].https://doi.org/10.1038/nature04188 URL PMID: 16292302 [本文引用: 1] 摘要
Abstract The World Health Organisation estimates that the warming and precipitation trends due to anthropogenic climate change of the past 30 years already claim over 150,000 lives annually. Many prevalent human diseases are linked to climate fluctuations, from cardiovascular mortality and respiratory illnesses due to heatwaves, to altered transmission of infectious diseases and malnutrition from crop failures. Uncertainty remains in attributing the expansion or resurgence of diseases to climate change, owing to lack of long-term, high-quality data sets as well as the large influence of socio-economic factors and changes in immunity and drug resistance. Here we review the growing evidence that climate-health relationships pose increasing health risks under future projections of climate change and that the warming trend over recent decades has already contributed to increased morbidity and mortality in many regions of the world. Potentially vulnerable regions include the temperate latitudes, which are projected to warm disproportionately, the regions around the Pacific and Indian oceans that are currently subjected to large rainfall variability due to the El Ni脙卤o/Southern Oscillation sub-Saharan Africa and sprawling cities where the urban heat island effect could intensify extreme climatic events.
|
| [13] |
More intense, more frequent, and longer lasting heat waves in the 21st century [J].https://doi.org/10.1126/science.1098704 URL PMID: 15310900 [本文引用: 3] 摘要
A global coupled climate model shows that there is a distinct geographic pattern to future changes in heat waves. Model results for areas of Europe and North America, associated with the severe heat waves in Chicago in 1995 and Paris in 2003, show that future heat waves in these areas will become more intense, more frequent, and longer lasting in the second half of the 21st century. Observations and the model show that present-day heat waves over Europe and North America coincide with a specific atmospheric circulation pattern that is intensified by ongoing increases in greenhouse gases, indicating that it will produce more severe heat waves in those regions in the future.
|
| [14] |
Heat waves and urban heat islands in Europe: A review of relevant drivers [J].https://doi.org/10.1016/j.scitotenv.2016.06.119 URL PMID: 27366983 [本文引用: 1] 摘要
61Urban heat will affect more people due to climate change and proceeding urbanization.6170 European cities to analyze the development of urban heat islands under heat waves61Urban green seems to increase the heat island magnitude during heat waves.61Colder cities seem to be more affected by heat waves than warmer cities.61Applied city clusters might support case-specific adaptation through urban planning.
|
| [15] |
On the energy impact of urban heat island and global warming on buildings [J].https://doi.org/10.1016/j.enbuild.2014.07.022 URL [本文引用: 1] 摘要
Urban heat island and global warming increase ambient temperature and modify the energy budget of buildings. The magnitude of the modification has been evaluated in a large number of articles, under different climatic and building boundary conditions. This paper collects, analyzes and classifies existing knowledge regarding the energy impact of urban heating to buildings and calculates preliminary indicators and impact figures. Based on the analysis of the impact studies, it is found that in average the cooling load of typical urban buildings is by 13% higher compared to similar buildings in rural areas. Four specific energy impact indicators, the global energy penalty per m2, the global energy penalty per m2 and degree of UHI, the global energy penalty per person and the global energy penalty per person and per degree of the UHI are defined and calculated. The variability of the heating and cooling loads of typical buildings is evaluated for the period 19702010. The average increase of the cooling demand is 23% while the corresponding average reduction of the heating is 19%. In total, the average energy consumption of typical buildings for heating and cooling purposes increased by 11% for the same period.
|
| [16] |
Urban heat island research from 1991 to 2015: a bibliometric analysis [J]. |
| [17] |
Spatio-temporal variance and meteorological drivers of the urban heat island in a European city [J].https://doi.org/10.1007/s00704-015-1687-4 URL [本文引用: 3] 摘要
Urban areas are especially vulnerable to high temperatures, which will intensify in the future due to climate change. Therefore, both good knowledge about the local urban climate as well as simple and robust methods for its projection are needed. This study has analysed the spatio-temporal variance of the mean nocturnal urban heat island (UHI) of Hamburg, with observations from 40 stations from different suppliers. The UHI showed a radial gradient with about 2 K in the centre mostly corresponding to the urban densities. Temporarily, it has a strong seasonal cycle with the highest values between April and September and an inter-annual variability of approximately 0.5 K. Further, synoptic meteorological drivers of the UHI were analysed, which generally is most pronounced under calm and cloud-free conditions. Considered were meteorological parameters such as relative humidity, wind speed, cloud cover and objective weather types. For the stations with the highest UHI intensities, up to 68.7 % of the variance could be explained by seasonal empirical models and even up to 76.6 % by monthly models.
|
| [18] |
The effects of the synoptic conditions on development of the urban heat island in Debrecen, Hungary [J]. |
| [19] |
不同气象条件下廊坊城市热岛效应变化特征 [J].https://doi.org/10.3969/j.issn.1673-503X.2009.06.009 URL Magsci [本文引用: 2] 摘要
利用2005年9月至2008年8月廊坊市区域加密自动站逐时气温资料,采用城、郊气温对比法研究了不同气象条件对廊坊城市热岛效应的影响。结果表明:廊坊城市热岛强度夜间大于白天,但变化幅度白天大于夜间;在四季不同时段存在"城市冷岛"现象。不同气象条件下,廊坊城市热岛强度及变化存在明显差异,晴朗无风时城市平均热岛强度最大,平均强度为1.25℃,阴雨气象条件下城市平均热岛强度最小,平均强度仅为0.10℃。
Urban heat island effect under different meteorological conditions over Langfang Hebei Province .https://doi.org/10.3969/j.issn.1673-503X.2009.06.009 URL Magsci [本文引用: 2] 摘要
利用2005年9月至2008年8月廊坊市区域加密自动站逐时气温资料,采用城、郊气温对比法研究了不同气象条件对廊坊城市热岛效应的影响。结果表明:廊坊城市热岛强度夜间大于白天,但变化幅度白天大于夜间;在四季不同时段存在"城市冷岛"现象。不同气象条件下,廊坊城市热岛强度及变化存在明显差异,晴朗无风时城市平均热岛强度最大,平均强度为1.25℃,阴雨气象条件下城市平均热岛强度最小,平均强度仅为0.10℃。
|
| [20] |
不同气象条件下济宁城市热岛效应的变化特征 [J].https://doi.org/10.13878/j.cnki.jnuist.2016.02.008 URL [本文引用: 2] 摘要
利用1981—2013年济宁、兖州、嘉祥、汶上站逐日4个时次的平均气温、平均风速、降水量、云量和能见度资料,对不同天气条件下济宁市的城市热岛效应进行研究.结果表明:济宁城市热岛效应具有明显的月季变化特征和日变化特征,具体为冬半年明显高于夏半年,白天的热岛强度明显低于夜间,中午前后最弱;济宁市四季热岛强度的变化规律是冬季最强,夏季最弱,春秋居中,除秋季外均呈现缓慢上升趋势.在不同气象条件下,济宁城市热岛强度也存在很大差异,其中在晴朗无风气象条件下表现最为突出,平均值达到0.79℃,其昼夜变化幅度也最大;在降雨时城市热岛强度最小,平均仅有0.09℃,其昼夜变化幅度也最小;大于等于4.0 m/s大风天气和雾均多发生在秋冬季,且雾对城市热岛的形成和昼夜变化影响明显大于风对城市热岛的影响;在晴朗无风和大雾条件下,02时热岛强度最强,当有降水出现时,20时热岛强度最强,出现大风天气时,08时热岛强度最强,所有研究天气条件下,14时热岛强度均表现为最弱.
Urban heat island effect under different meteorological conditions in Jining of Shandong Province .https://doi.org/10.13878/j.cnki.jnuist.2016.02.008 URL [本文引用: 2] 摘要
利用1981—2013年济宁、兖州、嘉祥、汶上站逐日4个时次的平均气温、平均风速、降水量、云量和能见度资料,对不同天气条件下济宁市的城市热岛效应进行研究.结果表明:济宁城市热岛效应具有明显的月季变化特征和日变化特征,具体为冬半年明显高于夏半年,白天的热岛强度明显低于夜间,中午前后最弱;济宁市四季热岛强度的变化规律是冬季最强,夏季最弱,春秋居中,除秋季外均呈现缓慢上升趋势.在不同气象条件下,济宁城市热岛强度也存在很大差异,其中在晴朗无风气象条件下表现最为突出,平均值达到0.79℃,其昼夜变化幅度也最大;在降雨时城市热岛强度最小,平均仅有0.09℃,其昼夜变化幅度也最小;大于等于4.0 m/s大风天气和雾均多发生在秋冬季,且雾对城市热岛的形成和昼夜变化影响明显大于风对城市热岛的影响;在晴朗无风和大雾条件下,02时热岛强度最强,当有降水出现时,20时热岛强度最强,出现大风天气时,08时热岛强度最强,所有研究天气条件下,14时热岛强度均表现为最弱.
|
| [21] |
不同天气条件下沈阳城市热岛特征 [J].https://doi.org/10.3969/j.issn.1674-7097.2011.01.009 URL [本文引用: 2] 摘要
利用1992—2008年沈阳站和新城子站逐日4个时次的平均气温、平均风速、降水量、云量和能见度资料,对不同天气条件下沈阳的城市热岛效应进行研究。结果表明:除雾和浓雾天气条件下,沈阳城市热岛强度在08时最弱外,其他天气条件下均表现为20时最强,14时最弱;不同天气条件下,夜间城市热岛强度均高于白天;晴朗无风条件下昼夜城市热岛强度差最大,为0.73℃。四季相比,除雾条件下秋季城市热岛强度最强外,其他天气条件下均为冬季最强;除大雨条件下春季城市热岛强度最弱外,其他条件下均为夏季最弱。沈阳城市热岛强度随降水量的增加而减弱,随能见度的降低而减弱,随着风速的增加而减弱。白天和夜间两个时次的差值表现为,1~3级风夜间变化幅度大于白天,0级和4~5级风速有相反规律,其他天气条件下无明显规律。
Urban heat island characteristics in Shenyang under different weather conditions .https://doi.org/10.3969/j.issn.1674-7097.2011.01.009 URL [本文引用: 2] 摘要
利用1992—2008年沈阳站和新城子站逐日4个时次的平均气温、平均风速、降水量、云量和能见度资料,对不同天气条件下沈阳的城市热岛效应进行研究。结果表明:除雾和浓雾天气条件下,沈阳城市热岛强度在08时最弱外,其他天气条件下均表现为20时最强,14时最弱;不同天气条件下,夜间城市热岛强度均高于白天;晴朗无风条件下昼夜城市热岛强度差最大,为0.73℃。四季相比,除雾条件下秋季城市热岛强度最强外,其他天气条件下均为冬季最强;除大雨条件下春季城市热岛强度最弱外,其他条件下均为夏季最弱。沈阳城市热岛强度随降水量的增加而减弱,随能见度的降低而减弱,随着风速的增加而减弱。白天和夜间两个时次的差值表现为,1~3级风夜间变化幅度大于白天,0级和4~5级风速有相反规律,其他天气条件下无明显规律。
|
| [22] |
Associations between varying magnitudes of the urban heat island and the synoptic climatology in Melbourne, Australia [J]. |
| [23] |
北京秋季城市热岛效应及其气象影响因子 [J].https://doi.org/10.3878/j.issn.1006-9585.2008.03.07 URL [本文引用: 2] 摘要
应用北京地区地面气象观测台1990~2004年10月的气温资料,分析了近15年来北京秋季城市热岛的特征,结果表明,北京秋季夜间城市热岛要强于白天.此外,对比分析了一个强热岛和一个弱热岛的特征及其气象影响因子,结果表明,北京秋季夜间特定条件下存在强热岛,白天城市强热岛会减弱消失,城市强热岛的日变化非常明显.夜间城市强热岛形成和维持是多个因子综合作用的结果.白天日照充足的晴夜,北京城郊地面风场很弱(≤1.0 m·s-1),同时城区垂直方向47 m以下大气风场持续很弱(≤1.0 m·s-1),城区320 m以下大气持续存在强逆温.日落后郊区地面大气降温速率和幅度远大于城区,促使夜间强热岛的形成和维持.白天日出后太阳辐射的加热作用所引起的郊区地面大气升温速率和幅度大于城区,城区大气稳定度的减弱以及城区大气逆温的消失是夜间强热岛减弱并最终消失的重要原因.
Characteristics of urban heat island effect and its meteorological influencing factors over Beijing in autumn .https://doi.org/10.3878/j.issn.1006-9585.2008.03.07 URL [本文引用: 2] 摘要
应用北京地区地面气象观测台1990~2004年10月的气温资料,分析了近15年来北京秋季城市热岛的特征,结果表明,北京秋季夜间城市热岛要强于白天.此外,对比分析了一个强热岛和一个弱热岛的特征及其气象影响因子,结果表明,北京秋季夜间特定条件下存在强热岛,白天城市强热岛会减弱消失,城市强热岛的日变化非常明显.夜间城市强热岛形成和维持是多个因子综合作用的结果.白天日照充足的晴夜,北京城郊地面风场很弱(≤1.0 m·s-1),同时城区垂直方向47 m以下大气风场持续很弱(≤1.0 m·s-1),城区320 m以下大气持续存在强逆温.日落后郊区地面大气降温速率和幅度远大于城区,促使夜间强热岛的形成和维持.白天日出后太阳辐射的加热作用所引起的郊区地面大气升温速率和幅度大于城区,城区大气稳定度的减弱以及城区大气逆温的消失是夜间强热岛减弱并最终消失的重要原因.
|
| [24] |
Temporal characteristics of the Beijing urban heat island [J].https://doi.org/10.1007/s00704-005-0192-6 URL [本文引用: 1] 摘要
This paper describes the inter-annual trend, and the seasonal and hourly variation of the near surface urban heat island (UHI) in Beijing. The surface air temperature data (mean, maximum, and minimum) from one urban (downtown Beijing) and one rural (70塳m from downtown Beijing) station were used for the period 1977 and 2000. It is found that the temperatures in both urban and rural stations show an increasing tendency. Specifically, minimum temperature shows the greatest tendency at the urban station whereas maximum temperature shows the greatest increase at the rural station. The UHI intensity obtained by calculating the difference in temperatures between the two stations identifies that the intensity is greatest and has the greatest increasing trend for minimum temperature, while the UHI intensity of maximum temperature shows a slow decrease over time. UHI intensity for minimum temperature has a strong positive correlation with the increase in the urban population and the expansion of the yearly construction area. Seasonal analyses showed the UHI intensity is strongest in winter. This seasonal UHI variation tends to be negatively correlated with the seasonal variation of relative humidity and vapor pressure. Hourly variation reveals that the strongest UHI intensity is observed in the late nighttime or evening, while the weakest is observed during the day.
|
| [25] |
A comparison of heat wave climatologies and trends in China based on multiple definitions [J].https://doi.org/10.1007/s00382-016-3315-0 URL [本文引用: 2] 摘要
Heat waves (HWs) can have disastrous impacts on human activities and natural systems, and are one of the current foci of scientific research, particularly in the context of global warming. However, there is no standard definition of a HW, which makes assessment of temporal trends a challenge. In this study, based on daily mean, maximum and minimum temperature, and relative humidity datasets from China Meteorological Administration, the patterns, trends and variations of HW in China during 19612014 are investigated. Sixteen previously published HW indices (HIs) are calculated, which are divided into two types using relative and absolute threshold temperatures, respectively. During 19612014, both relative and absolute threshold HIs show the highest number of HW in Jianghua and South China, geographically consistent with the climate characteristics of China. The majority of HIs shows negative/positive trends of HW days before/after 1990 over the whole of China, but especially in Jianghua and South China, which reflects rapid warming since 1990. There are significant correlations among different HIs in the same type (both absolute and relative), but correlations are weak between relative and absolute threshold HIs. Because relative and absolute HIs show contrasting trends, the choice of HI is therefore critical for future analysis
|
| [26] |
Detection and adjustment of undocumented discontinuities in Chinese temperature series using a composite approach [J].https://doi.org/10.1007/s00376-009-0143-8 URL Magsci [本文引用: 1] 摘要
Annually averaged daily maximum and minimum surface temperatures from southeastern China were evaluated for artificial discontinuities using three different tests for undocumented changepoints. Changepoints in the time series were identified by comparing each target series to a reference calculated from values observed at a number of nearby stations. Under the assumption that no trend was present in the sequence of target-reference temperature differences, a changepoint was assigned to the target series when at least two of the three tests rejected the null hypothesis of no changepoint at approximately the same position in the difference series. Each target series then was adjusted using a procedure that accounts for discontinuities in average temperature values from nearby stations that otherwise could bias estimates of the magnitude of the target series step change. A spatial comparison of linear temperature trends in the adjusted annual temperature series suggests that major relative discontinuities were removed in the homogenization process. A greater number of relative change points were detected in annual average minimum than in average maximum temperature series. Some evidence is presented which suggests that minimum surface temperature fields may be more sensitive to changes in measurement practice than maximum temperature fields. In addition, given previous evidence of urban heat island (i.e., local) trends in this region, the assumption of no slope in a target-reference difference series is likely to be violated more frequently in minimum than in maximum temperature series. Consequently, there may be greater potential to confound trend and step changes in minimum temperature series.
|
| [27] |
Detecting and adjusting temporal inhomogeneity in Chinese mean surface air temperature data [J].https://doi.org/10.1007/BF02915712 URL [本文引用: 1] 摘要
Adopting the Easterling-Peterson (EP) techniques and considering the reality of Chinese meteorological observations, this paper designed several tests and tested for inhomogeneities in all Chinese historical surface air temperature series from 1951 to 2001. The result shows that the time series have been widely impacted by inhomogeneities resulting from the relocation of stations and changes in local environment such as urbanization or some other factors. Among these factors, station relocations caused the largest magnitude of abrupt changes in the time series, and other factors also resulted in inhomogeneities to some extent. According to the amplitude of change of the difference series and the monthly distribution features of surface air temperatures, discontinuities identified by applying both the E-P technique and supported by China station history records, or by comparison with other approaches, have been adjusted. Based on the above processing, the most significant temporal inhomogeneities were eliminated, and China most homogeneous surface air temperature series has thus been created. Results show that the inhomogeneity testing captured well the most important change of the stations, and the adjusted dataset is more reliable than ever. This suggests that the adjusted temperature dataset has great value of decreasing the uncertaities in the study of observed climate change in China.
|
| [28] |
北京市近40年城市热岛效应研究 [J].
利用北京市近40年气候资料研究分析北京市市区与郊区平均气温日、季、年际和年代变化特征发现,40年中1995年11月24日市区与郊区日平均气温温差最大,达4.6℃;季变化市区与郊区温差冬季最大,为1.11℃,春季最小,仅为0.26℃;年际变化1961~1977年市区与郊区温差较小,而1978~2000年市区与郊区温差达0.62℃,热岛效应明显增强;年代变化市区与郊区温差60年代最小,仅为0.13℃,90年代最大,为0.78℃.近年虽高温(≥35℃)日数明显增多,但年最高气温变化较小,仅有1997年、1999年和2000年年最高气温>38℃.近40年市区与郊区年平均气温明显上升,市区气温平均10年升高0.43℃,郊区气温平均10年升高0.21℃,北京市市区年平均气温序列中存在明显的12年周期.
The study on heat island effect in Beijing during last 40 year. Chinese Journal of
利用北京市近40年气候资料研究分析北京市市区与郊区平均气温日、季、年际和年代变化特征发现,40年中1995年11月24日市区与郊区日平均气温温差最大,达4.6℃;季变化市区与郊区温差冬季最大,为1.11℃,春季最小,仅为0.26℃;年际变化1961~1977年市区与郊区温差较小,而1978~2000年市区与郊区温差达0.62℃,热岛效应明显增强;年代变化市区与郊区温差60年代最小,仅为0.13℃,90年代最大,为0.78℃.近年虽高温(≥35℃)日数明显增多,但年最高气温变化较小,仅有1997年、1999年和2000年年最高气温>38℃.近40年市区与郊区年平均气温明显上升,市区气温平均10年升高0.43℃,郊区气温平均10年升高0.21℃,北京市市区年平均气温序列中存在明显的12年周期.
|
| [29] |
Interdecadal variations and trends of the Urban Heat Island in Athens (Greece) and its response to heat waves [J].https://doi.org/10.1016/j.atmosres.2015.03.016 URL [本文引用: 3] 摘要
61The seasonal and temporal variability and trends of UHI in Athens was studied.61UHI accounts for almost half of Athens' warming.61Nocturnal and daytime UHI reveal different patterns.61UHI increased hot days frequency.61Heat waves amplify UHI intensity during night time.
|
| [30] |
Daily maximum urban heat island intensity in large cities of Korea [J].https://doi.org/10.1007/s00704-004-0070-7 URL [本文引用: 2] 摘要
This study investigates the characteristics of the daily maximum urban heat island (UHI) intensity in the six largest cities of South Korea (Seoul, Incheon, Daejeon, Daegu, Gwangju, and Busan) during the period 19732001. The annually-averaged daily maximum UHI intensity in all cities tends to increase with time, but the rate of increase differs. It is found that the average annual daily maximum UHI intensity tends to be smaller in coastal cities (Incheon and Busan) than in inland cities (Daejeon, Daegu, and Gwangju), even if a coastal city is larger than an inland city. A spectral analysis shows a prominent diurnal cycle in the UHI intensity in all cities and a prominent annual cycle in coastal cities. A multiple linear regression analysis is undertaken in order to relate the daily maximum UHI intensity to the maximum UHI intensity on the previous day (PER), wind speed (WS), cloudiness (CL), and relative humidity (RH). In all cities, the PER variable is positively correlated with the daily maximum UHI intensity, while WS, CL, and RH variables are negatively correlated with it. The most important variable in all cities is PER, but the relative importance of the other three variables differs depending on city. The total variance explained by the multiple linear regression equation ranges from 29.9% in Daejeon to 44.7% in Seoul. A multidimensional scaling analysis performed with a correlation matrix obtained using the daily maximum UHI intensity data appears to distinguish three city groups. These groupings are closely connected with distances between cities. A multidimensional scaling analysis undertaken using the normalized regression coefficients obtained from the multiple linear regression analysis distinguishes three city groups. Notably, Incheon and Busan form one group, whose points in the two-dimensional space are very close. The results of a cluster analysis performed using the multivariate data of PER, WS, RH, and CL are consistent with those of the multidimensional scaling analysis. The analysis results in this study indicate that the characteristics of the UHI intensity in a coastal city are in several aspects different from those in an inland city.
|
| [31] |
The effects of land-use and anthropogenic heating on the surface temperature in the Tokyo Metropolitan area: A numerical experiment [J].https://doi.org/10.1016/0957-1272(91)90050-O URL [本文引用: 1] 摘要
The diurnal variation of the simulated surface air temperature agrees well with the observed value; an average over 36 days which represent typical summer days; i.e. negligible gradient winds and almost clear skies. The model shows that the contribution of anthropogenic heat is much larger at night, in spite of the lower energy consumption as compared to daytime use. Due to the scarcity of green vegetated areas in the central part of the city, the surface air temperature is enhanced in this region during daytime, however this enhancement is small after midnight.
|
| [32] |
Detailed structure of heat island phenomena from moving observations from electric tram-cars in Metropolitan Tokyo [J].https://doi.org/10.1016/1352-2310(95)00010-0 URL [本文引用: 1] 摘要
In this study, the detailed horizontal structure, i.e. cliffs and plateaux of the heat island of the Metropolitan Tokyo area is investigated. According to Oke (1977), cliff is steep temperature gradient at the rural/urban boundary and plateau is a steady but weaker horizontal gradient of increasing temperature towards the city center. However, these features are not always evident, e.g. large city like Tokyo. To elucidate such aspects, moving observations of the horizontal distribution of air temperature from electric trains of the transportation network of Metropolitan Tokyo during late evening or early morning were thus conducted. In total, 16 railroad lines were used for the moving observations. The observations were done in two phases for sectional and horizontal distributions. Results show that three cliffs exist in the heat island of Metropolitan Tokyo, although the location of these cliffs should be taken into consideration for urban planning or urban redevelopment.
|
| [33] |
Mesoscale aspects of the Urban Heat Island around New York City [J].https://doi.org/10.1007/s00704-002-0724-2 URL [本文引用: 1] 摘要
09A mesoscale analysis of the Urban Heat Island (UHI) of New York City (NYC) is performed using a mesoscale network of weather stations. In all seasons the UHI switches on rapidly in late afternoon...
|
| [34] |
城市热岛效应的影响机理及其作用规律——以上海市为例 [J].https://doi.org/10.11821/dlxb201311002 URL [本文引用: 1] 摘要
以上海市为例,从土地利用规模和强度的变化、类型和布局的变化、利用方式的变化三个方面揭示其对热岛效应的影响机理;实证分析结果表明:(1)土地城市化是上海城市热岛强度的主要影响因素;就建成区扩张对热岛强度的具体影响而言,累积效应大于其增量效应;(2)工业化、房地产开发、人口增长对上海城市热岛强度均具有较大的影响;就经济发展和能源消耗对城市热岛强度的具体影响而言,密度效应通常大于其规模效应;就全社会房屋竣工面积、20层以上高层建筑数量对热岛强度的影响而言,累积效应小于增量效应;就人口增长对城市热岛强度的具体影响而言,密度效应与规模效应大体相近;(3)土地利用和城市发展模式的差异导致了城市热岛效应的空间差异。
The impacting mechanism and laws of function of urban heat islands effect: A case study of Shanghai .https://doi.org/10.11821/dlxb201311002 URL [本文引用: 1] 摘要
以上海市为例,从土地利用规模和强度的变化、类型和布局的变化、利用方式的变化三个方面揭示其对热岛效应的影响机理;实证分析结果表明:(1)土地城市化是上海城市热岛强度的主要影响因素;就建成区扩张对热岛强度的具体影响而言,累积效应大于其增量效应;(2)工业化、房地产开发、人口增长对上海城市热岛强度均具有较大的影响;就经济发展和能源消耗对城市热岛强度的具体影响而言,密度效应通常大于其规模效应;就全社会房屋竣工面积、20层以上高层建筑数量对热岛强度的影响而言,累积效应小于增量效应;就人口增长对城市热岛强度的具体影响而言,密度效应与规模效应大体相近;(3)土地利用和城市发展模式的差异导致了城市热岛效应的空间差异。
|
| [35] |
Quantification of the influences of wind and cloud on the nocturnal urban heat island of a large City [J].https://doi.org/10.1175/1520-0450(2001)0402.0.CO;2 URL [本文引用: 1] 摘要
Analyses taken over all observed weather conditions of daily 0600 EST climate data from a network of monitoring stations in and around the large city of Melbourne, Australia, revealed a 20-yr mean urban heat island (UHI) value of 1.13C. The UHI varied seasonally between summer (1.29C), spring (1.25C), autumn (1.02C), and winter (0.98C). Investigations undertaken with daily wind speed and cloud amount data enabled a detailed investigation of the relative importance of factors such as the turbulent and radiative exchanges on Melbourne's UHI. Analysis of variance and regression techniques were used to explore these processes and to predict the behavior of the UHI in numerical terms for mean seasonal and annual periods between 1972 and 1991. Over the 20-yr period, analyses of the association among Melbourne's UHI, wind, and cloud revealed that the UHI was inversely proportional to approximately the fourth root of both the wind speed and the cloud amount. This relationship explained more of the UHI variance during summer and the least variance during winter. Increases in the amount of cloud cover and in the frequency of wind speeds in excess of 2.0 m sresulted in a statistically significant (95% confidence level) reduction in UHI magnitude. The influence of wind in limiting Melbourne's UHI magnitude was greatest during clear to near-clear sky conditions. Similarly increases in cloud were most restrictive to UHI development during calm to low wind speeds. Unlike most previous studies, the linear regression analysis presented here revealed that cloud was more limiting than the wind speed to UHI development for all seasons except summer. Contour plots of the UHI are presented for the various associations between each category of cloud and wind. These plots enable a clear visual presentation of the most to least favorable conditions for UHI intensity and development. The analyses indicate that low wind speeds and little or no cloud were typically associated with the largest UHI development. Eight octas of cloud and wind speeds in excess of 5.0 m swere usually associated with modest (but still apparent) UHI development.
|
| [36] |
114(D10):D00D16 . |
| [37] |
Decreasing trend of sunshine hours and related driving forces in North China [J].https://doi.org/10.1007/s00704-008-0049-x URL [本文引用: 1] 摘要
Global dimming is currently an active area of research in climate change. Trends of temporal (on the order of decades, years, seasons or even months) and spatial patterns in sunshine hours and associated climatic factors (average air temperature, relative humidity, precipitation and wind speed) over North China are evaluated for the period 1965~1999 based on data from 81 standard meteorological stations. The results show that: (1) North China is experiencing decreasing sunshine hours (82.855h/decade); (2) seasonally, decline in sunshine hours is highest in summer and lowest in winter; (3) spatially, decrease in sunshine hours is highest in inland and plain regions and lowest in the northwest mountain and coastland regions; (4) sunshine hours have a high correlation with precipitation, relative humidity and wind speed, with wind speed having the strongest influence on sunshine hours implicit in the close correlation (temporally and spatially) between the two variables; (5) cloud cover could not be any significant driver of sunshine-hour decline because it is more or less stable; (6) spatially and seasonally, wind speed is an important driving factor of decreasing sunshine hours in North China. Furthermore, the interactions between wind speed and aerosol loading may be an enabling factor of wind speed in driving (strongly) the changes in sunshine hours.
|
| [38] |
Northern hemisphere atmospheric stilling partly attributed to an increase in surface roughness [J].https://doi.org/10.1038/ngeo979 URL [本文引用: 1] 摘要
Surface winds have declined in China, the Netherlands, the Czech Republic, the United States and Australia over the past few decades. The precise cause of the stilling is uncertain. Here, we analyse the extent and potential cause of changes in surface wind speeds over the northern mid-latitudes between 1979 and 2008, using data from 822 surface weather stations. We show that surface wind speeds have declined by 5-15% over almost all continental areas in the northern mid-latitudes, and that strong winds have slowed faster than weak winds. In contrast, upper-air winds calculated from sea-level pressure gradients, and winds from weather reanalyses, exhibited no such trend. Changes in atmospheric circulation that are captured by reanalysis data explain 10-50% of the surface wind slowdown. In addition, mesoscale model simulations suggest that an increase in surface roughness-the magnitude of which is estimated from increases in biomass and land-use change in Eurasia-could explain between 25 and 60% of the stilling. Moreover, regions of pronounced stilling generally coincided with regions where biomass has increased over the past 30years, supporting the role of vegetation increases in wind slowdown.
|
| [39] |
Steady decline of east Asian monsoon winds, https://doi.org/10.1029/2006JD007337 URL [本文引用: 1] 摘要
[1] It is commonly believed that greenhouse-gas-induced global warming can weaken the east Asian winter monsoon but strengthen the summer monsoon, because of stronger warming over high-latitude land as compared to low-latitude oceans. In this study, we show that the surface wind speed associated with the east Asian monsoon has significantly weakened in both winter and summer in the recent three decades. From 1969 to 2000, the annual mean wind speed over China has decreased steadily by 28%, and the prevalence of windy days (daily mean wind speed > 5 m/s) has decreased by 58%. The temperature trends during this period have not been uniform. Significant winter warming in northern China may explain the decline of the winter monsoon, while the summer cooling in central south China and warming over the South China Sea and the western North Pacific Ocean may be responsible for weakening the summer monsoon. In addition, we found that the monsoon wind speed is also highly correlated with incoming solar radiation at the surface. The present results, when interpreted together with those of recent climate model simulations, suggest two mechanisms that govern the decline of the east Asian winter and summer monsoons, both of which may be related to human activity. The winter decline is associated with global-scale warming that may be attributed to increased greenhouse gas emission, while the summer decline is associated with local cooling over south-central China that may result from air pollution.
|
| [40] |
近54年京津冀地区热浪时空变化特征及影响因素 [J].https://doi.org/10.11898/1001-7313.20150504 URL [本文引用: 1] 摘要
It indicates that hot summers will become more frequent in eastern China in the future. The region will face a great risk in the absence of any adaptation measures taken towards reducing its vulnerability to effects of extreme heat. Beijing Tianjin Hebei Region is identified as the biggest metropolitan in northern China. Rapid urbanization and the recent frequent occurrence of hot summers in the region raises questions about influencing factors at the regional scale and the spatiotemporal variability of heat waves. Using the newly developed Heatwave Index (HI), a statistical analysis is conducted on the temporal and spatial distribution characteristics of heat waves in the Beijing Tianjin Hebei Region over a period from 1960 to 2013. More specifically, based on the history of relocations, the heat wave trends between Beijing and Fengning is compared to investigate the influence of urbanization, and also analyse the relationship between atmospheric circulation anomalies and observed heat wave trends. It shows that based on variations in heat wave trends, two distinct phases are identified in Beijing Tianjin Hebei Region. Owing to some abrupt changes in the mid 1970s, the frequency of heat waves decrease from 1960 to 1973, and then increase from 1974 to 2013. Heat waves show a decreasing trend in the southern part and an increasing trend in the northern part of Beijing Tianjin Hebei Region. A significant increasing trend is found in the northern and western biological conservation area, and decreasing trend in the south eastern plains. At the regional scale, urbanization and relocations affects the occurrence of slight to moderate rather than extreme heat waves. In the period of global warming and rapid urbanization, the frequency of heat waves in Beijing is higher than that of Fengning. In recent global warming hiatus, the frequency of heat waves in Beijing is lower than Fengning. Driving factors behind the temporal and spatial patterns are deemed complicated. The inter decadal variations are significantly and closely related to the offsetting of western Pacific subtropical high (WPSH) ridge and the anomalous anticyclone over the Tibetan Plateau (TPAI) in summer. In other words, there is a positive correlation between the number of heat wave days and WPSH and TPAI. Furthermore, the probability of a summer with a mega heat wave would increase with the 坅nomalies in WPSH and TPAI.
Zhang Donghai et al .https://doi.org/10.11898/1001-7313.20150504 URL [本文引用: 1] 摘要
It indicates that hot summers will become more frequent in eastern China in the future. The region will face a great risk in the absence of any adaptation measures taken towards reducing its vulnerability to effects of extreme heat. Beijing Tianjin Hebei Region is identified as the biggest metropolitan in northern China. Rapid urbanization and the recent frequent occurrence of hot summers in the region raises questions about influencing factors at the regional scale and the spatiotemporal variability of heat waves. Using the newly developed Heatwave Index (HI), a statistical analysis is conducted on the temporal and spatial distribution characteristics of heat waves in the Beijing Tianjin Hebei Region over a period from 1960 to 2013. More specifically, based on the history of relocations, the heat wave trends between Beijing and Fengning is compared to investigate the influence of urbanization, and also analyse the relationship between atmospheric circulation anomalies and observed heat wave trends. It shows that based on variations in heat wave trends, two distinct phases are identified in Beijing Tianjin Hebei Region. Owing to some abrupt changes in the mid 1970s, the frequency of heat waves decrease from 1960 to 1973, and then increase from 1974 to 2013. Heat waves show a decreasing trend in the southern part and an increasing trend in the northern part of Beijing Tianjin Hebei Region. A significant increasing trend is found in the northern and western biological conservation area, and decreasing trend in the south eastern plains. At the regional scale, urbanization and relocations affects the occurrence of slight to moderate rather than extreme heat waves. In the period of global warming and rapid urbanization, the frequency of heat waves in Beijing is higher than that of Fengning. In recent global warming hiatus, the frequency of heat waves in Beijing is lower than Fengning. Driving factors behind the temporal and spatial patterns are deemed complicated. The inter decadal variations are significantly and closely related to the offsetting of western Pacific subtropical high (WPSH) ridge and the anomalous anticyclone over the Tibetan Plateau (TPAI) in summer. In other words, there is a positive correlation between the number of heat wave days and WPSH and TPAI. Furthermore, the probability of a summer with a mega heat wave would increase with the 坅nomalies in WPSH and TPAI.
|

/
| 〈 |
|
〉 |
