邓海军 , 陈亚宁
, 陈亚宁
Deng Haijun, Chen Yaning
中图分类号: P467
文献标识码: A
文章编号: 1000-0690(2018)11-1933-10
收稿日期: 2017-11-20
修回日期: 2018-03-12
网络出版日期: 2018-11-20
版权声明: 2018 《地理科学》编辑部 本文是开放获取期刊文献,在以下情况下可以自由使用:学术研究、学术交流、科研教学等,但不允许用于商业目的.
基金资助:
作者简介:
作者简介:邓海军(1987-),男,湖南隆回人,博士,讲师,主要从事山区气候水文过程及流域水循环研究。E-mail: denghj@fjnu.edu.cn
展开
摘要
基于APHRO’s气温和降水数据集,运用气温阈值模型,分析了1961~2015年间天山山区降雪量变化特征。研究表明,自1961年以来,天山山区升温趋势显著,速率为0.027℃/a,且冬半年的升温速度大于夏半年。同时,3 000 m海拔以上区域的平均气温上升到0℃左右。冬季降水的增加速率为0.42 mm/a(P<0.01),春季和夏季的降水量呈减少趋势。降雪量变化时空差异显著,3 000 m海拔以上区域降雪随气温的升高而增加,而3 000 m以下区域降雪随气温的升高而减少。最大降雪量气温是控制降雪变化的关键因子,当平均气温低于最大降雪量气温时,随气温升高降雪量呈增加趋势;当平均气温高于最大降雪量气温时,随气温升高降雪量呈减少趋势。
关键词:
Abstract
Snow as a land-cover type that is mainly distributed at the high latitude and high altitude regions. Snowfall, as are main precipitation type in mountainous areas, presents significant temporal and spatial difference which was affected by climate change. In this study, based on APHRO’s dataset and temperature threshold model to analyze snowfall changes in the Tianshan Mountains during 1961-2015. Results indicated that: 1) Temperature showed increasing trend in the Tianshan Mountains since 1961, with a rate of 0.027℃/a. And temperature increase rate in winter was higher than that in summer. Meanwhile, the average air temperature of elevation above 3 000 m is rise to around 0℃ during 1961-2015. 2) Precipitation exhibited significant increasing with a rate of 0.42 mm/a (P<0.01) in winter, while decrease in spring and summer. 3) Snowfall changes were characterized by temporal and spatial variations. Snowfall presented positive relationship with air temperature in the regions with elevation over 3 000 m, while negative relationship in regions with elevation below 3 000 m. 4) Maximum snowfall temperature is a key factor to understanding changes of snowfall under warming. When mean temperature is below/above maximum snowfall temperature, snowfall usually increases/decreases with increased warming. Therefore, study on the snowfall variations in mountainous areas can be very helpful to understand the effects of climate change on hydrology process in mountainous areas.
Keywords:
自20世纪50年代以来,以陆地表面气温上升为主要特征的气候变化尤为显著。IPCC第五次评估报告(AR5)中基于4套全球气温数据集(GHCNv3, CRU, GISS and Berkeley)研究表明1979~2012年的升温速度要高于过去100 a来任何时期的升温速度,达0.27±0.05℃/10a[1]。全球变暖驱动了降水形式由降雪向降雨转变[2],尤其是冬季降雪量的变化[3]。
积雪是山区水资源的重要组成部分,对于流域水资源的稳定性起缓冲的作用。气温是影响降雨和降雪相互转化的关键性因子[4]。全球变暖使得山区的融雪期提前[5],导致河流的径流高峰来临的时间提前[3],进而影响山区河川径流的稳定性[2]。当然,也有研究指出变暖条件下降雪率增加或减少,与降雪和降雨的转化温度密切相关[4]。这表明气温阈值是控制降雪变化的一个重要因素。确定降雪和降雨转化的温度阈值范围对于研究降雪变化具有重要意义。
将降雪从降水中分离是研究降雪变化的基础,常用方法主要分为等温线剖面法[6,7,8]和气温阈值法[9,10,11,12,13,14]。等温线剖面法是基于0℃等温线剖面来判断降水类型,而气温阈值法用气温或干(或湿)球温度来判断降水形式。湿球温度相对于干球温度的优点在于考虑降水过程的蒸发制冷效应[6]。此外,相对湿度和气压亦能影响降雪量,将这2个因子融入到气温阈值模型中能够提高模型对降雪率的模拟精度[15],且在青藏高原的应用效果较好[16]。同时,基于不同的数据源计算的降雪量也存在一定的差异,例如基于ERA-Interim数据计算的降雪量,相对于APHRO’s数据,存在高估现象,这可能是因为ERA-Interim的地表气温低于站点观测值所致[17]。
天山山区受西风气流影响及地形抬升的作用,相对于周边的荒漠区域,其降水量较大,被誉为“湿岛”[18],为中亚众多河流的源地,因此又被称为中亚“水塔”[19],对中亚地区的生态环境和社会经济发展具有重要作用[20]。受全球气候变化的影响,天山山区呈增温增湿的趋势[21,22,23]。天山山区降雪量自西向东减少[24],因为其水汽来源主要受西风控制[18]。基于站点观测数据的研究天山山区降雪量的变化结果表明:① 空间差异显著,整个山区、南坡及北坡的降雪量变化速率分别为1.92 mm/10a、0.73 mm/10a及3.86 mm/10a[25];② 季节差异明显,主要是冬季降雪增加明显[24,25,26];③ 降水形式变化差异显著,降雪增加速率低于降雨[27],从而导致雨雪比呈下降的趋势[28]。当然,这些研究成果是基于地面观测站点的观测数据,主要位于中国天山部分的中低海拔区域,难以准确描述高海拔区域的降雪量变化情况。
本文以中亚天山为研究区,研究气候变化对降雪的影响,研究内容主要围绕以下两部分内容展开:① 分析1961~2015年期间中亚天山山区的气温和降水时空变化特征;② 解读暖湿条件下的天山山区降雪量的时空变化特征。以期为正确理解暖湿条件下,气候变化对山区水资源影响提供基础。
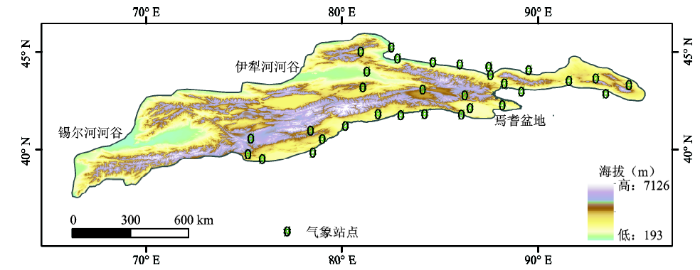
天山位于欧亚大陆腹地,地理位置介于66°~96°E和37°~46°N之间(图1),东西延伸达到2 500 km,南北平均宽度250~350 km[29],横跨中国、哈萨克斯坦、吉尔吉斯斯坦和乌兹别克斯坦4个国家。天山可以分为东天山、中天山、西天山及北天山4个部分,构成了亚洲中部最大的山系[18]。
研究区主要是海拔1 500 m等高线以上区域,还包括低于此海拔高度的部分河流谷地,如伊犁河谷和锡尔河河谷等(图1)。并按海拔高度将研究区分为3个高度带,分别是1 500 m以下区域、1 500~3 000 m之间区域及3 000 m以上区域,其中1 500 m以下区域主要为河谷低地,包括伊犁河河谷、锡尔河上游河谷及焉耆盆地;1 500~3 000 m之间为灌丛和森林分布区域;3 000 m以上区域为冰川和积雪的主要分布区域。天山山区多年平均气温在5℃左右,夏季的平均温度超过15℃,最高气温出现在7月,冬季的平均温度低于-10℃,最低温度出现在1月。本研究结果表明,天山山区多年平均降水在250~300 mm之间,冬季降水少,夏季降水多,降水量集中在4~7月份,最大降水量发生在5月份。天山的迎风坡(天山西北部区域)降水量比较丰富,特别是迎风坡河谷,例如阿姆河上游的年降水量能达到3 000 mm,伊犁巩乃斯河的年降水量在1 000 mm以上[18],相对于周边的荒漠区(不足100 mm)是一个“湿岛”,因此亚洲中亚众多河流的发源于天山山区,例如锡尔河、阿姆河及伊犁河等,为中亚的生态系统和社会经济的发展提供了宝贵的水源。
APHRO’s数据集是日本APHRODITE(Asian Precipitation-Highly-Resolved Observational Data Integration Towards Evaluation of Water Resources)水资源研究计划发展的一套逐日气温和降水格点数据集,空间分辨率为0.25°×0.25°,研究区内共有格点1 276个(其中1 500 m海拔以下区域:423个,1 500~3 000 m之间区域:554个,大于3 000 m:299个)时间长度为1951年/1961~2007年(降水/气温)。APHRO’s数据集的精度高[30,31],并能反映降水随地形的变化[32],相对于其他数据集更适合用来研究天山山区的气候变化。但是这套数据目前只更新到2007年,在此基础上,本文根据2008~2015年的ERA-Interim气温和降水数据,将APHRO’s数据集延长到2015年。ERA-Interim逐日气温和降水数据集由欧洲气象中心(ECWMF)提供,空间分辨率同样为0.25°×0.25°。
采用相关系数(R2)、均方根误差(
表1 评估日尺度的APHRO’s 数据和ERA-Interim数据
Table 1 The evaluation results of daily scale datasets between APHRO’s and ERA-Interim
变量 | 格点 | 区域 | ||||||
|---|---|---|---|---|---|---|---|---|
| RMSE | 格点数 | MAPD | 格点数 | R2 | RMSE | MAPD | ||
| 气温 | < 2℃ | 1064/1276 | < 0.25 | 775/1276 | 0.99 | 1.35 | 0.29 | |
| 降水量 | < 3 mm | 684/1276 | < 1.3 | 831/1276 | 0.57 | 3.28 | 1.29 | |
文中降雪量的估算方法是先用温度阈值模型模拟降雪率,在此基础上,结合降水量数据估算降雪量;其次,用Mann-Kendall (MK)非参数检验方法检验气温、降水、降雪等气象要素的变化趋势;最后,用交叉象限图来阐述气温变化与降雪变化之间的关系。
1.3.1 降雪量估算方法
降水形式包括液态降水和固态降水2种形式。根据降水时的气温情况[2,34],一次降雨过程包括3种可能:降雨、降雪及雨雪混合。本文研究假定其他形式降水(霰、露及雹等)的量可以忽略不计,这样降雨率和降雪率的总和为1。降雪率可由下面公式计算[34]:
式中,Fs是降雪率,T0是气温(℃), Tsnowfall是发生降雪的基本温度(℃),Trainfall是发生降雨的基本温度(℃)。根据Irannezhad等[34]的研究结果,Tsnowfall的范围为-6.1~0℃,Trainfall的范围为-0.1~3.5℃。本文根据Deng[16]研究方法,Tsnowfall的取值为-2.0℃,而Trainfall的取值为3.5℃。
Snowi = (Fs)i×Pi (2)
式中,Snowi为第i天的降雪量,(Fs)i为第i天的降雪率,Pi为第i天的降水量。
1.3.2 趋势检测
趋势分析是气候和水文领域时间序列分析的重要内容。时间序列的趋势分析方法主要包括参数检验和非参数检验这两类。而气候和水文时间序列过程具有非正态分布和缺失值等特点,使得用参数统计检验方法得到的趋势变化结果往往不可信[35]。但非参数检验方法不受这些特点的限制,其中Mann-Kendall 趋势检验方法最为常用[35,36,37,38]。因此,本文用Mann-Kendall (MK)法方检验气温、降水及降雪变化趋势。
1.3.3 交叉象限图
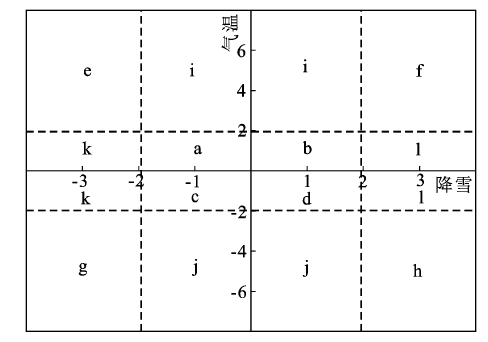
山区是一个独特的地理单元,全球变暖的大背景下,山区的降雪将会怎样变化,值得探索。气温是影响山区降雪的主要因子。本文运用交叉象限图是用来解释天山山区降雪变化与气温变化之间关系[16](图2)。交叉象限图的每一个子区域,都表示不同类型的气温和降雪关系,其优点是直观明了[16]。
图2 气温和降雪变化的交叉象限图
虚线为±1.96。子区域a+b+c+d:气温和降雪变化都不显著;e:升温显著,降雪显著减少;f:升温显著降雪显著增加;g:气温显著降低,降雪显著增加;h:气温显著降低,降雪显著减少;i:升温显著,降雪变化不显著;j:气温显著减少,降雪变化不显著;k:气温变化不显著,降雪显著减少;l:气温变化不显著,降雪显著增加
Fig.2 Cross-Quadrant diagram plotting
天山山区的年平均气温大约在4~5℃左右,自1961年以来,一直处于升温状态,速率为0.027℃/a(P<0.01,表2),到21世纪初平均气温上升了近1℃。季节变化分析结果表明,冬半年的升温速度大于夏半年的升温速度(表2)。具体而言,冬季的升温趋势最大,达到了0.034℃/a(P<0.05),其次是春季为0.032℃/a(P<0.01),而夏季(0.019℃/a,P<0.01)和秋季(0.023℃/a,P<0.01)的升温速率小于年平均气温的升温速率(表2)。因此,冬半年的升温加速拉动了天山山区气温的升高,这与全球气温升温特征一致[39]。
表2 1961~2015年天山山区气温变化趋势
Table 2 The trends of air temperature in Tianshan Mountains during 1961-2015
| 平均值±标准差(℃) | 趋势(℃/a) | Z值 | 显著性 | |
|---|---|---|---|---|
| 年均 | 4.53±0.78 | 0.027 | 4.18 | *** |
| 冬季 | -10.6±1.53 | 0.034 | 2.52 | ** |
| 春季 | 5.43±1.16 | 0.032 | 2.91 | *** |
| 夏季 | 16.27±0.59 | 0.019 | 3.37 | *** |
| 秋季 | 4.32±0.98 | 0.023 | 2.97 | *** |
从空间变化特征来看,整个天山山区在过去50 a中以升温为主,大部分区域升温幅度在0~0.04℃/a之间。也有部分区域表现为降温趋势,主要分布在天山中西部的局部区域。冬季升温速度最明显(图略),升温速率达到0.06~0.1℃/a,而春季、夏季及秋季的升温速率都较冬季要小。同时,在天山中西部的局部区域呈降温趋势,降温幅度大约-0.02~-0.05℃/a。
大气边界层的直接热源为地面长波辐射,因此气温随海拔升高而降低。天山山区的气温垂直变化特征很明显,整体上都有一个变暖的趋势(图略)。1 500 m以下海拔区域的年平均气温最高,在8~10℃左右,而自20世纪80年代中期以来升温明显,到21世纪初,年平均气温已经超过10℃。该区域主要位于河谷低地,例如伊犁河谷。1 500~3 000 m之间区域的年平均气温在2~4℃左右,同样过去30 a升温趋势明显,到21世纪初年平均气温已经超过4℃。海拔3 000 m以上区域的年平均气温在-2℃左右徘徊,但自20世纪80年代中以来升温趋势明显,到21世纪初已近接近0℃。3 000 m海拔以上区域是天山的冰川和积雪分布区,是该区域的固态水资源储藏区域,如果该区域的年平均气温达到0℃,将会加速冰川和积雪的消融。高海拔区域的升温将会对山区的冰川和积雪的积累起到负面影响。因此,需要加强对该区域的气温监测。
天山山区多年平均降水量在280 mm左右,近50 a来整体上呈增加的趋势,增加速率约为0.13 mm/a,但不显著(表3)。与多年平均气温变化结果(表3)结合分析表明,过去50多年天山山区的气候变化特征为增温增湿。季节变化分析结果表明,冬半年的降水呈增加趋势而夏半年则降水呈减少趋势(表3)。冬季降水的增加速率为0.42 mm/a,并通过0.01水平下的显著性检验(表3),秋季增加速率为0.24 mm/a(P<0.1)。春季和夏季的降水量最多,而这两季节的降水量都呈减少趋势,但只有春季通过了0.1水平的显著性检验,夏季递减趋势不明显(表3)。冬季和秋季的降水量相对较少,这2个季节多年平均降水总量在90 mm左右(表3)。春季和夏季的降水量比较大,同时春季是以固态降水,即降雪为主,夏季是以液态降水为主。
表3 1961~2015年天山山区降水变化趋势
Table 3 The trends of precipitation in the Tianshan Mountains during 1961-2015
| 平均值±标准差(mm) | 趋势(mm/a) | Z值 | 显著性 | |
|---|---|---|---|---|
| 年均 | 278.7±42.9 | 0.13 | 0.69 | - |
| 冬季 | 40.29±11.57 | 0.42 | 4.28 | *** |
| 春季 | 86.4±20.3 | -0.35 | -1.67 | * |
| 夏季 | 79.6±17.8 | -0.12 | -0.81 | - |
| 秋季 | 51.6±14.8 | 0.24 | 1.77 | * |
降水空间变化特征显示,天山中、东部降水呈增加趋势,增加速率在0~1.5 mm/a之间,而天山西部降水呈减少趋势,最大减少速率在-2~-6 mm/a之间。冬季大部分区域呈增加趋势,主要位于天山的西风迎风坡区域,而塔里木盆地北部和东天山区域呈减少趋势。春季降水增加区域位于天山中部和东天山区域,而天山西部和北部呈减少趋势。夏季降水增加区域主要位于天山中部,特别是开都河流域降水增加幅度大,达1~1.5 mm/a。秋季的降水增加幅度和减少幅度都比较小。
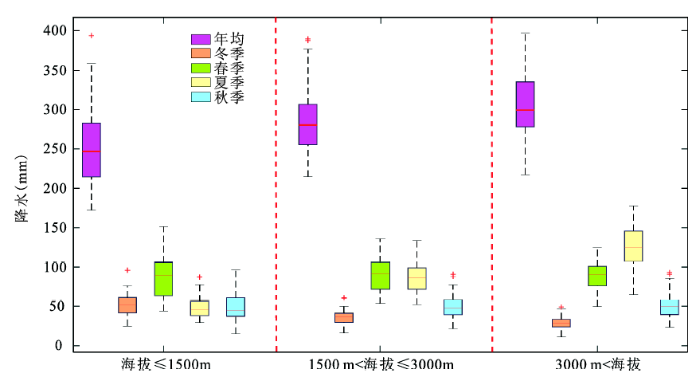
降水随海拔变化的规律比气温要复杂。天山山区最大降水量位于海拔高度2 000~4 000 m之间的区域。为进一步揭示天山山区降水在不同海拔区域的年变化和季节变化特征,我们分析了降水在不同海拔区域的变化对比(图3)。1 500 m海拔以下区域降水量主要集中在春季,大约占了全年降水量的40%左右;1 500~3 000 m区域降水量集中在春、夏这2个季节,占了全年降水量的三分之二;3 000 m以上区域降水量主要集中在夏季,其次是春季。
图3 不同海拔区域的降水特征分析
Fig.3 The characteristics analysis of precipitation in different elevation bands
天山山区多年平均降雪量大约在80 mm左右。1 500 m海拔以下区域,冬季的平均降雪量最大,达到12 mm左右,而其他季节的降雪量非常少。1 500~3 000 m区域,同样是冬季的平均降雪量最大。3 000 m海拔以下区域的夏季的降雪量基本上为0,除个别区域外。3 000 m海拔以上区域,春季的平均降雪量最大,此外冬季和秋季的降雪量都在10 mm左右,而夏季也有少量的降雪量,大约为2~3 mm左右。
天山中部的降雪呈增加趋势,增加速率大约0~0.15 mm/a,而天山西部和东部区域呈减少趋势,减少速率达-0.15~-0.2 mm/a。季节平均降雪量变化分析结果表明(图4),冬季降雪的增加区域主要位于天山的中部和东部区域,而天山西部的局部区域呈减少趋势;春季和秋季的空间变化特征相似,夏季的变化不大。
图4 1961~2015年天山山区降雪量的空间变化趋势
Fig.4 The trends of snowfall in the Tianshan Mountains during 1961-2015
1961~2015年天山山区整体上以变暖趋势为主,增温速率约0.027℃/a。山区变暖不仅加速了冰川和积雪消融,而且影响降水形式的变化。本文的降雪数据是基于最常用的温度阈值计算方法模拟得到,具体算法详见方法2.3.1部分。
气温和降水数据的空间分辨率都是0.25°×0.25°,研究区域内共有格点1 276个。1 500 m海拔以下区域共有格点423个,其中71.9%的格点表现为温度显著升高,但降雪变化不明显(图5a和表4)。同时,有6.2%的格点为温度显著升高,降雪显著减少;有14.6%的格点表现为温度显著升高,降雪也显著增加。此外,有5.9%的格点气温没有显著升高,降水也没有显著变化;但有1.4%的格点表现为气温无显著变化,降水表现为显著增加。海拔1 500~3 000 m之间区域共有格点554个,而56%的格点是温度显著升高而降雪变化不显著(图5b和表4);3.4%的格点为温度显著升高而降雪显著减少,而有16%的格点表现为温度显著升高而降雪也显著增加;此外,有20.4%的格点为气温和降雪都没有显著变化,有4.2%的格点表现为气温没有显著的变化,而降雪呈显著的增加趋势。3 000 m海拔以上区域格点个数为299个,其中47.2%的格点为气温显著升高而降雪变化不明显(图5c和表4);另外,有4.3%的格点降雪显著减少随着气温显著升高,而有5.4%的格点温度显著升高同时降雪也显著增加。值得注意的是,该区域有18.1%的格点降雪呈显著增加趋势但温度没有显著变化。
图5 1961~2015年天山山区不同海拔高度带的降雪变化
蓝点表示气温和降雪趋势检验的Z值,红色虚线为±1.96;趋势检验方法为M-K趋势检验方法。
Fig.5 The trends of snowfall in different elevation bands in the Tianshan Mountains during 1961-2015
表 4 1961~2015年天山山区不同海拔高度带的气温和降雪变化不同对应情况
Table 4 The trends of air temperature and snowfall in different elevation bands in the Tianshan Mountains during 1961-2015
| 高度带 | a+b+c+d | e | f | g | h | i | j | k | l |
|---|---|---|---|---|---|---|---|---|---|
| A | 25 | 26 | 62 | 0 | 0 | 304 | 0 | 0 | 6 |
| B | 113 | 19 | 88 | 0 | 0 | 310 | 1 | 0 | 23 |
| C | 74 | 13 | 16 | 0 | 1 | 141 | 0 | 0 | 54 |
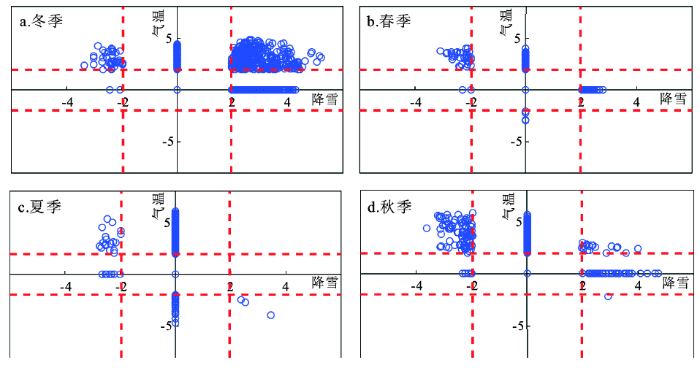
降雪的季节变化与温度的变化紧密相关。冬季大部分格点(45.7%)气温升温显著但降雪变化不显著(图6a和表5),约3.1%的格点的降雪呈显著减少趋势随着气温的显著升高,但有28.8%的格点的降雪随气温显著升高而显著增加,有11.7%的格点的气温和降雪都没有显著变化,此外有10.5%的格点的气温无显著变化,但是降雪呈增加的趋势。春季大部分格点(77%)的气温和降雪都无显著变化(图6b和表5),约17.2%的格点的气温升温显著但降雪变化不显著,仅3.1%的格点的降雪随着气温的显著升高而呈显著增加趋势,此外,有2%的格点的降雪呈显著增加趋势但气温无显著变化。夏季47.8%的格点为气温显著升高但降雪无显著变化,47.6%的格点的气温和降雪都无显著变化(图6c和表5),这2种情形就已经占了绝大部分格点个数(95.4%)。另外,夏季有9个格点的温度无显著升温趋势但降雪呈显著减少趋势。秋季的大部分站点(69%)的温度显著升高但降雪无明显变化(图6d和表5),另外18.7%的格点的气温和降雪都无显著变化,有7%的格点的温度显著升高的同时降雪呈显著减少的趋势,有1.4%的格点表现气温和降雪都显著增加。另外,有40个格点的降雪呈显著增加的趋势但气温无明显变化,5个格点的降雪呈显著减少的趋势而气温无明显变化(图6d和表5)。
图6 1961~2015年天山山区降雪季节变化
蓝点表示气温和降雪趋势检验的Z值,红色虚线为±1.96;趋势检验方法为M-K趋势检验方法。
Fig.6 The trends of snowfall in different seasons in the Tianshan Mountains during 1961-2015
表5 1961~2015年天山山区不同季节的气温和降雪变化不同对应情况分析
Table 5 The trend of seasonal temperature and snowfall in the Tianshan Mountains during 1961-2015
| 高度带 | a+b+c+d | e | f | g | h | i | j | k | l |
|---|---|---|---|---|---|---|---|---|---|
| 冬季 | 149 | 40 | 368 | 0 | 0 | 583 | 0 | 2 | 134 |
| 春季 | 987 | 36 | 0 | 0 | 0 | 219 | 4 | 3 | 27 |
| 夏季 | 608 | 18 | 0 | 0 | 3 | 610 | 28 | 9 | 0 |
| 秋季 | 239 | 91 | 18 | 0 | 1 | 882 | 0 | 5 | 40 |
以上分析结果表明, 3 000 m海拔以上区域随气温的升高降雪以增加趋势为主,而3 000 m以下区域随气温的升高降雪以减少趋势为主。同时,降雪的季节变化与气温的变化密切相关,冬季降雪随气温的升高以增加的趋势为主,其他季节都是以减少的趋势为主。高亚洲区域(以青藏高原为主体)的降雪温度范围在-15~4℃左右[16],而最大降雪量发生的温度在1~2℃[16,28]。表6结果表明,山区降雪变化的时空差异显著,与最大降雪量气温、海拔及下垫面性质密切相关。天山山区大部分格点的冬季平均气温远低于2℃,随温度的上升,降雪量会随之增加。而其他季节的平均气温高于2℃,随温度的上升,降雪量会随之减少。即当平均气温低于最大降雪量气温时,升温过程位于最大降雪量气温的左侧,因此随气温升高降雪量呈增加趋势,反之亦然。图6和表6结果表明,天山山区冬季有28.8%的格点的降雪随气温的显著上升呈显著增加趋势。
表6 高亚洲区域降雪变化研究
Table 6 The study on snowfall changes in the High Asia Regions
| 区域 | 研究方法 | 时间序列 | 数据源 | 主要结论 | 文献来源 |
|---|---|---|---|---|---|
| 天山 | 双阈值气温模型 | 1961~2015年 | 格点数据 | 冬季呈增加趋势;高海拔区域呈增加趋势 | 本文 |
| 将雨雪混合全部归为降雪 | 1961~2010年 | 站点数据 | 降雪呈增加趋势;雪雨比呈减少趋势 | [28] | |
| 频率求交法和概率保证法 | 1950s~2014年 | 站点数据 | 雪雨比的变化范围为 0.02~1.79,随着海拔 的升高而增大 | [40] | |
| 青藏高原 | 双阈值气温模型 | 1961~2014年 | 站点数据 | 最大降雪量气温是控制降雪变化的关键因子 | [16] |
| 双阈值气温模型 | 1961~2014年 | 站点数据 | 降雪变化与下垫面性质密切相关 | [41,42] |
文中基于气温和降水数据,运用温度阈值模型,评估了1961~2015年天山山区降雪变化,探讨了暖湿条件下天山山区降雪量的时空变化特征。主要结论如下:
山区冬季的升温趋势最大,达到了0.034℃/a(P<0.05),冬半年升温加速拉动了天山山区气温的增加。冬季降水的增加速率为0.42 mm/a(P<0.01),秋季增加速率为0.24 mm/a(P<0.1)。暖湿条件下,3 000 m海拔以上区域,降雪随气温上升以增加为主,而3 000 m以下区域则相反。降雪量的季节变化特征与最大降雪量气温密切相关,当平均气温低于该温度时,降雪量以增加趋势为主,反之,降雪量以减少趋势为主。
天山山区地形条件复杂,不同区域的气温和降水组合差异较大,西风的迎风坡降水量,而背风坡降水少,因此,其降雪量也会呈现出空间差异。又因为天山山区的气象观测站点少且建站时间短,因此本文数据来源是基于2套格点数据同化后的数据。输入数据的精度给降雪率模型的模拟结果精度带来一定的影响。下一步研究将在当前的基础上,提高模型输入参数的精度(例如,气温和降水数据),细化分区,开展不同区域的降雪量变化特征对比,同时结合卫星遥感数据(如MODIS)进行分析。
The authors have declared that no competing interests exist.
| [1] |
2013: Observations:Atmosphere and surface. In: Climate Change 2013: The Physical Science Basis. Contribution of Working Group I to the Fifth Assessment Report of the Intergovernmental Panel on Climate Change [Stocker TF, D Qin, G-K Plattner, M Tignor, SK Allen, J Boschung, A Nauels, Y Xia, V Bex and PM Midgley (eds.)] . |
| [2] |
A precipitation shift from snow towards rain leads to a decrease in streamflow .https://doi.org/10.1038/nclimate2246 URL [本文引用: 3] 摘要
In a warming climate, precipitation is less likely to occur as snowfall. A shift from a snow- towards a rain-dominated regime is currently assumed not to influence the mean streamflow significantly. Contradicting the current paradigm, we argue that mean streamflow is likely to reduce for catchments that experience significant reductions in the fraction of precipitation falling as snow. With more than one-sixth of the Earth's population depending on meltwater for their water supply and ecosystems that can be sensitive to streamflow alterations, the socio-economic consequences of a reduction in streamflow can be substantial. By applying the Budyko water balance framework to catchments located throughout the contiguous United States we demonstrate that a higher fraction of precipitation falling as snow is associated with higher mean streamflow, compared to catchments with marginal or no snowfall. Furthermore, we show that the fraction of each year's precipitation falling as snowfall has a significant influence on the annual streamflow within individual catchments. This study is limited to introducing these observations; process-based understanding at the catchment scale is not yet provided. Given the importance of streamflow for society, further studies are required to respond to the consequences of a temperature-induced precipitation shift from snow to rain.
|
| [3] |
Potential impacts of a warming climate on water availability in snow-dominated regions [J].https://doi.org/10.1038/nature04141 URL [本文引用: 2] |
| [4] |
Warmer climate: less or more snow? [J].https://doi.org/10.1007/s00382-007-0289-y URL [本文引用: 2] 摘要
Changes in snow amount, as measured by the water equivalent of the snow pack (SWE), are studied using simulations of 21st century climate by 20 global climate models. Although the simulated warming makes snow season to shorten from its both ends in all of Eurasia and North America, SWE at the height of the winter generally increases in the coldest areas. Elsewhere, snow decreases throughout the winter. The average borderline between increasing and decreasing midwinter SWE coincides broadly with the 6120°C isotherm in late 20th century November–March mean temperature, although with some variability between different areas. On the colder side of this isotherm, an increase in total precipitation generally dominates over reduced fraction of solid precipitation and more efficient melting, and SWE therefore increases. On the warmer side, where the phase of winter precipitation and snowmelt are more sensitive to the simulated warming, the reverse happens. The strong temperature dependence of the simulated SWE changes suggests that projections of SWE change could be potentially improved by taking into account biases in simulated present-day winter temperatures. A probabilistic cross verification exercise supports this suggestion.
|
| [5] |
西北干旱区山区融雪期气候变化对径流量的影响 [J].https://doi.org/10.1007/s11783-011-0280-z URL [本文引用: 1] 摘要
利用8个山区气象站1960-2010年日平均气温、降水和7个出山口水文站的年径流数据(1960-2008),统计分析了山区融雪期开始时间、结束时间、天数、温度和降水的变化趋势及其空间差异性,并定量评估了年径流量对融雪期温度和降水变化的敏感性.结果表明,近50年来,山区融雪期平均提前了15.33天,延迟了9.19天;其中,天山南部山区融雪期提前时间最长,为20.01天,而延迟时间最短,仅6.81天;祁连山北部山区融雪期提前时间最短(10.16天),而延迟时间最长(10.48天).这显示山区融雪期提前时间越长,延迟时间则越短.山区融雪期平均降水量增加了47.3 mm,平均温度升高了0.857℃;其中天山南部山区降水增量最大,达65 mm,昆仑山北部山区降水和温度增量均最小,分别为25 mm和0.617 ℃,而祁连山北部山区温度增量最高(1.05℃).河流径流量对融雪期气候变化敏感,降水变化诱发年径流量变化了7.69%,温度变化使得年径流量改变了14.15%.
The effect of climate change during snowmelt period on streamflow in the mountainous areas of Northwest China .https://doi.org/10.1007/s11783-011-0280-z URL [本文引用: 1] 摘要
利用8个山区气象站1960-2010年日平均气温、降水和7个出山口水文站的年径流数据(1960-2008),统计分析了山区融雪期开始时间、结束时间、天数、温度和降水的变化趋势及其空间差异性,并定量评估了年径流量对融雪期温度和降水变化的敏感性.结果表明,近50年来,山区融雪期平均提前了15.33天,延迟了9.19天;其中,天山南部山区融雪期提前时间最长,为20.01天,而延迟时间最短,仅6.81天;祁连山北部山区融雪期提前时间最短(10.16天),而延迟时间最长(10.48天).这显示山区融雪期提前时间越长,延迟时间则越短.山区融雪期平均降水量增加了47.3 mm,平均温度升高了0.857℃;其中天山南部山区降水增量最大,达65 mm,昆仑山北部山区降水和温度增量均最小,分别为25 mm和0.617 ℃,而祁连山北部山区温度增量最高(1.05℃).河流径流量对融雪期气候变化敏感,降水变化诱发年径流量变化了7.69%,温度变化使得年径流量改变了14.15%.
|
| [6] |
The objective use of upper air soundings to specify precipitation type [J].https://doi.org/10.1175/1520-0493(1980)108<0596:TOUOUA>2.0.CO;2 URL [本文引用: 2] |
| [7] |
Classification of precipitation types during transitional winter weather using the RUC Model and polarimetric radar retrievals [J].https://doi.org/10.1175/JAMC-D-11-091.1 URL [本文引用: 1] 摘要
A new hydrometeor classification algorithm that combines thermodynamic output from the Rapid Update Cycle (RUC) model with polarimetric radar observations is introduced. The algorithm improves upon existing classification techniques that rely solely on polarimetric radar observations by using thermodynamic information to help to diagnose microphysical processes (such as melting or refreezing) that might occur aloft. This added information is especially important for transitional weather events for which past studies have shown radar-only techniques to be deficient. The algorithm first uses vertical profiles of wet-bulb temperature derived from the RUC model output to provide a background precipitation classification type. According to a set of empirical rules, polarimetric radar data are then used to refine precipitation-type categories when the observations are found to be inconsistent with the background classification. Using data from the polarimetric KOUN Weather Surveillance Radar-1988 Doppler (WSR-88D) located in Norman, Oklahoma, the algorithm is tested on a transitional winter-storm event that produced a combination of rain, freezing rain, ice pellets, and snow as it passed over central Oklahoma on 30 November 2006. Examples are presented in which the presence of a radar bright band (suggesting an elevated warm layer) is observed immediately above a background classification of dry snow (suggesting the absence of an elevated warm layer in the model output). Overall, the results demonstrate the potential benefits of combining polarimetric radar data with thermodynamic information from numerical models, with model output providing widespread coverage and polarimetric radar data providing an observation-based modification of the derived precipitation type at closer ranges.
|
| [8] |
On the simulation of winter precipitation types [J].https://doi.org/10.1029/2005JD006665 URL [本文引用: 1] 摘要
[1] Winter storms produce major problems for society, and the key responsible factor is often the varying types of precipitation. The objective of this study is to better understand the formation of different types of winter precipitation (freezing rain, ice pellets, snow, slush, wet snow and refrozen wet snow) within the varying and interacting environmental conditions in many winter storms. To address this issue, a one-dimensional cloud model utilizing a double-moment bulk microphysics scheme has been developed. Temperature and moisture profiles favorable for the formation of different winter precipitation types were varied in a systematic manner in an environment where snow is falling continuously through a temperature inversion. The ensuing precipitation evolved as a result of the variations in atmospheric temperature and moisture arising from phase changes such as melting and freezing. This study underlines the often complex manner through which different precipitation types form. It also demonstrates that the formation of semimelted particles can have a profound effect on the evolution of precipitation types aloft and at the surface. Furthermore, some types of precipitation only form within a narrow range of environmental conditions.
|
| [9] |
Assimilation of snow covered area information into hydrologic and land-surface models [J].https://doi.org/10.1016/j.advwatres.2005.10.001 URL [本文引用: 1] 摘要
This paper describes a data assimilation method that uses observations of snow covered area (SCA) to update hydrologic model states in a mountainous catchment in Colorado. The assimilation method uses SCA information as part of an ensemble Kalman filter to alter the sub-basin distribution of snow as well as the basin water balance. This method permits an optimal combination of model simulations and observations, as well as propagation of information across model states. Sensitivity experiments are conducted with a fairly simple snowpack/water-balance model to evaluate effects of the data assimilation scheme on simulations of streamflow. The assimilation of SCA information results in minor improvements in the accuracy of streamflow simulations near the end of the snowmelt season. The small effect from SCA assimilation is initially surprising. It can be explained both because a substantial portion of snowmelts before any bare ground is exposed, and because the transition from 100% to 0% snow coverage occurs fairly quickly. Both of these factors are basin-dependent. Satellite SCA information is expected to be most useful in basins where snow cover is ephemeral. The data assimilation strategy presented in this study improved the accuracy of the streamflow simulation, indicating that SCA is a useful source of independent information that can be used as part of an integrated data assimilation strategy.
|
| [10] |
The surface energy balance of a snow cover: Comparing measurements to two differentsimulation models [J].https://doi.org/10.1007/s007040170007 URL [本文引用: 1] 摘要
We compared two one-dimensional simulation models for heat and water fluxes in the soil-snow-atmosphere system with respect to their mathematical formulations of the surface heat exchange and the snow pack evolution. They were chosen as examples of a simple one-layer snow model and a more detailed multiple-layer snow model (SNTHERM). The snow models were combined with the same one-dimensional model for the heat and water balance of the underlying soil (CoupModel). Data from an arable field in central Sweden (Marsta), covering two years (1997–1999) of soil temperature, snow depth and eddy-correlation measurements were successfully compared with the models. Conditions with a snow pack deeper or shallower than 1065cm and bare soil resulted in similar discrepancies. The simulated net radiation and sensible heat flux were in good agreement with that measured during snow-covered periods, except for situations with snowmelt when the downward sensible heat flux was overestimated by 10–2065Wm 612 . The results showed that the uncertainties in parameter values were more important than the model formulation and that both models were useful in evaluating the limitations and uncertainties of the measurements.
|
| [11] |
Precipitation types in the transition region of winter storms [J].https://doi.org/10.1175/1520-0477(1992)0732.0.CO;2 URL [本文引用: 1] 摘要
Winter storms often produce snow, freezing rain, and ice pellets. The characteristics and formation of these forms of precipitation as well as their location within storms are reviewed. Phenomena such as accretion and fog can be related to this precipitation as well.
|
| [12] |
A distributed hydrology-vegetation model for complex terrain [J].https://doi.org/10.1029/94WR00436 URL [本文引用: 1] 摘要
A distributed hydrology-vegetation model is described that includes canopy interception, evaporation, transpiration, and snow accumulation and melt, as well as runoff generation via the saturation excess mechanisms. Digital elevation data are used to model topographic controls on incoming solar radiation, air temperature, precipitation, and downslope water movement. Canopy evapotranspiration is represented via a two-layer Penman-Monteith formulation that incorporates local net solar radiation, surface meteorology, soil characteristics and moisture status, and species-dependent leaf area index and stomatal resistance. Snow accumulation and ablation are modeled using an energy balance approach that includes the effects of local topography and vegetation cover. Saturated subsurface flow is modeled using a quasi three-dimensional routing scheme. The model was applied at a 180-m scale to the Middle Fork Flathead River basin in northwestern Montana. This 2900-km, snowmelt-dominated watershed ranges in elevation from 900 to over 3000 m. The model was calibrated using 2 years of recorded precipitation and streamflow. The model was verified against 2 additional years of runoff and against advanced very high resolution radiometer based spatial snow cover data at the 1-kmscale. Simulated discharge showed acceptable agreement with observations. The simulated areal patterns of snow cover were in general agreement with the remote sensing observations, but were lagged slightly in time.
|
| [13] |
Validation of the snow submodel of the biosphere: atmosphere transfer scheme with Russian snow cover and meteorological observational data [J].https://doi.org/10.1175/1520-0442(1997)0102.0.CO;2 URL [本文引用: 1] 摘要
Snow cover is one of the most important variables affecting agriculture, hydrology, and climate, but detailed measurements are not widely available. Therefore, the effectiveness and validity of snow schemes in general circulation models have been difficult to assess. Using long-term snow cover data from the former Soviet Union, this paper focuses on the validation of the snow submodel in the Biosphere-Atmosphere Transfer Scheme (BATS) using 6 years of data (1978-83) at six stations. Fundamental uncertainties in the datasets limit the accuracy of our assessment of the model's performance. In the absence of a wind correction for the gauge-measured precipitation and with the standard rain-snow transition criterion (2.2 C), the model gives reasonable simulations of snow water equivalent and surface temperature for all of the six stations and the six winters examined. In particular, the time of accumulation and the end of ablation and the alteration due to aging are well captured. With some simple modifications of the code, the model can also reproduce snow depth, snow cover fraction, and surface albedo. In view of the scheme's simplicity and efficiency, these results are encouraging. However, if a wind correction is applied to the gauge-measured precipitation, the model shows increased root-mean-square errors in snow water equivalent for all six stations except Tulun. Perhaps, the better agreement without wind correction means that the snow has blown beyond the area of snow measurement, as might be accounted for only by a detailed regional snow-wind distribution model. This study underlines four aspects that warrant special attention: (i) estimation of the downward longwave radiation, (ii) separation of the aging processes for snowpack density and snow surface albedo, (iii) parameterization of snow cover fraction, and (iv) choice of critical temperature for rain-snow transition.
|
| [14] |
Energy and mass balance of Zhadang glacier surface, central Tibetan Plateau [J].https://doi.org/10.3189/2013JoG12J152 URL [本文引用: 1] 摘要
<div class="abstract" data-abstract-type="normal"> Climate variables that control the annual cycle of the surface energy and mass balance on Zhadang glacier in the central Tibetan Plateau were examined over a 2 year period using a physically based energy-balance model forced by routine meteorological data. The modelled results agree with measured values of albedo, incoming longwave radiation, surface temperature and surface level of the glacier. For the whole observation period, the radiation component dominated (82%) the total surface energy heat fluxes. This was followed by turbulent sensible (10%) and latent heat (6%) fluxes. Subsurface heat flux represented a very minor proportion (2%) of the total heat flux. The sensitivity of specific mass balance was examined by perturbations of temperature (1 K), relative humidity (20%) and precipitation (卤20%). The results indicate that the specific mass balance is more sensitive to changes in precipitation than to other variables. The main seasonal variations in the energy balance were in the two radiation components (net shortwave radiation and net longwave radiation) and these controlled whether surface melting occurred. A dramatic difference in summer mass balance between 2010 and 2011 indicates that the glacier surface mass balance was closely related to precipitation seasonality and form (proportion of snowfall and rainfall).
|
| [15] |
The dependence of precipitation types on surface elevation and meteorological conditions and its parameterization [J].https://doi.org/10.1016/j.jhydrol.2014.03.038 URL [本文引用: 1] 摘要
Precipitation types (rain, snow, and sleet) have great impacts on the surface runoff and energy balance. However, many weather stations only record precipitation amount without discriminating its type. Based on CMA (China Meteorological Administration) station data over 30years, this study investigates the relationship of precipitation types with surface elevation and meteorological variables. Major findings are (1) wet-bulb temperature is a better indicator than air temperature for discriminating precipitation types; (2) precipitation types are highly dependent on surface elevation, and a higher threshold temperature is needed for differentiating snow and rain over a higher-elevation region; and (3) precipitation types are also dependent on relative humidity, and the probability of sleet event rises greatly with the increase of relative humidity. Based on these findings, a new parameterization scheme is developed to determine the precipitation type, with input of daily mean wet-bulb temperature, relative humidity, and surface elevation. Evaluations for China territory show that the new scheme gives better accuracy than 11 other schemes that are used in hydrological and land surface models.
|
| [16] |
Changes of snowfall under warming in the Tibetan Plateau [J].https://doi.org/10.1002/2017JD026524 URL [本文引用: 6] 摘要
Abstract Snowfall is a critical part of the hydrological system in high-altitude regions and strongly impacted by climate change. This study uses a threshold temperature method to estimate spatial and temporal variations of snowfall at 71 stations across the Tibetan Plateau from 1960-2014. Regional air temperature and precipitation have increased by 0.039 C/yr, and 1.43 mm/yr, respectively. While warming rates have been fairly uniform across the plateau, spatial variations in snowfall trends are large, with decreases in the eastern and north-eastern areas but increases at higher elevations in the centre and west. Region wide snowfall increased during 1961-1990 and 1971-2000, but decreased in 1981-2010 and 1991-2014. Wintertime snowfall has increased but summer snowfall has decreased. These divergent trends can be explained because maximum snowfall is recorded at temperatures between 1 and 2 C. Above/below this threshold snowfall usually decreases/increases with increased warming. Although maximum snowfall temperature is a key factor to understand future snowfall changes, concurrent influences such as changing moisture sources and atmospheric circulation patterns require further research.
|
| [17] |
Development of a long-term daily gridded temperature dataset and its application to rain/snow discrimination of daily precipitation [J]. |
| [18] |
|
| [19] |
Climate change will affect the Asian Water Towers [J].https://doi.org/10.1126/science.1183188 URL PMID: 20538947 [本文引用: 1] 摘要
More than 1.4 billion people depend on water from the Indus, Ganges, Brahmaputra, Yangtze, and Yellow rivers. Upstream snow and ice reserves of these basins, important in sustaining seasonal water availability, are likely to be affected substantially by climate change, but to what extent is yet unclear. Here, we show that meltwater is extremely important in the Indus basin and important for the Brahmaputra basin, but plays only a modest role for the Ganges, Yangtze, and Yellow rivers. A huge difference also exists between basins in the extent to which climate change is predicted to affect water availability and food security. The Brahmaputra and Indus basins are most susceptible to reductions of flow, threatening the food security of an estimated 60 million people.
|
| [20] |
Changes in central Asia’s water tower: Past, Present and Future [J].https://doi.org/10.1038/srep35458 URL [本文引用: 1] |
| [21] |
中国天山山区近40 a来的年气候变化 [J].
依据中国天山山区8站1959-2000年的气温降水资料,建立天山山区年平均气温、年降水量序列,利用距平分析、滑动平均、最大熵谱、经验正交、线性回归等方法,分析天山山区近40 a来气候变化的基本特征,结果表明:①天山山区年平均气温存在4暖3冷的冷暖变化阶段,最冷年与最暖年分别是1984年和1998年,其变化具有3 a和6 a的显著周期;天山山区年降水量具有3多3少的干湿变化阶段,降水最多年与最少年分别是1998年和1997年,年降水量变化具有2,4,9 a的显著周期.②天山山区年平均气温最主要的空间分布特征是大西沟、巴音布鲁克年平均气温与其余6站呈反向变化,其次是除新源外,其余7站年平均气温呈同向变化;天山山区年降水量的最主要空间分布特征是8站降水的同向变化,其次为昭苏、新源、大西沟、巴音布鲁克、巴伦台年降水与小渠子、天池呈反向变化.③20世纪60-80年代,天山山区年平均气温与30 a平均值相同, 90年代升温达到0.6 ℃;从60-90年代天山山区年降水表现为持续增多;90年代是4个年代中气温最高、降水最多的年代.④近42 a来,天山山区年平均气温存在着明显的线性升温趋势.
Annual climate change in the Tianshan Mountainous since recent 40 years .
依据中国天山山区8站1959-2000年的气温降水资料,建立天山山区年平均气温、年降水量序列,利用距平分析、滑动平均、最大熵谱、经验正交、线性回归等方法,分析天山山区近40 a来气候变化的基本特征,结果表明:①天山山区年平均气温存在4暖3冷的冷暖变化阶段,最冷年与最暖年分别是1984年和1998年,其变化具有3 a和6 a的显著周期;天山山区年降水量具有3多3少的干湿变化阶段,降水最多年与最少年分别是1998年和1997年,年降水量变化具有2,4,9 a的显著周期.②天山山区年平均气温最主要的空间分布特征是大西沟、巴音布鲁克年平均气温与其余6站呈反向变化,其次是除新源外,其余7站年平均气温呈同向变化;天山山区年降水量的最主要空间分布特征是8站降水的同向变化,其次为昭苏、新源、大西沟、巴音布鲁克、巴伦台年降水与小渠子、天池呈反向变化.③20世纪60-80年代,天山山区年平均气温与30 a平均值相同, 90年代升温达到0.6 ℃;从60-90年代天山山区年降水表现为持续增多;90年代是4个年代中气温最高、降水最多的年代.④近42 a来,天山山区年平均气温存在着明显的线性升温趋势.
|
| [22] |
1960~2010年中国天山山区气候变化区域差异及突变特征 [J].https://doi.org/10.11820/dlkxjz.2012.11.008 URL Magsci [本文引用: 1] 摘要
利用天山山区32 个气象站点1960-2010 年的逐月平均气温、降水数据和DEM数据等,进行了气候时空变化趋势和突变分析,研究结果表明:山区近50 年来年均气温呈明显的上升趋势,21 世纪以来年均温增加最明显,季节均温与年均温的变化趋势基本一致,冬季均温增加最明显,夏季均温变化最小;山区东段升温趋势最明显,北坡的变化趋势明显于南坡.自20 世纪60 年代以来降水量持续递增,其中80 年代开始更加明显;夏季降水量增加最明显,春季变化最小,山区年降水主要集中在春夏两季;山区气候空间分布呈现“两中心”的特征,东段为“干热”中心,西北部为“暖湿”中心,这两个中心的气候反差有扩大的趋势;山区气温和降水突变不太明显,春夏季气温突变可能发生在20 个世纪90 年代末至21 世纪初;秋冬季气温突变在20 世纪90 年代可能发生过;南坡和东段年均温突变可能发生在1982 年,北坡大致发生在1990 年左右.秋季降水突变发生在20 世纪80 年代末,其他季节不明显,年降水突变发生在80年代末期.
The regional difference and abrupt events of climatic change in Tianshan Mountains during 1960-2010 .https://doi.org/10.11820/dlkxjz.2012.11.008 URL Magsci [本文引用: 1] 摘要
利用天山山区32 个气象站点1960-2010 年的逐月平均气温、降水数据和DEM数据等,进行了气候时空变化趋势和突变分析,研究结果表明:山区近50 年来年均气温呈明显的上升趋势,21 世纪以来年均温增加最明显,季节均温与年均温的变化趋势基本一致,冬季均温增加最明显,夏季均温变化最小;山区东段升温趋势最明显,北坡的变化趋势明显于南坡.自20 世纪60 年代以来降水量持续递增,其中80 年代开始更加明显;夏季降水量增加最明显,春季变化最小,山区年降水主要集中在春夏两季;山区气候空间分布呈现“两中心”的特征,东段为“干热”中心,西北部为“暖湿”中心,这两个中心的气候反差有扩大的趋势;山区气温和降水突变不太明显,春夏季气温突变可能发生在20 个世纪90 年代末至21 世纪初;秋冬季气温突变在20 世纪90 年代可能发生过;南坡和东段年均温突变可能发生在1982 年,北坡大致发生在1990 年左右.秋季降水突变发生在20 世纪80 年代末,其他季节不明显,年降水突变发生在80年代末期.
|
| [23] |
Climate change with elevation and its potential impact on water resources in the Tianshan Mountains, Central Asia [J].https://doi.org/10.1016/j.gloplacha.2015.09.015 URL [本文引用: 1] 摘要
Climate change in complex mountain regions has an impact on the change of water resources, especially in arid areas. Here, we use long-term meteorological and hydrological station observation data to analyze the time series of climate indices and runoff to study the variability of climate in the Kaidu River Basin. The analysis results are as follows: 1) the variability rate of low temperature indices are of greater magnitude than high temperature indices; 2) overall, for the river basin, frost days and ice days all exhibited decreasing trends, and growing season lengths increased considerably; 3) during the past 50years, overall precipitation has increased in the river basin, but there are some differences in some seasons, and precipitation from June to August accounts for approximately 66% of the annual precipitation; and 4) temperature lapse rate and precipitation of the mountain region are major factors influencing the change of runoff for the Kaidu River Basin, temperature lapse rates are the main factor influencing the run off change in the spring and fall, and precipitation in the mountain region is the major factor influencing the runoff change in the summer. Generally, climate change in complex mountain regions will be expected to seriously affect water resources in arid regions.
|
| [24] |
天山地区30年来冬季降雪波动研究 [J].
天山地区28个气象台站1961~1990年冬季降雪资料表明,天山北坡冬季降雪大于南坡。天山降雪从西部向东部逐渐减少,由山区向平原盆地逐渐减少,天山西部伊犁河谷冬季降雪最丰,吐鄯托盆地最贫。天山北坡广大地区在1961~1990年的30a中,冬季降雪略有增加。天山西部伊犁河谷及天山北坡由西向东冬季降雪存在10a,7.5a和6a的显著波动周期,天山南坡及吐鄯托盆地冬季降雪周期不明显。
A study on snowfall variation in the Tianshan Mountains during the recent 30 winters .
天山地区28个气象台站1961~1990年冬季降雪资料表明,天山北坡冬季降雪大于南坡。天山降雪从西部向东部逐渐减少,由山区向平原盆地逐渐减少,天山西部伊犁河谷冬季降雪最丰,吐鄯托盆地最贫。天山北坡广大地区在1961~1990年的30a中,冬季降雪略有增加。天山西部伊犁河谷及天山北坡由西向东冬季降雪存在10a,7.5a和6a的显著波动周期,天山南坡及吐鄯托盆地冬季降雪周期不明显。
|
| [25] |
天山地区冬季降雪量及其集中度和集中期的变化特征 [J].
利用1961年-2010年天山地区21站的冬季降雪资料,采用线性倾向估计法、反距离加权法和Morlet小波分析等方法,研究了天山地区近50a冬季降雪量及降雪的集中度与集中期的时空变化特征,并在此基础上应用Rescaled Range Analysis分析方法尝试预测了未来该地区冬季降雪量变化的情形。结果表明:天山地区冬季降雪量呈明显上升趋势,未来天山地区冬季降雪量的变化趋势与过去50a冬季降雪量的变化趋势相同,仍将持续上升,冬季降雪的集中度和集中期也呈上升趋势,但空间差异明显;冬季降雪量及降雪的集中度和集中期在一定的时间序列中存在不同周期变化,且周期反映比较明显;此外研究还发现,天山地区南(北)坡冬季降雪量及降雪的集中度和集中期的年际变化也不尽相同。
The change characteristics of winter snowfall, snow concentration degree and concentration period in the Tianshan Mountains .
利用1961年-2010年天山地区21站的冬季降雪资料,采用线性倾向估计法、反距离加权法和Morlet小波分析等方法,研究了天山地区近50a冬季降雪量及降雪的集中度与集中期的时空变化特征,并在此基础上应用Rescaled Range Analysis分析方法尝试预测了未来该地区冬季降雪量变化的情形。结果表明:天山地区冬季降雪量呈明显上升趋势,未来天山地区冬季降雪量的变化趋势与过去50a冬季降雪量的变化趋势相同,仍将持续上升,冬季降雪的集中度和集中期也呈上升趋势,但空间差异明显;冬季降雪量及降雪的集中度和集中期在一定的时间序列中存在不同周期变化,且周期反映比较明显;此外研究还发现,天山地区南(北)坡冬季降雪量及降雪的集中度和集中期的年际变化也不尽相同。
|
| [26] |
新疆积雪对气候变暖的响应 [J].https://doi.org/10.3321/j.issn:0577-6619.2001.04.011 URL Magsci [本文引用: 1] 摘要
积雪对全球变暖的响应是当前正在争论的问题.文中通过地面气象台站和SMMR微波卫星遥感两种积雪资料所建立的两个独立的积雪序列的一致性,证明前者在表现新疆积雪长期变化能力方面具有可靠性.阐明了积雪年际变化特征及其与冬季气温和降水量年际波动的关系,检验了积雪长期变化趋势.研究表明,虽然近50a来新疆冬季变暖十分显著,尤其20世纪90年代为最温暖的时期,但是积雪并未出现持续减少的现象;积雪长期变化表现为显著的年际波动过程叠加在长期缓慢的增加趋势之上.积雪年际波动是冬季降水量和气温两者年际波动共同作用的结果;冬季气温和降雪量变化受不同的欧亚环流振荡所控制;积雪增加趋势与降雪量趋势相一致,这可能是由于全球变暖导致海洋蒸发量增加,以及在寒冷干燥气候下积雪对降雪量变化更为敏感的缘故.
Response of Xinjiang snow cover to climate change .https://doi.org/10.3321/j.issn:0577-6619.2001.04.011 URL Magsci [本文引用: 1] 摘要
积雪对全球变暖的响应是当前正在争论的问题.文中通过地面气象台站和SMMR微波卫星遥感两种积雪资料所建立的两个独立的积雪序列的一致性,证明前者在表现新疆积雪长期变化能力方面具有可靠性.阐明了积雪年际变化特征及其与冬季气温和降水量年际波动的关系,检验了积雪长期变化趋势.研究表明,虽然近50a来新疆冬季变暖十分显著,尤其20世纪90年代为最温暖的时期,但是积雪并未出现持续减少的现象;积雪长期变化表现为显著的年际波动过程叠加在长期缓慢的增加趋势之上.积雪年际波动是冬季降水量和气温两者年际波动共同作用的结果;冬季气温和降雪量变化受不同的欧亚环流振荡所控制;积雪增加趋势与降雪量趋势相一致,这可能是由于全球变暖导致海洋蒸发量增加,以及在寒冷干燥气候下积雪对降雪量变化更为敏感的缘故.
|
| [27] |
1961~2013年新疆雪雨比变化 [J].https://doi.org/10.13866/j.azr.2017.04.23 URL [本文引用: 1] 摘要
基于中国国家气象信息中心发布的1961—2013年全国0.5°×0.5°逐日降水量和逐日平均气温数据集以及气象站点日降水量和气温实测资料,评估了该套格点降水资料在新疆地区的可信度,并利用格点降水资料研究了新疆地区降雪量、降雨量以及雪雨比的时空变化和突变信息。结果表明:内插到气象站点的格点降水数据和气象站点实测降水数据之间的偏差普遍较小,偏差在0.2~1.0 mm的站点个数占总站点数的72.55%,在绝大多数区域二者之间的相关系数均在0.80以上;1961—2013年,新疆降雪量呈微弱的增加趋势,增加幅度为0.11 mm·a~(-1),但没有通过0.05的显著性水平检验。降雨量以0.63 mm·a~(-1)的速率呈明显的增加趋势(P〈0.000 1),突变出现在1992年左右。雪雨比呈下降趋势,幅度为0.01 a-1(P〈0.05),突变出现在1991年左右;降雪量、降雨量及雪雨比表现出一定的空间分布差异,降雪量和降雨量在全区普遍呈增加趋势,而雪雨比在天山山地以北呈增加趋势,在天山山地以及天山山地以南主要呈减少趋势。在新疆冰川分布区域,降雪量倾向率在新疆北部呈增加趋势,而在新疆东南部呈减少趋势;降雨量倾向率呈增加趋势,且新疆东南部降雨量倾向率大于北部;雪雨比倾向率呈现出与降雪量倾向率相似的变化趋势。
Change of snowfall/rainfall ratio in Xinjiang during the period of 1961-2013 .https://doi.org/10.13866/j.azr.2017.04.23 URL [本文引用: 1] 摘要
基于中国国家气象信息中心发布的1961—2013年全国0.5°×0.5°逐日降水量和逐日平均气温数据集以及气象站点日降水量和气温实测资料,评估了该套格点降水资料在新疆地区的可信度,并利用格点降水资料研究了新疆地区降雪量、降雨量以及雪雨比的时空变化和突变信息。结果表明:内插到气象站点的格点降水数据和气象站点实测降水数据之间的偏差普遍较小,偏差在0.2~1.0 mm的站点个数占总站点数的72.55%,在绝大多数区域二者之间的相关系数均在0.80以上;1961—2013年,新疆降雪量呈微弱的增加趋势,增加幅度为0.11 mm·a~(-1),但没有通过0.05的显著性水平检验。降雨量以0.63 mm·a~(-1)的速率呈明显的增加趋势(P〈0.000 1),突变出现在1992年左右。雪雨比呈下降趋势,幅度为0.01 a-1(P〈0.05),突变出现在1991年左右;降雪量、降雨量及雪雨比表现出一定的空间分布差异,降雪量和降雨量在全区普遍呈增加趋势,而雪雨比在天山山地以北呈增加趋势,在天山山地以及天山山地以南主要呈减少趋势。在新疆冰川分布区域,降雪量倾向率在新疆北部呈增加趋势,而在新疆东南部呈减少趋势;降雨量倾向率呈增加趋势,且新疆东南部降雨量倾向率大于北部;雪雨比倾向率呈现出与降雪量倾向率相似的变化趋势。
|
| [28] |
Variation of the proportion of precipitation occurring as snow in the Tian Shan Mountains, China [J].https://doi.org/10.1002/joc.4063 URL [本文引用: 2] 摘要
ABSTRACT Snowfall in mountainous areas provides indispensable water sources for arid and semi-arid watersheds. Changes in snowfall and snowmelt regimes have significantly impacted the water resources' variations and management. This study addresses the ratio of snowfall to precipitation (S/P) in the Tian Shan Mountains, China. It aims to examine changes in S/P ratio and its synchronization with climate change. The results show that the average S/P ratio experienced a downward trend under the precipitation and snowfall increases as well as temperature increases during the cold seasons in 1961 2010. Spatially, the S/P ratios show an increasing trend in the Boertala Valley and the southern slope of the middle Tian Shan Mountains, but a decreasing trend in Yili Valley, and the western and the northern slope of the middle Tian Shan Mountains. The S/P ratios decreased significantly in middle altitudes with elevation ranging from 1500 to 2500 m, but either decreased or increased at elevations below 1500 m due to a temperature inversion in the elevation belt. In high altitudes with elevation over 3500 m, the magnitudes of the decreased S/P ratios were small because the temperature was always below freezing. The decreases in S/P ratio was mainly attributed to the relative changes in snowfall (dS/S) being less than that in precipitation (dP/P), whereas the increases in S/P ratio resulted from the relative changes in snowfall (dS/S) being more than that in precipitation (dP/P). Temperature increases have also lead to the decreases in S/P ratios to some extent.
|
| [29] |
塔吉克斯坦吉萨尔——中国新疆阿克苏10年强震危险区的圈定研究 [J].
帕米尔与天山为当今大陆内部最活跃的地区之一。合作研究该处10年强震危险区在联合国减轻自然灾害10年活动中有重要现实意义。我们在共同编制1:500000地质图、新构造图、卫片解译图、活断层图、强震等震线图及在研究区域重力、磁场、地壳岩石圈厚度、基底等深线的基础上,圈出14个5.5级以上地震危险区。卫片显示的线性构造是基底构造在地表的反映,已切到地表的线性构造-活断层是重要的发震构造。危险区的大小按吉
Studying seismic risk area in Jisaer (Tajikistan)-Aksu (Xinjiang, China) in the next ten years .
帕米尔与天山为当今大陆内部最活跃的地区之一。合作研究该处10年强震危险区在联合国减轻自然灾害10年活动中有重要现实意义。我们在共同编制1:500000地质图、新构造图、卫片解译图、活断层图、强震等震线图及在研究区域重力、磁场、地壳岩石圈厚度、基底等深线的基础上,圈出14个5.5级以上地震危险区。卫片显示的线性构造是基底构造在地表的反映,已切到地表的线性构造-活断层是重要的发震构造。危险区的大小按吉
|
| [30] |
Development of a long-term daily gridded temperature dataset and its application to rain/snow discrimination of daily precipitation [J]. |
| [31] |
Kamiguchi O Arakawa et al. APHRODITE: Constructing a long-term daily gridded precipitation dataset for Asia based on a dense network of rain gauges [J].https://doi.org/10.1175/BAMS-D-11-00122.1 URL [本文引用: 1] |
| [32] |
A gauge-based analysis of daily precipitation over East Asia [J].https://doi.org/10.1175/JHM583.1 URL [本文引用: 1] 摘要
中国科学院机构知识库(CAS IR GRID)以发展机构知识能力和知识管理能力为目标,快速实现对本机构知识资产的收集、长期保存、合理传播利用,积极建设对知识内容进行捕获、转化、传播、利用和审计的能力,逐步建设包括知识内容分析、关系分析和能力审计在内的知识服务能力,开展综合知识管理。
|
| [33] |
APHRODITE高分辨率逐日降水资料在中国大陆地区的适用性 [J].https://doi.org/10.3878/j.issn.1006-9895.2011.11043 URL Magsci 摘要
日本APHRODITE (Asian Precipitation-Highly Resolved Observational Data Integration Towards Evaluation of Water Resources) 研究计划建立了一套高分辨率的逐日亚洲陆地降水数据集 (简称APHRO), 时间从1951年到2007年, 空间分辨率为0.25°×0.25°。本文从气候态、 不同等级降水量分布以及长期变化等方面分析, 通过与中国559个台站观测资料对比, 考察了该降水资料在中国地区的适用性。结果表明: (1) 气候态分布方面, APHRO降水量与台站资料一致, 并且可以准确表征雨带的季节性移动; 但是, 与台站资料相比, 这套资料的降水强度偏小, 而降水频率偏大。 (2) 考察不同等级降水量的分布发现, APHRO资料的暴雨年降水量相对偏少, 而小雨和中雨的年降水量偏多。 (3)APHRO资料揭示的近50年降水量的变化趋势与台站资料大致相同, 并能反映年平均降水频率 “西增东减” 的趋势; 两套资料近50年的年平均降水强度在东南沿海和西北部等区域都呈增加趋势, 但APHRO在华北、 东北和江淮区域的降水强度变化趋势与台站资料差异显著。此外, 在年代际变化方面, APHRO资料对中国东部降水夏季 “南涝北旱” 和 “江南春旱” 强度的描述与台站资料有所不同, 降水量的变化趋势偏弱。
Assessing the quality of APHRODITE high-resolution daily precipitation dataset over contiguous China .https://doi.org/10.3878/j.issn.1006-9895.2011.11043 URL Magsci 摘要
日本APHRODITE (Asian Precipitation-Highly Resolved Observational Data Integration Towards Evaluation of Water Resources) 研究计划建立了一套高分辨率的逐日亚洲陆地降水数据集 (简称APHRO), 时间从1951年到2007年, 空间分辨率为0.25°×0.25°。本文从气候态、 不同等级降水量分布以及长期变化等方面分析, 通过与中国559个台站观测资料对比, 考察了该降水资料在中国地区的适用性。结果表明: (1) 气候态分布方面, APHRO降水量与台站资料一致, 并且可以准确表征雨带的季节性移动; 但是, 与台站资料相比, 这套资料的降水强度偏小, 而降水频率偏大。 (2) 考察不同等级降水量的分布发现, APHRO资料的暴雨年降水量相对偏少, 而小雨和中雨的年降水量偏多。 (3)APHRO资料揭示的近50年降水量的变化趋势与台站资料大致相同, 并能反映年平均降水频率 “西增东减” 的趋势; 两套资料近50年的年平均降水强度在东南沿海和西北部等区域都呈增加趋势, 但APHRO在华北、 东北和江淮区域的降水强度变化趋势与台站资料差异显著。此外, 在年代际变化方面, APHRO资料对中国东部降水夏季 “南涝北旱” 和 “江南春旱” 强度的描述与台站资料有所不同, 降水量的变化趋势偏弱。
|
| [34] |
Wintertime climate factors controlling snow resource decline in Finland [J].https://doi.org/10.1002/joc.4332 URL [本文引用: 3] 摘要
ABSTRACT Numerous studies have reported significant declines in snow resources in Finland and elsewhere during the 20th century. To identify the main climate factors controlling these declines in Finland, this study evaluated long-term variations and trends in wintertime climate, snowpack hydrological processes (SHPs) and continuous snow cover duration (CSCD), and their links to atmospheric circulation patterns (ACPs). Analyses were conducted using observed daily climatological time series and simulated SHPs at three stations in southern (Kaisaniemi), central (Kajaani) and northern (Sodankyl) Finland with about 100 years of data. The Mann-Kendall nonparametric test was used to detect significant trends, the Pearson's coefficient ( r ) to identify relationships within snow-related variables, and Spearman's coefficient ( ) to measure correlations of these variables with ACPs. Sensitivity of the snow-related variables with projected changes in temperature and precipitation was assessed. The results showed increases in wintertime temperature only at Kaisaniemi, but decreases in wintertime precipitation, snowfall and snow water equivalent (SWE) and shorter CSCD at all stations. In general, variations in wintertime temperature were positively associated with the Arctic Oscillation (AO) and the North Atlantic Oscillation (NAO). However, wintertime precipitation showed significant relationships with the East Atlantic/West Russia (EA/WR), AO and West Pacific (WP) patterns in southern, central and northern Finland, respectively. SHPs and CSCD in southern Finland were associated with the same ACP influencing wintertime temperature (AO), and those in central and northern areas with the patterns influencing wintertime precipitation (EA, EA/WR and AO). Thus, declines in snow resources in Finland are mainly the result of reductions in snowfall owing to both wintertime warming and decreased precipitation at Kaisaniemi, while only to decreases in wintertime precipitation at Kajaani and Sodankyl stations. However, increase in precipitation (up to 30%) plays an important role in offsetting effects of temperature warming (up to 4 C) on snow resource decline in Finland.
|
| [35] |
A nonparametric trend test for seasonal data with serial dependence [J].https://doi.org/10.1029/WR020i006p00727 URL [本文引用: 2] 摘要
Statistical tests for monotonic trend in seasonal (eg monthly) hydrologic time series are commonly confounded by some of the following problems: nonnormal data, missing values, seasonality, censoring and serial dependence. An extension of the Mann-Kendall test for trend (designed for such data) is presented here. Because the test is based entirely on tanks, it is robust against nonnormality and censoring.-from Authors
|
| [36] |
Trend detection in hydrologic data: The Mann-Kendall trend test under the scaling hypothesis [J].https://doi.org/10.1016/j.jhydrol.2007.11.009 URL [本文引用: 1] 摘要
The subject of trend detection in hydrologic data has received a great deal of attention lately, especially in connection with the anticipated changes in global climate. However, climatic variability, which is reflected in hydrologic data, can adversely affect trend test results. The scaling hypothesis has been recently proposed for modeling such variability in hydrologic data. In this paper, the Mann endall test, which is widely used to detect trends in hydrologic data, is modified to account for the effect of scaling. Exact expressions for the mean and variance of the test statistic are derived under the scaling hypothesis, and the Normal distribution is shown to remain a reasonable approximation. A procedure for estimating the modified variance from observed data is also outlined. The modified test is applied to a group of 57 worldwide total annual river flow time series from the database of the Global Runoff Data Centre in Koblenz, Germany, that were shown in an earlier study to exhibit significant trends in annual maximum flow. The results show a considerable reduction in the number of stations with significant trends when the effect of scaling is taken into account. These results indicate that the evidence of real trends in hydrologic data is even weaker than suggested by earlier studies, although highly significant increasing trends seem to be more common than negative ones. It is also shown that admitting scaling in the modified test helps to avoid discrepancies found in some previous studies, such as the existence of significant opposite trends in neighboring stations, or in different segments of the same time series.
|
| [37] |
A modified Mann-Kendall trend test for autocorrelated data [J].https://doi.org/10.1016/S0022-1694(97)00125-X URL [本文引用: 1] 摘要
One of the commonly used tools for detecting changes in climatic and hydrologic time series is trend analysis. A number of statistical tests exist to assess the significance of trends in time series. One of the commonly used non-parametric trend tests is the Mann-Kendall trend test. The null hypothesis in the Mann-Kendall test is that the data are independent and randomly ordered. However, the existence of positive autocorrelation in the data increases the probability of detecting trends when actually none exist, and vice versa. Although this is a well-known fact, few studies have addressed this issue, and autocorrelation in the data is often ignored. In this study, the effect of autocorrelation on the variance of the Mann-Kendall trend test statistic is discussed. A theoretical relationship is derived to calculate the variance of the Mann-Kendall test statistic for autocorrelated data. The special cases of AR(1) and MA(1) dependence are discussed as examples. An approximation to the theoretical relationship is also presented in order to reduce computation time for long time series. Based on the modified value of the variance of the Mann-Kendall trend test statistic, a modified non-parametric trend test which is suitable for autocorrelated data is proposed. The accuracy of the modified test in terms of its empirical significance level was found to be superior to that of the original Mann-Kendall trend test without any loss of power. The modified test is applied to rainfall as well as streamflow data to demonstrate its performance as compared to the original Mann-Kendall trend test.
|
| [38] |
Power of the Mann-Kendall and Spearman's rho tests for detecting monotonic trends in hydrological series [J].https://doi.org/10.1016/S0022-1694(01)00594-7 URL [本文引用: 1] 摘要
In many hydrological studies, two non-parametric rank-based statistical tests, namely the Mann endall test and Spearman's rho test are used for detecting monotonic trends in time series data. However, the power of these tests has not been well documented. This study investigates the power of the tests by Monte Carlo simulation. Simulation results indicate that their power depends on the pre-assigned significance level, magnitude of trend, sample size, and the amount of variation within a time series. That is, the bigger the absolute magnitude of trend, the more powerful are the tests; as the sample size increases, the tests become more powerful; and as the amount of variation increases within a time series, the power of the tests decrease. When a trend is present, the power is also dependent on the distribution type and skewness of the time series. The simulation results also demonstrate that these two tests have similar power in detecting a trend, to the point of being indistinguishable in practice. The two tests are implemented to assess the significance of trends in annual maximum daily streamflow data of 20 pristine basins in Ontario, Canada. Results indicate that the P-values computed by these different tests are almost identical. By the binomial distribution, the field significant downward trend was assessed at the significance level of 0.05. Results indicate that a higher number of sites show evidence of decreasing trends than one might expect due to chance alone.
|
| [39] |
Surface air temperature and its changes over the past 150 years [J].https://doi.org/10.1029/1999RG900002 URL [本文引用: 1] 摘要
We review the surface air temperature record of the past 150 years, considering the homogeneity of the basic data and the standard errors of estimation of the average hemispheric and global estimates. We present global fields of surface temperature change over the two 20-year periods of greatest warming this century, 19250900091944 and 19780900091997. Over these periods, global temperatures rose by 0.3700° and 0.3200°C, respectively. The twentieth-century warming has been accompanied by a decrease in those areas of the world affected by exceptionally cool temperatures and to a lesser extent by increases in areas affected by exceptionally warm temperatures. In recent decades there have been much greater increases in night minimum temperatures than in day maximum temperatures, so that over 19500900091993 the diurnal temperature range has decreased by 0.0800°C per decade. We discuss the recent divergence of surface and satellite temperature measurements of the lower troposphere and consider the last 150 years in the context of the last millennium. We then provide a globally complete absolute surface air temperature climatology on a 100° 0103 100° grid. This is primarily based on data for 19610900091990. Extensive interpolation had to be undertaken over both polar regions and in a few other regions where basic data are scarce, but we believe the climatology is the most consistent and reliable of absolute surface air temperature conditions over the world. The climatology indicates that the annual average surface temperature of the world is 14.000°C (14.600°C in the Northern Hemisphere (NH) and 13.400°C for the Southern Hemisphere). The annual cycle of global mean temperatures follows that of the land-dominated NH, with a maximum in July of 15.900°C and a minimum in January of 12.200°C.
|
| [40] |
基于不同方法的中国天山山区降水形态分离研究 [J].https://doi.org/10.7522/j.issn.1000-0240.2017.0027 URL 摘要
基于天山山区1950s-1979年27个气象站点的日平均气温及标注的各类型降水资料,运用频率求交法和概率保证法并结合海拔高程,研究并分析了各站点降水形态转化的临界气温及固液态降水分离的阈值温度空间分布特征及原因,预测了天山山区1980-2014年雪雨比变化.结果表明:天山山区各站点降水形态转化的临界气温及固液态降水分离的阈值温度其空间分布上整体呈现出北坡小于南坡而雪雨比南坡小于北坡的变化规律,且三者均随着海拔高程的增加而增大,两种方法获得的结果基本一致.深入明晰了天山山区降水形态随温度变化特征,为天山山区水文模型中有关参数的选取提供科学的参考.
Separation of precipitation forms based on different methods in Tianshan mountainous area, Northwest China .https://doi.org/10.7522/j.issn.1000-0240.2017.0027 URL 摘要
基于天山山区1950s-1979年27个气象站点的日平均气温及标注的各类型降水资料,运用频率求交法和概率保证法并结合海拔高程,研究并分析了各站点降水形态转化的临界气温及固液态降水分离的阈值温度空间分布特征及原因,预测了天山山区1980-2014年雪雨比变化.结果表明:天山山区各站点降水形态转化的临界气温及固液态降水分离的阈值温度其空间分布上整体呈现出北坡小于南坡而雪雨比南坡小于北坡的变化规律,且三者均随着海拔高程的增加而增大,两种方法获得的结果基本一致.深入明晰了天山山区降水形态随温度变化特征,为天山山区水文模型中有关参数的选取提供科学的参考.
|
| [41] |
Characteristics of the ratios of snow, rain and sleet to precipitation on the Qinghai-Tibet Plateau during 1961-2014 [J].https://doi.org/10.1016/j.quaint.2016.07.030 URL 摘要
Precipitation in different types has great influence not only on water resources and distribution of annual precipitation in cold regions, but also on the thermal regimes of frozen ground. The long-term variations of the ratios of snow, rain and sleet to precipitation were analyzed in this study. The 44 meteorological stations were selected, which are located on the Qinghai-Tibet Plateau (QTP) including permafrost and seasonal frozen ground regions. The results indicate that the monthly snow/precipitation ratio in permafrost regions is far higher than that in seasonal frozen ground regions, but the monthly rain/precipitation ratio in permafrost regions is lower than that in seasonal frozen ground regions, and the monthly variation of sleet/precipitation ratio is indistinctive. The annual ratios of snow and sleet to precipitation show decreasing trends in both regions, and annual rain/precipitation ratio shows an increasing tendency. The dropping magnitude of annual snow/precipitation ratio in seasonal frozen ground regions is larger than that in permafrost regions. The maximum and minimum annual snow/precipitation ratios in both regions occur in winter and summer, respectively, and the second is in spring, instead, the maximum and minimum annual rain/precipitation ratios appear in summer and winter, respectively. The spatial features of the ratios of snow and rain to precipitation are largely opposite, that is, the low snow/precipitation ratio stations are usually associated with the high rain/precipitation ratio, and prominent seasonal diversities of three ratios can be found from their spatial patterns. In addition, the decreasing (increasing) tendency of snow (rain)/precipitation ratio in spring and autumn is more significant than that in winter and summer, and these stations of snow/precipitation ratio with downward trends are mainly located at the edge of the QTP. The ratios of snow and sleet to precipitation will gradually decrease (increase), and the rain/precipitation ratio will increase (decrease) with the air temperature (altitude) rises, respectively, while there are significant seasonal discrepancies. Moreover, the altitude zone showing remarkable variations of the ratios of snow and rain to precipitation ranges from 3000 to 4000 m a.s.l, especially in spring and summer.
|
| [42] |
The dependence of precipitation types on surface elevation and meteorological conditions and its parameterization [J].https://doi.org/10.1016/j.jhydrol.2014.03.038 URL 摘要
Precipitation types (rain, snow, and sleet) have great impacts on the surface runoff and energy balance. However, many weather stations only record precipitation amount without discriminating its type. Based on CMA (China Meteorological Administration) station data over 30years, this study investigates the relationship of precipitation types with surface elevation and meteorological variables. Major findings are (1) wet-bulb temperature is a better indicator than air temperature for discriminating precipitation types; (2) precipitation types are highly dependent on surface elevation, and a higher threshold temperature is needed for differentiating snow and rain over a higher-elevation region; and (3) precipitation types are also dependent on relative humidity, and the probability of sleet event rises greatly with the increase of relative humidity. Based on these findings, a new parameterization scheme is developed to determine the precipitation type, with input of daily mean wet-bulb temperature, relative humidity, and surface elevation. Evaluations for China territory show that the new scheme gives better accuracy than 11 other schemes that are used in hydrological and land surface models.
|

/
| 〈 |
|
〉 |

