张慧 , 靳英华
, 靳英华
Zhang Hui, Jin Yinghua
中图分类号: P49
文献标识码: A
文章编号: 1000-0690(2018)02-0272-12
通讯作者:
收稿日期: 2017-02-10
修回日期: 2017-04-23
网络出版日期: 2018-04-10
版权声明: 2018 《地理科学》编辑部 本文是开放获取期刊文献,在以下情况下可以自由使用:学术研究、学术交流、科研教学等,但不允许用于商业目的.
基金资助:
作者简介:
作者简介:张慧(1988-),女,吉林松原人,博士研究生,主要从事草地生态和农业气象研究。E-mail:zhanghui@iga.ac.cn
展开
摘要
利用1962~2011年中国各植被类型区的452个站点的气温资料,分析了各植被类型区的年平均温度和极端温度随时间的变化趋势。结果表明:① 过去50 a间,中国各植被类型区年平均气温、年平均最高温、年平均最低温都显著升高,并且最低温增温速度快于最高温增温速度,呈温差减小的不对称增温趋势;同时,寒冷地区增温速度高于温暖地区的增温速度,其中寒温带森林的增温幅度超过亚热带森林的2倍。近30 a间,寒温带森林区和温带森林区增温速度减缓,其他各植被类型区增温速度加快,呈现出热带、亚热带地区增温速度高于温带、寒温带地区的空间特点;② 最高温增温速度在变快,最低温增加速度在变慢,多个植被类型区的最高温增温速度高于最低温增温速度,呈现出一种新的不对称增温趋势,即最高温与最低温间的温差在加大;③ 过去50 a和近30 a间,生长季和非生长季的温度变化多样,并分别对年平均温度产生了不同的影响,而生长季和非生长季温度的不同变化分别决定于其最高温和最低温的多样变化。
关键词:
Abstract
The long-term trends of annual mean temperature (Tmean), mean maximum temperature (Tmax) and minimum temperature (Tmin) were analyzed across 453 weather stations from 1962-2011 across 8 vegetation regions according to China vegetation regionalization. During the past 50 years, Tmean, Tmax and Tmin increased significantly in all vegetation regions. In addition, the slope of temperature increase of Tmin was greater than that of Tmax. There was significant difference in slopes between Tmax and Tmin for all vegetation regions except for cold temperate forest, subtropical and tropical forests, showing asymmetric warming in temperature over time, i.e. the difference between Tmax and Tmin was gradually reduced. Over the recent 30 years, Tmean, Tmax and Tmin increased significantly for all vegetation regions except for Tmax in temperate forest and Tmin in temperate cold forest. The rate of temperature increase gradually increased for Tmax, but decreased for Tmin over the recent 30 years. The rate of temperature increase of Tmax tended to be slower than that of Tmin on alpine steppe, cold temperate forest and subtropical forest regions, but faster on the rest of vegetation regions. However, no significant difference was detected for the rate of temperature increase between Tmax and Tmin in any other vegetation regions. The temperature in growing season and non-growing season varied greatly and had different effects on Tmean during the past 50 years and recent 30 years. The changes of temperature in growing season and non-growing season were depended on changes of Tmax and Tmin. For growing season, Tmean, Tmax and Tmin increase significantly during the last 50 years for all vegetation regions except for warm forest region. In addition, the slope of temperature increase for Tmin was greater than that of Tmax, showing asymmetric warming with reduced difference between Tmax and Tmin. There was significant difference in rate of temperature increase between Tmax and Tmin on temperate forest, temperate steppe, temperate desert and warm forest regions, but no difference on alpine steppe, cold forest, subtropical and tropical forest regions. Over the recent 30 years, Tmean, Tmax and Tmin in growing season increased significantly for all vegetation regions. In general, the rate temperature increase accelerated for Tmax but reduced for Tmin. For non-growing season, Tmean, Tmax and Tmin increase greatly during the last 50 years for all vegetation regions, showing an asymmetric warming in temperature with reduced difference between Tmax and Tmin. There was significant difference in slope of temperature increase between Tmax and Tmin for most of vegetation regions except for cold temperate forest, subtropical and tropical forest regions. However, there were not significant differences in the rates of temperature increases for Tmean, Tmax and Tmin on some regions, such as cold temperate forest, temperate forest and temperate steppe region, in non-growing season during over the recent 30 years. For the rest of vegetation regions, Tmean, Tmax and Tmin increased significantly at a faster rate for Tmax and a slower rate for Tmin.
Keywords:
气候直接影响植被,早在20世纪70年代,Walter 等[1]以气候为依据,将陆地生物圈划分成具有不同地带性的生物群落;同时植被是气候的反映者和指示者,植被影响了陆面-大气间水分、能量、动量的交换以及其他各种生物物理和生物化学过程[2,3]。水热组合是决定地带性植被的主导气候要素,而温度作为热量的指示为首要因子。植被与土壤共同构成地表辐射平衡的下垫面,植被通过吸收、截获太阳辐射影响区域地表热量平衡,并影响周围大气温度等气候因子[4,5,6],即使在太阳辐射强度相同的区域内,由于下垫面不同,近地面水热组合状况也不同。
在全球增温的研究中,将不同生物地理群落或植被类型区的温度数据混合进行统计处理,模糊混淆了植被和土壤所构成的下垫面的作用,泛泛分区[7]或机械方格分区[8]或各区合并[9]混合了不同生物地理群落内部温度变化的固有规律及可能的独特过程,妨碍对全球增温空间格局或区域增温变化特点的理解。特别是,泛泛分区的结论或机械方格分区的结论不适合指导在不同生物地理群落开展相应的模拟实验。同时,由于全球增温具有时空尺度性[7],全球增温的普遍结论不能指导在具体生物群落区的模拟试验。标准的做法是,在某一生物群落或植被类型区内进行全球变化及其相关模拟研究时,首先需要检验该生物群落区的历史增温过程及其特点[10],据此开展适合的全球变化及其相关研究。
气候分异显著。为了深入理解中国各植被类型区指示的气候分异区的气温变化,本文按中国植被分区[2]研究各地区的温度变化过程,深入理解中国各植被类型区的增温趋势,揭示中国各植被类型区的增温特点及温度变化的差异。同时,研究中国各植被类型区近30 a(1982~2011年)和过去50 a(1962~2011年)这2个时间尺度的温度变化趋势,为全球变化研究提供基础信息。
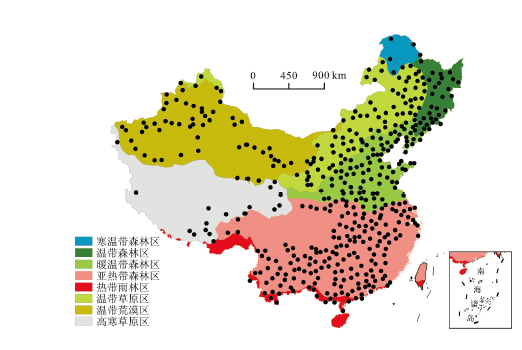
利用中国气象局中国气象科学数据共享服务网(http://cdc.cma.gov.cn/index.jsp)提供的中国地面气候资料月值数据集的月气温数据,根据中国植被分区,选择各植被类型区的中心站点(剔除边缘和过渡区站点),共452个站点(图1)的数据,其中高寒草原区22个站点、寒温带森林区8个站点、温带森林区41个站点、温带草原区70个站点、温带荒漠区56个站点、暖温带森林区86个站点、亚热带森林区147个站点、热带雨林区22个站点。
图1 中国植被类型分区及站点位置示意图
Fig.1 Geographical distribution of vegetation regions and weather stations used in this study
分别统计计算各植被类型区的年平均温度、年平均最高温、年平均最低温随时间的变化趋势(表1)。将各年平均温进行线性回归和Student’s T检验,回归直线的斜率为温度变化速度。上述数据分为1962~2011年和1982~2011年2个时间段。
表1 温度参数表
Table 1 The parameter of temperatures
| 参数 | 意义 |
|---|---|
| n | n=1,2,…,50,n∈N;代表1962~2011年中每一年 |
| i | i=1,2,…365/366,i∈N;代表一年中每日 |
| j | j=1,2,…,8,j∈N;依次代表高寒草原区、寒温带森林区等8个植被类型区 |
| Tmean-nij | 日平均温,每个植被类型区每年每日的平均温度 |
| Tmean-nj | 年平均温,日平均温的年平均值;图表中缩写为Mean |
| Tmax-nij | 日最高温,每个植被类型区每年每日的最高温度 |
| Tmax-nj | 年平均最高温,日最高温的年平均值;图表中缩写为Max |
| Tmin-nij | 日最低温,每个植被类型区每年每日的最低温度 |
| Tmin-nj | 年平均最低温,日最低温的年平均值;图表中缩写为Min |
生长季的温度变化对各生态系统具有重要的影响,为此,我们区分了生长季(5~9月)和非生长季(10~4月)进行讨论。为了便于对照比较,将暖温带森林区、亚热带森林区和热带雨林区也按此月份段进行划分。
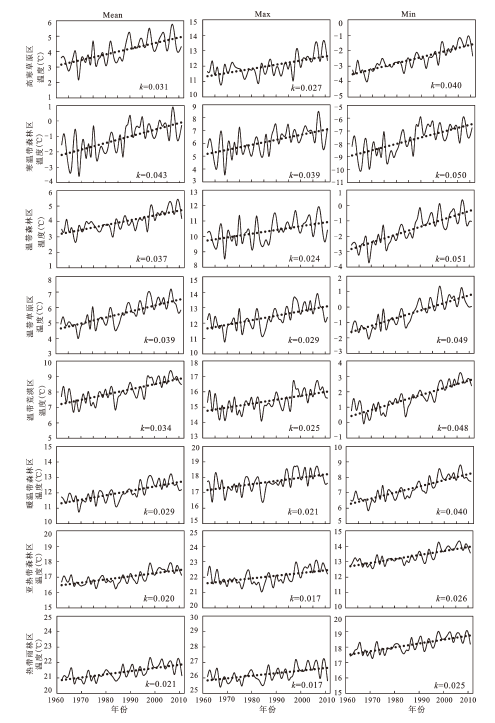
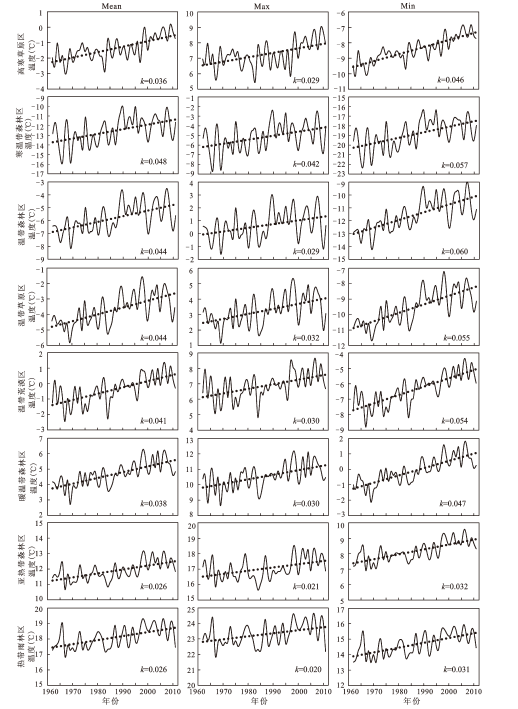
过去50 a间,各植被类型区年平均温、年平均最高温、年平均最低温均极显著升高,并且年平均最低温的升温速度高于年平均最高温的升温速度,二者间的增温速度除寒温带森林区、亚热带森林区和热带雨林区差异不显著外,其它各区差异显著,表现出不对称增温的变化趋势(图2),即最高温与最低温的温差在减小。
图2 各植被类型区年平均温、年平均最高温、年平均最低温的时间序列(1962~2011年)
Fig.2 Time series of daily mean temperature, daily maximum temperature and daily minimum temperature across the vegetation regions during 1962-2011
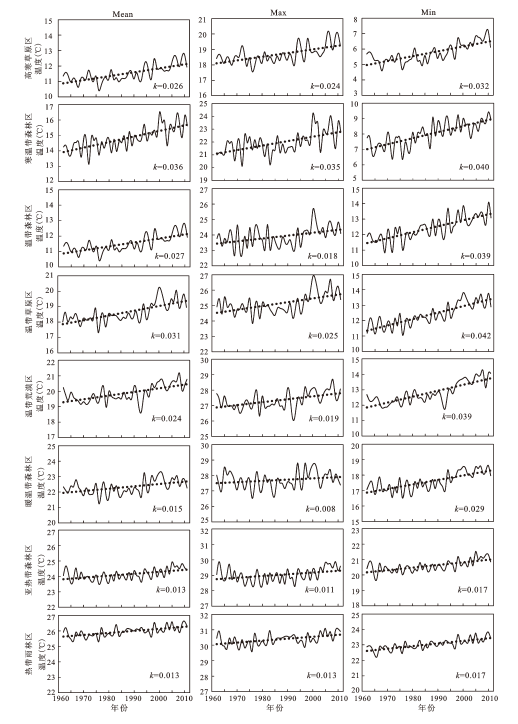
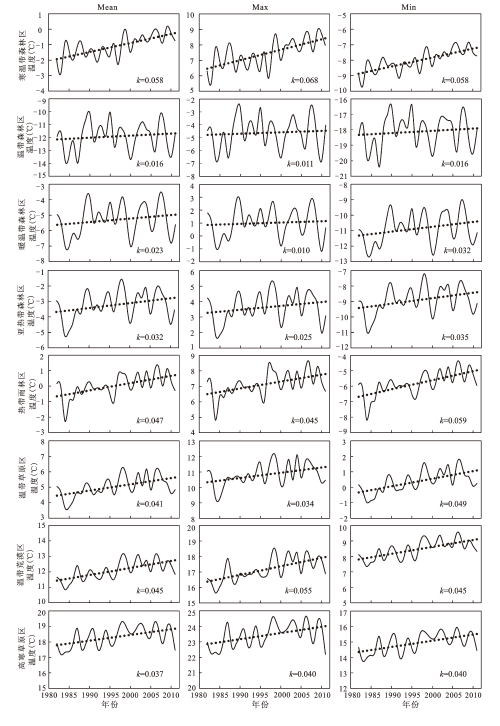
近30 a间,各植被类型区年平均温增温显著,除温带森林区外,其它各植被类型区的年平均最高温增温显著;除寒温带森林外,其它各植被类型区的年平均最低温增温亦极显著。近30 a间,年平均最高温增温速度变快,年平均最低温增温速度变缓慢,高寒草原区和寒温带森林区及亚热带森林区的年平均最高温增温速度快于年平均最低温增温速度,其它植被类型区同样年平均最低温增温速度快于年平均最高温增温速度,但二者的增温差异都不再显著(图3)。
图3 各植被类型区年平均温、年平均最高温、年平均最低温的时间序列(1982~2011年)
Fig.3 Time series of daily mean temperature, daily maximum temperature and daily minimum temperature across the vegetation regions during 1982-2011
过去50 a间,各植被类型区的年平均温增温速度趋势依次为:寒温带森林>温带草原>温带森林>温带荒漠>高寒草原>暖温带森林>热带雨林>亚热带森林,表现为寒冷地区(寒温带森林区,温带草原区,温带森林区,温带荒漠区和高寒草原区)年平均温增温速度快,温暖地区(暖温带森林区,热带雨林区和亚热带森林区)增温速度慢;近30 a间,各植被类型区的年平均温增温速度趋势依次为:高寒草原>温带荒漠>温带草原>亚热带森林>暖温带森林>寒温带森林>温带森林>热带雨林,寒冷地区年平均温增温速度快或温暖地区年平均温增温速度慢的格局被打破,一些温暖地区年平均温增温速度变快,一些寒冷地区的年平均温增温速度变缓慢。
近30 a,寒温带森林区和温带森林区年平均温增温速度变缓慢,其它各植被类型区的年平均温增温速度都高于过去50 a间的年平均温增温速度,即增温速度加快,差异显著或不显著。
过去50 a间,暖温带森林区生长季平均最高温增温不显著,其它各植被类型区生长季平均温、平均最高温、平均最低温都增温显著,并且平均最低温的增温速度快于最高温的增温速度,表现为温差减小的不对称增温(图4)。
图4 各植被类型区生长季平均温、平均最高温、平均最低温的时间序列(1962~2011年)
Fig.4 Time series of daily mean temperature, daily maximum temperature and daily minimum temperature across the vegetation regions in growing season during 1962-2011
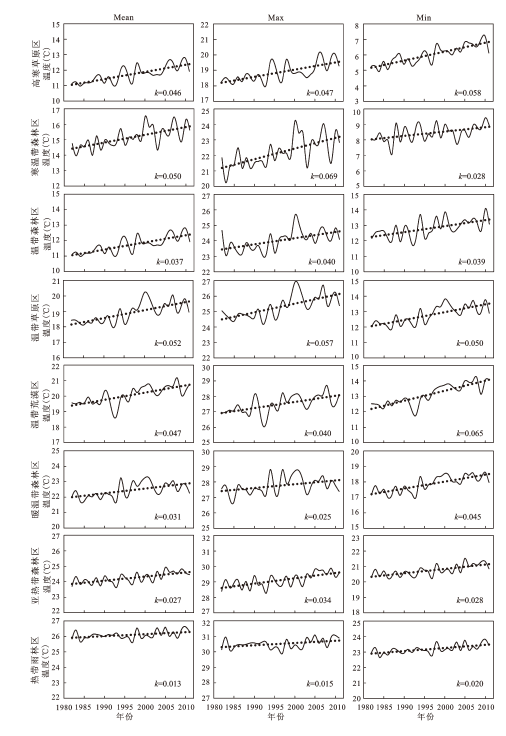
近30 a间,各植被类型区生长季平均温、平均最高温、平均最低温都增温显著;并且,平均最高温的增温速度在变快,平均最低温的增温速度在变缓慢;寒温带森林区、温带森林区、温带草原区、亚热带森林区平均最高温的增温速度大于平均最低温的增温速度,二者的差异显著或不显著;表现为平均最高温与平均最低温间温差加大的不对称增温(图5)。
图5 各植被类型区生长季平均温、平均最高温、平均最低温的时间序列(1982~2011年)
Fig.5 Time series of daily mean temperature, daily maximum temperature and daily minimum temperature across the vegetation regions in growing season during 1982-2011
过去50 a间,各植被类型区生长季平均温的增温速度趋势依次为:寒温带森林>温带草原>温带森林>高寒草原>温带荒漠>暖温带森林>亚热带森林=热带雨林,基本表现为寒冷地区生长季平均温增温速度快,温暖地区生长季平均温增温速度慢;近30 a间,各植被类型区生长季平均温的增温速度趋势依次为:温带草原>寒温带森林>温带荒漠>高寒草原>温带森林>暖温带森林>亚热带森林=热带雨林,总体趋势与过去50 a间的变化相似,但温带草原区的变化特别。
过去50 a间,各植被类型区非生长季平均温、平均最高温、平均最低温都增温显著,平均最低温的增温速度高于平均最高温的增温速度,表现为温差减小的不对称增温。寒温带森林区、亚热带雨林区和热带雨林区平均最高温与平均最低温间的增温速度差异不显著(图6)。
图6 各植被类型区非生长季平均温、平均最高温、平均最低温的时间序列(1962~2011年)
Fig.6 Time series of daily mean temperature, daily maximum temperature and daily minimum temperature across thevegetation regions in non-growing season during 1962-2011
近30 a间,寒温带森林区、温带森林区和温带草原区非生长季平均温、平均最高温、平均最低温增温不显著;其它植被类型区非生长季平均温、平均最高温、平均最低温增温显著,并且最高温的增温速度在变快,最低温的增温速度在变慢。同时,高寒草原区和亚热带森林区非生长季平均最高温增温速度快于平均最低温的增温速度,形成温差加大的不对称增温(图7)。
图7 各植被类型区非生长季平均温、平均最高温、平均最低温的时间序列(1982~2011年)
Fig.7 Time series of daily mean temperature, daily maximum temperature and daily minimum temperature across the 8 vegetation regions in non-growing season during 1982-2011
过去50 a间,各植被类型区非生长季平均温的增温速度趋势依次为:寒温带森林>温带森林=温带草原>温带荒漠>暖温带森林>高寒草原>亚热带森林=热带雨林,基本表现为寒冷地区非生长季年平均温增温速度快,温暖地区非生长季年平均温增温速度慢,但高寒草原区变化特别。
近30 a间,各植被类型区非生长季平均温增温速度趋势依次为:高寒草原>温带荒漠>亚热带森林>暖温带森林>热带雨林>温带草原>温带森林>寒温带森林,表现出温暖地区非生长季平均温增温速度快,寒冷地区非生长季年平均温增温速度慢的趋势。
高寒草原区,近30 a间,由于非生长季平均最高温增温速度2倍于过去50 a间的非生长季平均最高温增温速度(图6,图7),尽管生长季平均最高温增温速度不高于生长季平均最低温增温速度,但年平均最高温增温速度还是高于年平均最低温增温速度。
寒温带森林区,近30 a间,年平均温增温速度减慢,但增温显著,非生长季平均温增温不显著是导致全年增温变缓慢的原因;由于近30 a生长季平均最高温增温速度近于过去50 a生长季平均最高温增温速度的2倍(图4,图5),且生长季和非生长季平均最低温增温速度大幅减缓,导致年平均最高温增温速度快于年平均最低温增温速度,并且年平均最低温增温不显著。
温带森林区,近30 a间,生长季平均最高温的增温速度是过去50 a间生长季平均最高温增温速度的2倍多,导致生长季平均温的增温速度快于过去50 a间的生长季平均温的增温速度。
温带草原区,近30 a间,年平均温增温速度等于过去50 a间的年平均温增温速度,增温显著;但生长季平均温的增温速度高于过去50 a间生长季平均温的增温速度,非生长季平均温的增温速度低于过去50 a非生长季平均温的增温速度,二者抵消致使其相等。
温带荒漠区,近30 a间,年平均温增温速度变快,生长季和非生长季平均温增温速度相等,并都高于过去50 a的相应变化。
暖温带森林区,近30 a间,年平均温的增温速度变快,源于生长季平均温的增温速度是过去50 a间生长季平均温增温速度的2倍(图4,图5),而非生长季平均温的增温速度略高于过去50 a间非生长季平均温的增温速度;生长季和非生长季及全年的平均最高温和平均最低温的增温速度都快于过去50 a的相应增温速度。
亚热带森林区,近30 a间,年平均温的增温速度变快,生长季平均温的增温速度为过去50 a间生长季平均温增温速度的2倍(图4,图5),非生长季平均温也极显著大幅度增温。同时,生长季平均最高温增温速度为过去50 a间生长季平均最高温增温速度的3倍多,因此,引起年平均最高温增温速度高于过去50 a间年平均温最高温增温速度的2倍多(图2,图3)。
热带雨林区,近30 a间,年平均温增温速度变快,非生长季平均温的增温速度高于过去50 a间非生长季平均温的增温速度。非生长季平均温的增温速度高于生长季平均温的增温速度,并都分别高于过去50 a间的相应增温速度。
1) 过去50 a间,中国各植被类型区的年均温、年均最高温、年均最低温增温显著,并且年平均最低温的增温速度大于年均最高温的增温速度,呈温差减小的不对称增温。一些温暖地区的年平均温增温速度快于寒冷地区的年平均温增温速度,打破了温暖区增温速度大于寒冷区增温速度的空间分布特征。近30 a,大部分植被类型区的年平均温增温速度都高于过去50 a间的年平均温增温速度,即增温速度加快。且呈现年平均最高温与年平均最低温间的温差加大的不对称增温。
2) 各植被类型区气温变化特征有较大差异,气温不对称增加对各植被区的影响也不同,热带雨林区和亚热带森林区,气温增加相对较慢。温带森林区,过去50 a间平均最低温的增速显著大于平均最高温的增速,昼夜温差显著减小,长此以往会导致植被群落发生改变。对于高寒草原区和温带荒漠区,近30 a间的气温增速均显著大于过去50 a,按照现有的增温趋势,未来青藏高原的冻土层可能会上移,巧夺天工的“天路”将面临危险。
在全球增温的研究中,通常按照经纬度栅格分区、行政区划分区、地形地势分区等方法分析大尺度数据的空间分布特征[7,8,9],未考虑到不同生物地理群落或植被类型区的温度差异,本文按中国植被分区[2]研究各地区的温度变化过程,得出各植被类型均呈现不对称增温特征,与Karl,Easterling等人报道的全球气温不对称增加相一致[12,13]。Liu等人报道了中国DTR变化,昼夜温差不断减小[14];Shen等人按照地理分区研究了中国DTR变化的2个阶段,其总体趋势均与本文得出结果大体一致[15]。然而本文按照植被类型分区,着重强调了植被和土壤所构成的下垫面的作用,揭示各植被类型区温度变化的差异。同时,本文根据植被生长需求将各植被类型区生长季和非生长季的气温变化分别讨论,为自然植被的管理和利用(如草地放牧)以及农业生产提供理论依据。
全球增温的影响因素有很多,如辐射强迫、温室气体、气溶胶等[7,15];温差减小的不对称增温影响因素包括云量变增多、降水增多、植被盖度减少等[12,13,15~19]。各植被类型区由于下垫面不同,可能对增温产生的影响还不清楚。同时,土地利用影响气候变化[20],但中国各植被类型区由于开垦、采伐、放牧引起的土地利用导致的植被变化及其对气候变化的影响还有待评估。特别是近30 a,最高温增温速度普遍加快,最低温增温速度减缓,甚至最高温的增温速度快于最低温的增温速度,这其中的原因和机理尚待深入研究。
The authors have declared that no competing interests exist.
| [1] |
Vegetation of the earth and ecological system of the Geo-biosphere [M]. |
| [2] |
中国气候-植被关系初探 [J].
气候—植被分类必须强调气候因子的综合影响及其指标的区域性。一般的气候观测缺乏在生物学上具有重要与综合的作用或代表性,而区域潜在蒸散包括从所有表面的蒸发与植物蒸腾,并涉及到决定植被分布的两大要素:温度和降水。因此,区域潜在蒸散具有作为植被—气候相关分析与分类的综合气候指标的功能。本文首次根据区域潜在蒸散对气候—植被关系的热量与水分指标进行了初步探讨,提出了进行气候—植被关系的热量指标(TI)和区域湿润指标(RMI),并据此对中国气候—植被关系进行了初步的定量研究。该研究对于了解气候—植被之间的相互关系,正确地评估和预测全球变化对人类及生物所赖以生存的生态环境的影响具有重要的理论和现实意义。
Study on Chinese climate-vegetation relationship .
气候—植被分类必须强调气候因子的综合影响及其指标的区域性。一般的气候观测缺乏在生物学上具有重要与综合的作用或代表性,而区域潜在蒸散包括从所有表面的蒸发与植物蒸腾,并涉及到决定植被分布的两大要素:温度和降水。因此,区域潜在蒸散具有作为植被—气候相关分析与分类的综合气候指标的功能。本文首次根据区域潜在蒸散对气候—植被关系的热量与水分指标进行了初步探讨,提出了进行气候—植被关系的热量指标(TI)和区域湿润指标(RMI),并据此对中国气候—植被关系进行了初步的定量研究。该研究对于了解气候—植被之间的相互关系,正确地评估和预测全球变化对人类及生物所赖以生存的生态环境的影响具有重要的理论和现实意义。
|
| [3] |
|
| [4] |
Betts,Offset of the potential carbon sink from boreal forestation by decreases in surface albedo [J].https://doi.org/10.1038/35041545 URL PMID: 11089969 [本文引用: 1] 摘要
Carbon uptake by forestation is one method proposed to reduce net carbon dioxide emissions to the atmosphere and so limit the radiative forcing of climate change. But the overall impact of forestation on climate will also depend on other effects associated with the creation of new forests. In particular, the albedo of a forested landscape is generally lower than that of cultivated land, especially when snow is lying, and decreasing albedo exerts a positive radiative forcing on climate. Here I simulate the radiative forcings associated with changes in surface albedo as a result of forestation in temperate and boreal forest areas, and translate these forcings into equivalent changes in local carbon stock for comparison with estimated carbon sequestration potentials. I suggest that in many boreal forest areas, the positive forcing induced by decreases in albedo can offset the negative forcing that is expected from carbon sequestration. Some high-latitude forestation activities may therefore increase climate change, rather than mitigating it as intended.
|
| [5] |
Betts G et al. The influence of land-use change and landscape dynamics on the climate system-relevance to climate change policy beyond the radiative effect of greenhouse gases. Phil. Trans [J]. |
| [6] |
全球变化下地表反照率研究进展 [J].https://doi.org/10.11867/j.issn.1001-8166.2011.11.1217 URL Magsci [本文引用: 1] 摘要
<p>地表反照率表征地球表面对太阳辐射的反射能力,决定着地表与大气之间辐射能量的分配过程,是影响地球气候系统的关键变量。在全球变化日益突出的今天,地表反照率与全球变化的相互影响机制已经成为地球科学研究领域的热点问题之一。地表反照率的细微变化,会影响到地气系统的能量收支平衡,进而引起区域以至全球气候变化。详细介绍地表反照率影响因素、研究方法等方面的最新研究进展,并从全球变化的角度阐述地表反照率的研究动态及其研究方向。</p>
Research progress on surface albedo under global change .https://doi.org/10.11867/j.issn.1001-8166.2011.11.1217 URL Magsci [本文引用: 1] 摘要
<p>地表反照率表征地球表面对太阳辐射的反射能力,决定着地表与大气之间辐射能量的分配过程,是影响地球气候系统的关键变量。在全球变化日益突出的今天,地表反照率与全球变化的相互影响机制已经成为地球科学研究领域的热点问题之一。地表反照率的细微变化,会影响到地气系统的能量收支平衡,进而引起区域以至全球气候变化。详细介绍地表反照率影响因素、研究方法等方面的最新研究进展,并从全球变化的角度阐述地表反照率的研究动态及其研究方向。</p>
|
| [7] |
|
| [8] |
Climate Change in China [J].https://doi.org/10.1579/0044-7447-30.6.381 URL [本文引用: 2] |
| [9] |
气候变化国家评估报告( I ):中国气候变化的历史和未来趋势 [J].https://doi.org/10.3969/j.issn.1673-1719.2007.z1.001 URL [本文引用: 2] 摘要
The climate change in China shows a considerable similarity to the global change, though there still exist some significant differences between them. In the context of the global warming, the annual mean surface air temperature in the country as a whole has significantly increased for the past 50 years and 100 years, with the range of temperature increase slightly greater than that in the globe. The change in precipitation trends for the last 50 and 100 years was not significant, but since 1956 it has assumed a weak increasing trend. The frequency and intensity of main extreme weather and climate events have also undergone a significant change. The researches show that the atmospheric CO2 concentration in China has continuously increased and the sum of positive radiative forcings produced by greenhouse gases is probably responsible for the country-wide climate warming for the past 100 years, especially for the past 50 years. The projections of climate change for the 21st century using global and regional climate models indicate that, in the future 20-100 years, the surface air temperature will continue to increase and the annual precipitation also has an increasing trend for most parts of the country.
Shi Guangyu et al. National assessment report of climate change (I): Climate change in China and its future trend .https://doi.org/10.3969/j.issn.1673-1719.2007.z1.001 URL [本文引用: 2] 摘要
The climate change in China shows a considerable similarity to the global change, though there still exist some significant differences between them. In the context of the global warming, the annual mean surface air temperature in the country as a whole has significantly increased for the past 50 years and 100 years, with the range of temperature increase slightly greater than that in the globe. The change in precipitation trends for the last 50 and 100 years was not significant, but since 1956 it has assumed a weak increasing trend. The frequency and intensity of main extreme weather and climate events have also undergone a significant change. The researches show that the atmospheric CO2 concentration in China has continuously increased and the sum of positive radiative forcings produced by greenhouse gases is probably responsible for the country-wide climate warming for the past 100 years, especially for the past 50 years. The projections of climate change for the 21st century using global and regional climate models indicate that, in the future 20-100 years, the surface air temperature will continue to increase and the annual precipitation also has an increasing trend for most parts of the country.
|
| [10] |
Milchunas.Grassland vegetation changes and nocturnal global warming [J].https://doi.org/10.1126/science.283.5399.229 URL PMID: 9880257 [本文引用: 1] 摘要
Global minimum temperatures (T$_{MIN}$) are increasing faster than maximum temperatures, but the ecological consequences of this are largely unexplored. Long-term data sets from the shortgrass steppe were used to identify correlations between T$_{MIN}$ and several vegetation variables. This ecosystem is potentially sensitive to increases in T$_{MIN}$. Most notably, increased spring T$_{MIN}$ was correlated with decreased net primary production by the dominant C$_4$ grass (Bouteloua gracilis) and with increased abundance and production by exotic and native C$_3$ forbs. Reductions in B. gracilis may make this system more vulnerable to invasion by exotic species and less tolerant of drought and grazing.
|
| [11] |
Falster and Mark Westoby. Bivariate line-fitting methods for allometry [J].
|
| [12] |
Global warming: evidence for asymmetric diurnal temperature change [J].https://doi.org/10.1029/91GL02900 URL [本文引用: 2] 摘要
Analyses of the year-month mean maximum and minimum surface thermometric record have now been updated and expanded to cover three large countries in the Northern Hemisphere (the contiguous United States, the Soviet Union, and the People's Republic of China). They indicate that most of the warming which has occurred in these regions over the past four decades can be attributed to an increase of mean minimum (mostly nighttime) temperatures. Mean maximum (mostly daytime) temperatures display little or no warming. In the USA and the USSR (no access to data in China) similar characteristics are also reflected in the changes of extreme seasonal temperatures, e.g., increase of extreme minimum temperatures and little or no change in extreme maximum temperatures. The continuation of increasing minimum temperatures and little overall change of the maximum leads to a decrease of the mean (and extreme) temperature range, an important measure of climate variability.The cause(s) of the asymmetric diurnal changes are uncertain, but there is some evidence to suggest that changes in cloud cover plays a direct role (where increases in cloudiness result in reduced maximum and higher minimum temperatures). Regardless of the exact cause(s), these results imply that either: (1) climate model projections considering the expected change in the diurnal temperature range with increased levels of the greenhouse gases are underestimating (overestimating) the rise of the daily minimum (maximum) relative to the maximum (minimum), or (2) the observed warming in a considerable portion of the Northern Hemisphere landmass is significantly affected by factors unrelated to an enhanced anthropogenically-induced greenhouse effect.
|
| [13] |
Jones, P D et al. Maximum and minimum temperature trends for the globe [J].https://doi.org/10.1126/science.277.5324.364 URL [本文引用: 2] |
| [14] |
Mark Henderson et al. Taking China’s temperature: daily range, warming trends, and regional variations [J], |
| [15] |
近期气候变化研究的一些最新进展 [J].https://doi.org/10.1360/972011-913 URL [本文引用: 3] 摘要
气候变化是当前国际上的热点问题之一,尤其是IPCC-AR4以来的全球气候及其影响如何变化更为引人瞩目.本文综述了近年在Science和Nature等国际杂志上刊登的涉及全球气候变化研究如辐射强迫、温室气体、气溶胶、海水和海平面、温度和降水、南北极地区等的最新研究成果和研究动态,对全球变化及其相关学科的研究以及即将发布的IPCC第五次评估报告具有重要的参考价值.
Xiao Cunde et al. Progress regarding climate change during recent years .https://doi.org/10.1360/972011-913 URL [本文引用: 3] 摘要
气候变化是当前国际上的热点问题之一,尤其是IPCC-AR4以来的全球气候及其影响如何变化更为引人瞩目.本文综述了近年在Science和Nature等国际杂志上刊登的涉及全球气候变化研究如辐射强迫、温室气体、气溶胶、海水和海平面、温度和降水、南北极地区等的最新研究成果和研究动态,对全球变化及其相关学科的研究以及即将发布的IPCC第五次评估报告具有重要的参考价值.
|
| [16] |
Li Guangdi et al. Spatio-temporal change of diurnal temperature range and its relationship with sunshine duration and precipitation in China [J].https://doi.org/10.1002/2014JD022326 URL 摘要
Abstract We examined the spatiotemporal variation in diurnal temperature range (DTR) and discussed the reasons for the changes of DTR in China based on data from 479 weather stations from 1962 to 2011. Results showed that DTR decreased rapidly (0.291°C/decade) from 1962 to 1989 due to slightly decreased T max and significantly increased T min, but the decrease in DTR has stopped since 1990 as T max and T min kept pace with each other. During 1990–2011, DTR remained trendless, with slight increase in the 1990s and slight decrease after 2000. During the whole study period from 1962 to 2011, DTR decreased at a rate of 0.157°C/decade nationally. Spatially, decreases in DTR were greatest in Northeast China and lowest in Southwest China with a transect running from northeast to southwest showing the decreasing trends change from high to low. Seasonally, DTR decreases were greatest in winter and lowest in summer, and the magnitudes of decrease reduced from the north to south of China. The changes in DTR were closely correlated with changes in sunshine duration (SD) in China except the Tibetan Plateau, suggesting that SD decrease is an important contributor to the decrease of DTR through its influence on T max. In addition to the contribution of SD decrease, the increasing of precipitation played an important role in DTR decrease in Northwest China, the most arid region of China. It appeared that changes of cloud cover (CC) were not the reasons for DTR changes in the past 5065years as CC has decreased during the study period.
|
| [17] |
Zhou Daowei et al. Rising soil temperature in China and its potential ecological impact [J].
|
| [18] |
Tian Yuhong et al. Impact of vegetation removal and soil aridation on diurnal temperature range in a semiarid region: application to the Sahel [J].https://doi.org/10.1073/pnas.0700290104 URL PMID: 17986620 摘要
Increased clouds and precipitation normally decrease the diurnal temperature range (DTR) and thus have commonly been offered as explanation for the trend of reduced DTR observed for many land areas over the last several decades. Observations show, however, that the DTR was reduced most in dry regions and especially in the West African Sahel during a period of unprecedented drought. Furthermore, the negative trend of DTR in the Sahel appears to have stopped and may have reversed after the rainfall began to recover. This study develops a hypothesis with climate model sensitivity studies showing that either a reduction in vegetation cover or a reduction in soil emissivity would reduce the DTR by increasing nighttime temperature through increased soil heating and reduced outgoing longwave radiation. Consistent with empirical analyses of observational data, our results suggest that vegetation removal and soil aridation would act to reduce the DTR during periods of drought and human mismanagement over semiarid regions such as the Sahel and to increase the DTR with more rainfall and better human management. Other mechanisms with similar effects on surface energy balance, such as increased nighttime downward longwave radiation due to increased greenhouse gases, aerosols, and clouds, would also be expected to have a larger impact on DTR over drier regions.
|
| [19] |
中国气温变化研究最新进展 [J].https://doi.org/10.3969/j.issn.1006-9585.2005.04.001 URL [本文引用: 1] 摘要
总结了“十五”攻关课题有关中国温度变化研究的若干进展。在资料质量控制和序列非均一性检验及订正的基础上,更新了中国地面近50年、100年和1000年气温序列。研究表明,不论是近54年还是近100年全国年平均地面气温升高趋势一般比原来分析结果表明的要强,分别达到0·25℃/10a和0·08℃/10a。中国现代增暖最明显的地区包括东北、华北、西北和青藏高原北部,最显著的季节在冬季和春季。近50多年中国近地面气候变暖主要是平均最低气温明显上升的结果,全国范围内极端最低气温也显著升高,而极端最高气温升高不多。中国与温度相关的极端气候事件强度和频率一般呈降低趋势或稳定态势。研究发现,城市化因素对中国地面平均气温记录具有显著影响,但在现有的全国和区域平均温度变化分析中一般没有考虑,因此需要在将来的研究中给予密切关注。在增温明显的华北地区,1961~2000年间城市化引起的年平均气温增加值达到0·44℃,占全部增温的38%,城市化引起的增温速率为0·11℃/10a。中国其他地区的增温趋势中也或多或少反映出增强的城市热岛效应影响。20世纪60年代初以来中国对流层中下层温度变化趋势不明显,仅为0·05℃/10a,比地面气温变化小一个量级;对流层上层和平流层底层年平均温度呈明显下降趋势,变化速率分别为-0·17℃/10a和-0·22℃/10a;整个对流层平均温度呈微弱下降趋势。中国对流层温度与地面气温变化趋势存在明显的差异,但这种差异在20世纪80年代初以后趋于减小。近千年来中国地面气温变化史上可能确存在“中世纪温暖期”和“小冰期”等特征性气候阶段,但“中世纪温暖期”的温暖程度似乎没有过去认为的那样明显。从全国范围看,11世纪末和13世纪中的温暖程度可能均超过了20世纪30~40年代暖期,表明20世纪的增暖可能并非史无前例。中国20世纪气候增暖的原因目前还不能给出明确回答。一些迹象表明,人类活动可能已经对中国的地面气温变化产生了影响,但太阳活动及气候系统内部的低频振动对现代气候变暖可能也具有重要影响。
Zhou Yaqing et al. Recent progresses in studies of regional temperature changes in China .https://doi.org/10.3969/j.issn.1006-9585.2005.04.001 URL [本文引用: 1] 摘要
总结了“十五”攻关课题有关中国温度变化研究的若干进展。在资料质量控制和序列非均一性检验及订正的基础上,更新了中国地面近50年、100年和1000年气温序列。研究表明,不论是近54年还是近100年全国年平均地面气温升高趋势一般比原来分析结果表明的要强,分别达到0·25℃/10a和0·08℃/10a。中国现代增暖最明显的地区包括东北、华北、西北和青藏高原北部,最显著的季节在冬季和春季。近50多年中国近地面气候变暖主要是平均最低气温明显上升的结果,全国范围内极端最低气温也显著升高,而极端最高气温升高不多。中国与温度相关的极端气候事件强度和频率一般呈降低趋势或稳定态势。研究发现,城市化因素对中国地面平均气温记录具有显著影响,但在现有的全国和区域平均温度变化分析中一般没有考虑,因此需要在将来的研究中给予密切关注。在增温明显的华北地区,1961~2000年间城市化引起的年平均气温增加值达到0·44℃,占全部增温的38%,城市化引起的增温速率为0·11℃/10a。中国其他地区的增温趋势中也或多或少反映出增强的城市热岛效应影响。20世纪60年代初以来中国对流层中下层温度变化趋势不明显,仅为0·05℃/10a,比地面气温变化小一个量级;对流层上层和平流层底层年平均温度呈明显下降趋势,变化速率分别为-0·17℃/10a和-0·22℃/10a;整个对流层平均温度呈微弱下降趋势。中国对流层温度与地面气温变化趋势存在明显的差异,但这种差异在20世纪80年代初以后趋于减小。近千年来中国地面气温变化史上可能确存在“中世纪温暖期”和“小冰期”等特征性气候阶段,但“中世纪温暖期”的温暖程度似乎没有过去认为的那样明显。从全国范围看,11世纪末和13世纪中的温暖程度可能均超过了20世纪30~40年代暖期,表明20世纪的增暖可能并非史无前例。中国20世纪气候增暖的原因目前还不能给出明确回答。一些迹象表明,人类活动可能已经对中国的地面气温变化产生了影响,但太阳活动及气候系统内部的低频振动对现代气候变暖可能也具有重要影响。
|
| [20] |
土地利用变化对全球气候影响的研究进展与方法初探 [J].https://doi.org/10.11867/j.issn.1001-8166.2011.10.1015 URL Magsci [本文引用: 1] 摘要
<p>综合分析了土地利用与土地覆盖变化(LUCC)对全球气候影响研究的重要科学问题和国内外研究现状,在此基础上,考虑各学科的相互交叉、渗透和耦合等特点,提出并初步设计了土地利用变化对全球气候影响研究的星地一体化LUCC—气候—生态系统耦合研究技术方法体系,并就土地利用变化对全球气候影响的LUCC演变规律及动力学机制、LUCC影响生态系统与气候的机理与效应等重大科学问题的研究途径,以及星地一体化耦合研究技术体系在土地利用变化对全球气候影响研究中的应用技术路线进行了探讨。该研究途径的探讨与技术路线的设计,将有力支持下述科学目标的实现:①深入研究典型区、重要国家和全球3个尺度上的LUCC时空过程基本规律、驱动机制与区域差异及其气候/生态效应;②阐明人类活动和气候变化对LUCC过程的互馈机理,揭示大尺度LUCC过程对气候与陆地生态系统的作用机理;③构建多尺度LUCC及其气候/生态效应综合模拟平台,定量模拟未来不同情景下不同时空尺度LUCC变化趋势及其对气候与生态系统的影响,进而厘定大尺度LUCC通过引发温室气体收支变化与改变地表陆—气界面过程2个方面影响气候变化的贡献率;④提出未来应对LUCC对气候与生态系统影响的策略,为我国应对全球变化、实现可持续发展提供科学依据。</p>
Yan Xiaodong et al. An overview of the progress and research framework on the effects of land use change upon global climate .https://doi.org/10.11867/j.issn.1001-8166.2011.10.1015 URL Magsci [本文引用: 1] 摘要
<p>综合分析了土地利用与土地覆盖变化(LUCC)对全球气候影响研究的重要科学问题和国内外研究现状,在此基础上,考虑各学科的相互交叉、渗透和耦合等特点,提出并初步设计了土地利用变化对全球气候影响研究的星地一体化LUCC—气候—生态系统耦合研究技术方法体系,并就土地利用变化对全球气候影响的LUCC演变规律及动力学机制、LUCC影响生态系统与气候的机理与效应等重大科学问题的研究途径,以及星地一体化耦合研究技术体系在土地利用变化对全球气候影响研究中的应用技术路线进行了探讨。该研究途径的探讨与技术路线的设计,将有力支持下述科学目标的实现:①深入研究典型区、重要国家和全球3个尺度上的LUCC时空过程基本规律、驱动机制与区域差异及其气候/生态效应;②阐明人类活动和气候变化对LUCC过程的互馈机理,揭示大尺度LUCC过程对气候与陆地生态系统的作用机理;③构建多尺度LUCC及其气候/生态效应综合模拟平台,定量模拟未来不同情景下不同时空尺度LUCC变化趋势及其对气候与生态系统的影响,进而厘定大尺度LUCC通过引发温室气体收支变化与改变地表陆—气界面过程2个方面影响气候变化的贡献率;④提出未来应对LUCC对气候与生态系统影响的策略,为我国应对全球变化、实现可持续发展提供科学依据。</p>
|

/
| 〈 |
|
〉 |
