黄亚楠 , 潘少明
, 潘少明
Huang Yanan, Pan Shaoming
中图分类号: P597.+1
文献标识码: A
文章编号: 1000-0690(2018)03-0437-11
收稿日期: 2017-07-9
修回日期: 2017-10-8
网络出版日期: 2018-03-21
版权声明: 2018 《地理科学》编辑部 本文是开放获取期刊文献,在以下情况下可以自由使用:学术研究、学术交流、科研教学等,但不允许用于商业目的.
基金资助:
作者简介:
作者简介:黄亚楠(1986-),男,河南正阳人,博士研究生,主要研究方向为同位素地球化学与年代学。E-mail:highttee@163.com
展开
摘要
针对当前中国湖泊柱样沉积物中239+240Pu的研究现状,对中国湖泊239+240Pu的来源、239+240Pu最大蓄积峰的年代以及239+240Pu在湖泊沉积物中的迁移行为进行了研究总结。结果表明:中国湖泊239+240Pu的主要来源于全球大气核试验沉降,湖泊沉积柱样中表层沉积物240Pu/239Pu均值为0.177±0.019;柱样240Pu/239Pu均值为0.177±0.008;柱样239+240Pu的沉积通量范围在7.45~240.6 MBq/km2之间,因湖泊所处沉积环境及纬度的差异而变化。湖泊柱样剖面中的239+240Pu的分布多呈单峰分布,湖泊沉积物中239+240Pu的最大蓄积峰位置改变可以忽略不计,239+240Pu最大蓄积峰具有时标价值。
关键词:
Abstract
China is a nation with numerous lakes; tracer studies of 239+240Pu have been carried out in 14 lakes. According to the research status of 239+240Pu in Chinese lakes, this article summarizes the source, the migration behavior of 239+240Pu and the age of the maximum accumulation peaks of 239+240Pu. The results show that 239+240Pu in lacustrine sediment cores of Chinese lakes are mainly derived from the global atmospheric nuclear tests, the mean value of 240Pu/239Pu was 0.177±0.019 in the surface sediments, the mean value 240Pu/239Pu was 0.177±0.008 in the all sediment cores. Because of the difference of lake sedimentary environment and latitude changes, the range of the 239+240Pu inventories of was 7.45-240.6 MBq/km2. The distribution characteristic of 239+240Pu in lacustrine sediment cores of Chinese lakes are mostly unimodal, and the migration of 239+240Pu in sediment cores can be neglected and the maximum accumulation peak of 239+240Pu has time scale value.
Keywords:
湖泊是地表物质运移的主要宿体,湖泊沉积物中赋存着流域环境变化、湖泊水体环境以及人类活动的信息。放射性核素示踪(137Cs和239+240Pu等)是提取沉积环境变化信息的一种有效手段。利用同位素示踪能够有效的识别物源,确定沉积物的沉积年代,计算不同沉积环境的沉积速率等。由于137Cs样品制备简单且易于测量,137Cs被广泛应用在湖泊沉积过程及定年的研究中[1,2]。然而,137Cs的半衰期只有30.2 a,目前源于全球大气核试验的137Cs已经衰减掉全球释放总量的70%左右,随着时间的推移,沉积物中的137Cs活度越来越难被检测到[3,4]。239+240Pu与137Cs具有相同来源,都是全球大气核试验的产物。据统计全球大气核试验释放出239+240Pu总量约是137Cs的6倍[5],239Pu和240Pu的半衰期比137Cs更长,分别为24 110 a和6 561 a。随着分析设备性能和技术的提高,通过热电离质谱(TIMS)、共振电离质谱(RIMS)、电感耦合等离子质谱(ICP-MS)和加速器质谱(AMS)等[6,7]质谱技术能够精确分析出环境样品中239+240Pu活度和240Pu/239Pu比值,这为239+240Pu同位素的示踪提供了有利的条件,并得到了广泛的关注和应用。虽然已有学者对于中国一些湖泊钚同位素的示踪进行了研究,但是目前仍然缺乏较系统的全面的认识。针对当前中国湖泊柱样沉积物中239+240Pu的研究现状,本文对中国湖泊239+240Pu的来源、239+240Pu最大蓄积峰的年代以及239+240Pu在湖泊沉积物中的迁移行为进行归纳总结,以期为中国湖泊沉积物钚同位素的示踪应用研究提供一些科学的参考。
环境中239Pu和240Pu主要有4个来源,除了大气核试验大量释放外,还有核反应堆、核事故以及核燃料后处理厂等[8,9,10],不同来源的240Pu/239Pu比值有差异(表1),因此利用240Pu/239Pu比值特征可以示踪物质的来源。例如武器级240Pu/239Pu 比值较低在0.01~0.07之间,而反应堆的比值较高在0.24~0.80之间,这是因为240Pu/239Pu比值的高低取决于239Pu转化成240Pu的比例,在核反应堆密闭的环境中核反应材料的辐照时间或者停留时间越长,239Pu捕获中子转化为240Pu的比例也就越大,测出的240Pu/239Pu比值就高,例如前苏联切尔诺贝利核事故(1986年)240Pu/239Pu 比值为0.31~0.40[11],而大气核试验中核武器在开放的环境中瞬间爆炸,核爆中239Pu捕获中子时间较短,产生240Pu的比例较低,240Pu/239Pu的比值也低。由于世界各国核武器发展水平以及技术参数的差异,核武器试验所产生的240Pu/239Pu比值也在较大的范围(0.10~0.36)波动,例如美国马绍尔群岛核试验(1946~1958年)240Pu/239Pu的比值在0.306~0.360之间。大气核试验释放到平流层的钚同位素经过几十年的混合,而后沉降到不同纬度带的240Pu/239Pu比值虽然略有差异。但比值集中在0.18左右(0.18±0.014)[12]。因此,沉积物中240Pu/239Pu比值在0.18左右,可以成为239+240Pu直接来源于全球大气核试验的判据。另外,中国罗布泊核试验(1964~1980年)对下风向区域的湖泊也可能产生影响,但240Pu/239Pu比值特征目前仍不清楚[13, 14]。
表1 240Pu/239Pu比值特征
Table 1 The characteristic of 240Pu/239Pu
| 主要来源 | 240Pu/239Pu原子比 | 参考文献 |
|---|---|---|
| 武器级 | 0.01~0.35 | [8] |
| 反应堆 | 0.24~0.80 | [8] |
| 全球大气核试验沉降 | 0.18±0.014 | [12] |
| 马绍尔群岛核试验场(美国,1946~1958) | 0.306~0.360 | [9] |
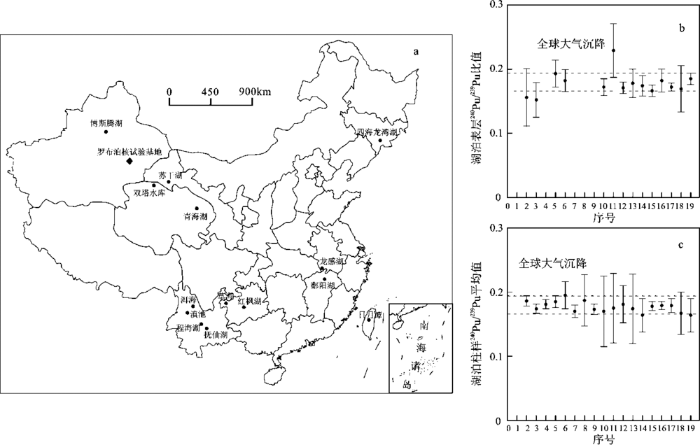
中国是一个湖泊众多的国家,根据湖泊所处区域位置的差异,可以将中国分为东部平原湖区、青藏高原湖区、云贵高原湖区、蒙新高原湖区以及东北平原与山地等五大湖区[15]。湖泊沉积物柱样中239+240Pu的研究可以示踪放射性核素不同的来源;在陆地土壤层环境中,受到水土流失、风沙侵蚀或者人为耕种等环境条件的影响,390+240Pu来源受到干扰,239+240Pu来源的时间信息难以判断[13,14]。根据已有的研究,中国已对14个湖泊[4,13,16~23]开展了钚同位素的研究,从低纬度到高纬度汇总了这14个湖泊(图1a,表2)19根柱样的239+240Pu沉积通量、240Pu/239Pu比值范围以及240Pu/239Pu均值、仪器、测试方法和测试单位等信息。测试仪器主要为德国生产的Element 2(Finngan),测试方法为扇形磁场电感耦合等离子体质谱法(SF-ICP-MS)。测试样品239+240Pu活度和240Pu/239Pu比值,利用IAEA-368 (海洋沉积物标准,IAEA)、SRM-4354(淡水湖泊沉积物标准,ANSIT)[19,20]和NBS-974[16]等标准物质进行质量控制。从图1b可知9个湖泊14个表层样品中240Pu/239Pu比值在0.152~0.229之间,均值为0.177±0.019;13个湖泊15根柱样样品(图1c)240Pu/239Pu的平均值为0.177±0.008,这与全球大气沉降的240Pu/239Pu比值(0.18±0.014)[12]较为吻合,这表明中国湖泊柱样239+240Pu主要来源全球大气核试验沉降。然而地理位置靠近罗布泊的湖泊,可能会受到中国核试验的影响,但影响较小。
图1 中国湖泊柱样分布图(a)以及表层240Pu/239Pu比值(b)和柱样240Pu/239Pu平均值(c)
Fig.1 Distribution of lake sediment cores in China (a) and Surface 240Pu/239Pu (b) and average 240Pu/239Pu (c) values in sediment cores of Chinese lakes
表2 中国湖泊柱样沉积物中239+240Pu
Table 2 The 239+240Pu in sediment cores of Chinese lakes
| 序号 | 湖名 | 面积 (km2) | 纬度 (°N) | 239+240Pu沉积通量(MBq/km2) | 240Pu/239Pu 范围 | 240Pu/239Pu 均值 | 仪器 | 测试方法 | 测试单位 | 参考 文献 |
|---|---|---|---|---|---|---|---|---|---|---|
| 1 | 日月潭 | 8.8 | 23.87 | 35.9 | n.a. | n.a. | n.a. | Silicon-SB-D | IOES(中国) | [22] |
| 2 | 抚仙湖 | 216 | 24.30 | n.a. | 0.173~0.201 | 0.186±0.008 | n.a | SF-ICP-MS | GZU(中国) | [16] |
| 3 | 滇池 | 306 | 24.85 | Error | 0.164~0.187 | 0.174±0.007 | n.a. | SF-ICP-MS | GZU(中国) | [16] |
| 4 | 洱海 | 256.5 | 25.80 | 9.545±0.51 | n.a. | 0.181±0.007 | Element 2,Finngan(德国) | SF-ICP-MS | NIRS(日本) | [23] |
| 5 | 红枫湖 | 32 | 26.49 | 50.7 | 0.162~0.213 | 0.185±0.009 | Element 2,Finngan(德国) | SF-ICP-MS | NIRS(日本) | [17] |
| 6 | 程海湖 | 76 | 26.54 | 35.4 | 0.166~0.271 | 0.195±0.021 | Element 2,Finngan(德国) | SF-ICP-MS | NIRS(日本) | [18] |
| 7 | 草海 | 46.5 | 27.01 | 7.45±0.17 | n.a. | 0.170±0.010 | Element 2,Finngan(德国) | SF-ICP-MS | NIRS(日本) | [4] |
| 8 | 鄱阳湖 | 4125 | 29.13 | n.a. | n.a. | 0.187±0.04 | Element 2,Finngan(德国) | SF-ICP-MS | NIRS(日本) | [21] |
| 9 | 龙感湖 | 223 | 29.92 | n.a. | n.a. | 0.173±0.008 | Element 2,Finngan(德国) | SF-ICP-MS | NIRS(日本) | [4] |
| 10 | 青海湖1 | 4278 | 36.63 | 42.8±0.9 | 0.038~0.174 | 0.170±0.055 | Element 2,Finngan(德国) | SF-ICP-MS | NIRS(日本) | [20] |
| 11 | 青海湖2 | 4278 | 36.75 | 31.9±0.9 | 0.051~0.176 | 0.175±0.054 | Element 2,Finngan(德国) | SF-ICP-MS | NIRS(日本) | [20] |
| 12 | 青海湖3 | 4278 | 36.82 | 68.4±2.7 | 0.125~0.229 | 0.181±0.029 | Element 2,Finngan(德国) | SF-ICP-MS | NIRS(日本) | [20] |
| 13 | 苏干湖1 | 120 | 38.86 | 20.2±0.8 | 0.159~0.183 | 0.174±0.054 | Element 2,Finngan(德国) | SF-ICP-MS | NIRS(日本) | [19] |
| 14 | 苏干湖2 | 120 | 38.86 | 24.2±0.7 | 0.103~0.195 | 0.164±0.026 | Element 2,Finngan(德国) | SF-ICP-MS | NIRS(日本) | [19] |
| 15 | 双塔水库 | 40 | 40.55 | 240.6±5.3 | 0.160~0.192 | 0.178±0.007 | Element 2,Finngan(德国) | SF-ICP-MS | NIRS(日本) | [19] |
| 16 | 博斯腾湖1 | 1000 | 41.93 | 46.6±2.1 | 0.167~0.193 | 0.179±0.006 | Element 2,Finngan(德国) | SF-ICP-MS | NIRS(日本) | [13] |
| 17 | 博斯腾湖3 | 1000 | 41.93 | 56.4±2.0 | 0.166~0.216 | 0.179±0.011 | Element 2,Finngan(德国) | SF-ICP-MS | NIRS(日本) | [13] |
| 18 | 博斯腾湖2 | 1000 | 41.98 | 51.6±4.3 | 0.080~0.219 | 0.167±0.033 | Element 2,Finngan(德国) | SF-ICP-MS | NIRS(日本) | [13] |
| 19 | 四海龙湾湖 | 0.5 | 42.29 | 62.7±3.2 | 0.157~0.193 | 0.164±0.026 | Element 2,Finngan(德国) | SF-ICP-MS | NIRS(日本) | [19] |
目前已有的研究表明:离中国核试验区由近及远的博斯腾湖[13]、苏干湖[19]、程海湖[18]和草海[4]柱样中都发现240Pu/239Pu异常值,但是对于这些湖泊柱样中某层位中偶然出现的240Pu/239Pu异常值解释为受到中国大气核试验的影响需要进一步的讨论。例如,在距罗布泊核试验区较近(约250 km)的蒙新高原湖区内,苏干湖、博斯腾湖以及青海湖[20]共5个柱样某层位出现了远低于0.18的240Pu/239Pu比值,分别为0.103、0.080、0.125、0.051和0.038。但博斯腾湖4根柱样[13,24]中为何只有一根柱样(07BS10-2)一个层位出现了异常240Pu/239Pu比值的信号,有研究认为这个异常比值可能与罗布泊核试验产生的可溶性气溶胶颗粒和热核颗粒沉降后再悬浮造成的偶然性污染有关。然而,中国核试验对博斯腾湖的影响状况仍需进一步研究。距罗布泊核试验区较远(约1 000 km)的青海湖3根柱样也出现240Pu/239Pu的异常低值,与中国早期在原子城(原子城位于青海省海晏县金银滩草原,距青海湖直线距离约有20 km)进行核武器的研发活动有关。青海湖沉积物中检测出了239+240Pu的异常信号, 239+240Pu/137Cs比值增大主要是因为原子城核实验活动排放含239+240Pu废水引起的;柱样中137Cs的沉积通量值与同纬度大气沉降值(1 923 MBq/km2)较为吻合[20],这说明青海湖的137Cs主要来源于大气核试验沉降,137Cs没有出现异常。然而,距罗布泊核试验区更远(约1 800 km)的云贵高原湖区程海湖和草海沉积物出现异常高的240Pu/239Pu 比值(0.197),解释为可能源于罗布泊大气核试验产生的239+240Pu的信号,是值得商榷的。上述的湖泊柱样中出现的240Pu/239Pu的异常值显然不是受1986年前苏联切尔诺贝利核事故的影响,这是因为异常值出现的年代和240Pu/239Pu比值大小都与这次核事故特征比值(240Pu/239Pu比值为0.31~0.40)不一致。
另外,利用137Cs/239+240Pu或者239+240Pu/137Cs的活度比值也可以判断239+240Pu的来源,全球大气核试验沉降的239+240Pu/137Cs活度比值为0.028,区别于前苏联切尔诺贝利核事故产生的239+240Pu/137Cs低活度比值(0.001)[3]。从表3可知:红枫湖、程海湖、苏干湖、双塔水库、四海龙湾湖和博斯腾湖柱样沉积物中239+240Pu/137Cs活度比值与全球大气沉降的比值较为吻合,这证明这6个湖泊的239+240Pu与137Cs主要来源于全球大气沉降。从这6个湖泊的239+240Pu与137Cs的比活度之间的显著正相关关系(r2)来看,这也说明239+240Pu与137Cs具有相同的来源。需要说明的是239+240Pu/137Cs的活度比值判断239+240Pu的来源,需要把137Cs活度校正到沉降年代再讨论137Cs/239+240Pu或者239+240Pu/137Cs的活度比值才有意义[3]。
表3 239+240Pu与137Cs的相关关系[
Table 3 The relationship between 239+240Pu activity and 137Cs activity[
| 湖名 | 柱样名称 | 239+240Pu与137Cs的线性关系 | r2 | 239+240Pu/137Cs | 137Cs校正时间 |
|---|---|---|---|---|---|
| 红枫湖 | HF20040709S | 137Cs =63.766×239+240Pu+5.220 | 0.878 | 0.027~0.032 | 2004年7月 |
| 程海湖 | CH970608-1 | 137Cs =122.175×239+240Pu-8.096 | 0.881 | 0.008~0.039 | 1997年12月 |
| 苏干湖 | 2007SG2-1/2 | 137Cs =17.668×239+240Pu+2.368 | 0.944 | 0.042±0.002 | 1998年7月 |
| 双塔水库 | 2007ST1-3 | 137Cs =71.429×239+240Pu-11.407 | 0.967 | 0.033~0.039 | 1998年7月 |
| 四海龙湾湖 | 2006SHLW-4 | 137Cs =72.993×239+240Pu+15.292 | 0.908 | 0.025±0.003 | 1998年7月 |
| 博斯腾湖 博斯腾湖 | 06BS2-1 | 137Cs =20.071×239+240Pu+2.559 | 0.868 | 0.036 | 1998年7月 |
| 07BS10-2 | 137Cs =8.455×239+240Pu+9.158 | 0.535 | 0.053 | 1998年7月 |
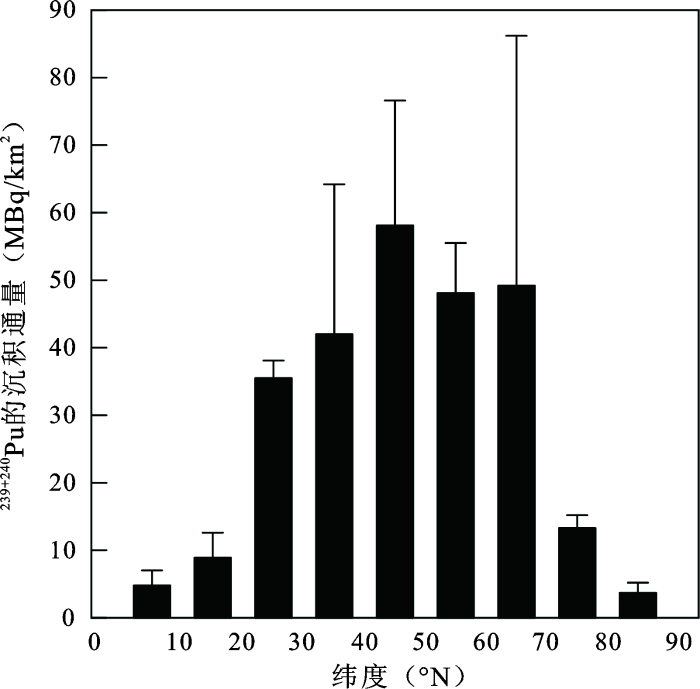
湖泊柱样沉积物中239+240Pu的沉积通量与239+240Pu的输入有关。湖泊中239+240Pu的输入方式通常有2种,一种是通过流域的输入,二种是通过大气的直接沉降[25](干沉降或者湿沉降)。不同纬度带内大气239+240Pu的沉降通量,与各个国家进行大气核武器次数,当量以及地理位置密切相关。据统计,截止到1996年全球共进行了2 047次核试验;其中美国进行了1 032次,前苏联715次,法国210次,英国和中国各45次。全球核试验中543 次为大气核试验,其他为水下核试验或者地下核试验[7]。全球大部分核试验场主要分布在北半球,例如前苏联的新地岛核试验基地,美国的内华达核试验场,这也使得239+240Pu在北半球的沉降量约占释放总量的80%[26];由于受到地球风带和气压带的影响,239+240Pu的全球分布呈现出随纬度变化的特征。联合国原子辐射效应科学委员会(UNSCEAR)[27]发布了研究报告,计算出了全球各纬度带(以10个纬度为间隔)239+240Pu沉降通量国际标准的平均参考值,其中北半球239+240Pu沉降通量的平均参考值如图2所示。在10°N到50°N范围内,239+240Pu沉降通量有随纬度增大的趋势:10°~20°N 为22 MBq/km2,20°~30°N为36 MBq/km2,30°~40°N为42 MBq/km2,40°~50°N为58 MBq/km2。湖泊柱样沉积物的沉积通量是单位面积上239+240Pu的活度,通过各层239+240Pu的活度、分样层厚度与相应层的干密度三者之间乘积再累加求和得到的,239+240Pu的沉积通量大小能够判断柱样中钚同位素的相对输入或者输出。239+240Pu的沉积通量与湖泊所处的纬度以及降雨等环境条件有关,图2展示了北半球9个纬度带UNSCEAR的推荐值,可以看出不同维度带内239+240Pu的沉积通量有差异。
图2 北半球不同纬度带239+240Pu的沉降通量[
Fig.2 239+240Pu fallout flux of the Northern Hemisphere[
从表2可知中国已研究的14个湖泊纬度在20°~50°N之间,其中滇池、抚仙湖、红枫湖、程海湖、鄱阳湖、日月潭、草海、洱海和龙感湖这9个湖泊的纬度介于20°~30°N之间,239+240Pu的沉积通量推荐值为36 MBq/km2;双塔水库、苏干湖和青海湖纬度介于30°~40°N之间,239+240Pu的沉积通量推荐值为42 MBq/km2;而博斯腾湖和四海龙湾湖纬度介于40°~50°N之间,239+240Pu的沉积通量推荐值为58 MBq/km2。这11个湖泊除去滇池DC-3柱样沉积通量值的数据有异常外,其他湖泊的15根柱样239+240Pu的沉积通量的范围在7.45~240.6 MBq/km2之间,博斯腾湖(06BS2-1、06BS2-3和07BS10-2)、程海湖、四海龙湾湖和日月潭[17,22]柱样的239+240Pu沉积通量与UNSCEAR推荐值吻合(图3虚线表示);而青海湖3根柱样239+240Pu的沉积通量的平均值为47.7±18.7 MBq/km2,略高于UNSCEAR推荐值(42 MBq/km2);去掉核试验活动对青海湖239+240Pu的输入,沉积通量也基本与UNSCEAR推荐值一致。
除了大气直接的沉降外,入湖径流和泥沙是湖泊沉积物中239+240Pu的另一重要来源。虽然湖泊沉积物中的239+240Pu沉积通量的空间分布是由大气沉降与流域内输入239+240Pu的总量所决定的;但是目前有关239+240Pu沉积通量与湖泊沉积定量关系的研究仍甚少。由于239+240Pu与137Cs具有相同的来源,在柱样较少受到外界扰动的情况下,柱样沉积物中的239+240Pu与137Cs具有显著的正相关关系(表3)。研究发现高纬度的青海湖沉积物中137Cs的沉积通量与质量累积率或沉积速率均有显著(r2=0.97)的正相关关系[29,30]。即在河口岸边区域沉积速率高,137Cs沉积通量也高;湖泊中心区域沉积速率低,137Cs沉积通量也低。同样的,在低纬度的鄱阳湖也发现沉积速率与137Cs沉积通量显著正相关[31];这说明239+240Pu的沉积通量与沉积速率可能也存在正相关的关系。但是有研究表明Erie湖[32](美国),1991年采样(r2=0.09)与2013年采样(r2=0.61),计算出137Cs的沉积通量与沉积速率正相关的显著性并不一致。Matisoff[32]推测沉积物中137Cs的解析脱附作用,使得137Cs的沉积通量变小。再者推测湖泊的面积,也是影响137Cs的沉积通量与沉积速率的两者之间的线性关系显著性的重要因素。因此,沉积通量与沉积速率之间的关系具有复杂性,是受到多种因素的影响。目前研究的中国14个湖泊来看,湖泊的面积各不相同(表2),流域面积与湖泊面积的比值也各不相同,导致来源泥沙的量也不一样。例如青海湖的流域面积约为湖泊面积的7倍,而鄱阳湖的流域面积约为湖泊面积的40倍。有研究表明湖泊的集水面积与湖泊面积的比值与沉积速率成正相关[31],这说明湖泊接受外源物质越多,相应泥沙含量越大,沉积速率也增大,导致放射性核素(例如137Cs和239+240Pu)的沉积通量相应增大。
具体而言,红枫湖与双塔水库的239+240Pu沉积通量出现了显著异于UNSCEAR推荐值的高值,苏干湖、草海和洱海出现了低值(图3)。蒙新高原湖区的双塔湖是个用于农业灌溉的人工水库,水域面积为13.3 km2,灌溉下游120 km2的耕地。因此,239+240Pu沉积通量的高值[19]可能与长期农业活动导致湖泊沉积环境受到扰动以及流域内沉积物的输入有关。云贵高原湖区的红枫湖的高值,主要是因为流域内喀斯特山地石漠化,裸露的岩石表面对放射性核素吸附较弱,降水侵蚀后再输入到湖泊所致。有研究表明红枫湖的沉积物的堆积速率是滇池的3.7倍[33],较多的泥沙来源以及较高的沉积速率导致了红枫湖239+240Pu的沉积通量变大。苏干湖低值可能与西北地区相对干旱的气候有关,苏干湖区域的年降雨量[19]只有15.5 mm;苏干湖水主要由大小哈尔腾河的地下潜流补给,并非来自于流域内地表径流的输入。草海和洱海出现了低值,虽然草海和洱海与红枫湖同处于云贵高原湖区,但是洱海和草海是受人类活动干扰频繁的浅水湖。人类活动和强风扰动以及上层与底层水体的交互对流等使得采样处的沉积物再悬浮,加剧了239+240Pu的扩散迁移,造成浅水湖中239+240Pu在水体寄宿时间短而出现流失[4]。再者,滇池的沉积物的堆积速率也远远低于红枫湖[33]。由于湖泊面积和取样密度的差异,一根或少数几根柱样239+240Pu的沉积通量只能反映湖泊局部区域采样位置处沉积通量的变化,对于整个湖泊沉积通量仍需进一步的观测和研究。然而,对于云贵高原的滇西湖区放射性核素如239+240Pu等沉积通的出现异常现象,是受到赤道印度洋水汽与太平洋水汽中放射性核素含量差异的影响[34],还是受到青藏隆起而产生的屏蔽效应的影响[35],目前还存在争议。
当前中国关于湖泊239+240Pu的研究多集中于蒙新高原湖区和云贵高原湖区,对于东部平原湖区和东北平原与山地湖区研究甚少,尤其是在青藏高原湖区关于239+240Pu的来源与沉降通量的研究还处于空白。青藏高原湖区环境特殊,拥有中国海拔最高、数量最多和面积最大的高原内陆湖,大于1 km2的湖泊有1 055个,面积约为41 832 km2[36]。青藏高原的环境效应对于239+240Pu全球大气沉降影响的程度目前还不是十分清楚,尤其是青藏高原冰川和积雪的融水是否对湖泊239+240Pu沉积存在影响。因此,湖泊沉积柱样中239+240Pu来源与区域环境的关系仍需深入研究。
全球沉降的239+240Pu的最大蓄积峰受到湖泊柱样中239+240Pu的迁移规律的影响。湖泊中沉积物中的放射性核素(例如137Cs和239+240Pu等)迁移方式通常有2种,一种是横向迁移,另一种是纵向迁移;纵向迁移中有扩散(diffusion)和迁移(migration)2种方式。通常认为只有湖泊沉积物中的239+240Pu的纵向迁移会对最大蓄积峰的位置产生影响。湖泊所处的海拔、纬度以及湖泊周围的地形地貌和植被分布,以及区域降水量、底栖生物扰动和人类活动等也会对湖泊柱样239+240Pu最大蓄积峰产生一定的影响[15]。前人通过数值模拟和实际观测对放射性核素如137Cs和239+240Pu等已经进行过深入的研究和探讨(表2),认为近现代环境未扰动湖泊沉积物中239+240Pu的迁移极小[37,38],柱样中239+240Pu最大蓄积峰位置的改变可以忽略不计。其中,Crusius 等[38]以美国-加拿大交界的Ontario湖和Dark湖6根柱样为例,用一维扩散模型对理想沉积环境下,即没有扰动沉积柱样中的137Cs和239+240Pu放射性核素迁移规律定量研究。
经典的模型中Kd表示分配系数,Kd值通常与沉积物样品中的有机质含量以及黏土矿物含量成正相关,即含量越大则Kd值越大,意味着沉积物中放射性核素的被吸附越牢固,反之亦然。有机质的含量越多不仅可以减少239+240Pu的迁移,还能够影响239+240Pu的价态[39]。在给定不同的Kd值分别与实测的137Cs和239+240Pu比活度值进行拟合,发现给定的Kd值较小时与实测的137Cs拟合较为一致,这表明沉积物中137Cs主要以可交换态的形式存在;另外,模型中239+240Pu分子扩散系数(Dm)相较于137Cs也更低,即湖泊柱样的137Cs迁移能力更大;这2个参数说明239+240Pu的迁移性远弱于137Cs。在非理想的情况下,湖泊柱样中的239+240Pu会受到生物扰动以及人为混合影响而发生迁移[40]。沉积物中239+240Pu的迁移速率同时还受到其他因素的影响,比如沉积物的质地、pH,盐度和孔隙度等。虽然在不同湖泊中影响239+240Pu迁移的因素不同,但是由于钚的特殊性质使得239+240Pu在湖泊柱样沉积物中的迁移速率极低,认为239+240Pu纵向的迁移可以忽略不计。因此,湖泊沉积柱样中239+240Pu的最大蓄积峰位置比137Cs更稳定,更适合于柱样沉积物定年及沉积速率的计算。
湖泊柱样沉积物中239+240Pu的分布特征与全球大气核试验放射性核素(如137Cs和239+240Pu等)的沉降过程密切相关。1961年9月至1962年12月,是全球大气核试验最密集时期,核爆产生大量的放射性核素沉降,由于沉降的滞后效应在1963年沉降达到高峰值;在日本东京地区连续50 a(1957~2005年)监测239+240Pu的大气沉降特征(沉降通量),239+240Pu的沉降通量在1963年到达最大[41]。如果放射性核素通过干沉降或者湿沉降的方式沉降到湖泊表面,然后被湖泊悬浮颗粒物吸附沉积到湖底而不发生迁移,沉积物剖面中放射性核素的含量变化可作为年代标志。20世纪50年代初的沉降起始年,1963年沉降的最大峰值年。考虑到放射尘沉降或沉积的滞后效应,湖泊柱样的239+240Pu 时标年代可能会比1963年滞后1 a。1970年代法国和中国进行了少量核试验[42],中国核试验当量较小,影响范围可能只是区域性的。1986 年前苏联切尔诺贝利发生核事故,在核事故发生的10 d内,估计进入环境的239+240Pu大约有6.0×10¹³Bq。由于239Pu和240Pu为非挥发性的核素,并且此次核事故是地面核事故,进入平流层的核尘埃的量非常有限,其影响范围也是区域性的。例如在距离切尔诺贝利核事故区约8 000 km的日本东京地区,1986年239+240Pu沉积通量观测中并没有发现沉降峰值[41, 42]。
从目前中国10个湖泊16根柱样239+240Pu分布特征的研究来看,中国湖泊柱样239+240Pu蓄积峰与137Cs单峰或者多重蓄积峰[15]不同,目前只出现了典型单峰和非典型单峰2种模式。典型单峰的特征表现为从起始层位到239+240Pu活度急剧增加到1963年或1964年的层位时,然后再迅速降低,剖面中的239+240Pu的最大蓄积峰明显。例如图4所示中国的蒙新高原湖区的博斯腾湖柱样(a)、东部平原湖区的日月潭柱样(b)、云贵高原湖区的红枫湖柱样(c)和东北平原与山地湖区的四海龙湾湖柱样(d)都出现了典型的单峰模式。典型单峰的形成主要是因为239+240Pu沉降到湖泊中再被沉积物吸附,沉积到湖底后几乎不发生扩散和迁移[7,20,37],且在沉积过程中较少受到环境扰动。中国湖泊柱样239+240Pu剖面中有14根呈现出典型的单峰,其中博斯腾湖BS2-1柱样虽然表层239+240Pu的活度较为均匀,但是仍能够判断蓄积峰的年代,并且通过210Pb和137Cs法辅助验证[13]。考虑239+240Pu沉降或沉积的滞后效应,最大蓄积峰年代被确定为1964年。然而对于湖泊的239+240Pu最大蓄积峰对应的年代不同学者有不同的认识,中国大多数学者研究认为是1964年,也有研究者认为对应年代为1963年,这个要根据湖泊所处的环境具体讨论。对于浅水湖泊中的239+240Pu可以快速从湖面沉积到湖底,沉积滞后时间可以忽略不计;而对于深水湖泊239+240Pu被悬浮颗粒物吸附后会出现沉积的滞后现象,其最大峰值年可能会滞后1~2 a。目前所研究的14个湖泊中,龙感湖最浅在3.8 m左右,抚仙湖最深大为87 m。沉积滞后时间的计算,以红枫湖(8 m)为例,基于地球化学质量平衡的箱式模型计算出137Cs滞后时间约为1 a。计算的公式[40, 43]为τs=h×(Cd+1/Kd) /s,其中τs表示悬浮颗粒物的停留时间(a),h表示平均水深(m),Cd表示湖水中悬浮颗粒物的浓度(g/cm3),Kd表示137Cs在悬浮颗粒物与湖水中分配系数(cm3/g),因此137Cs随着悬浮颗粒物沉降到湖底的半衰减时间Ts=τs×ln2;计算137Cs沉积滞后时间约为1 a[40],由于柱样中239+240Pu与137CS具有相似分布且来源相同,确定239+240Pu最大蓄积峰的年代为1964年[17]。因此,把239+240Pu的沉积滞后时间定为1 a是合理的。
图4 中国湖泊柱样239+240Pu剖面分布特征
Fig.4 Distribution characteristics of the 239+240Pu deposit profile in China
对于239+240Pu最大蓄积峰的年代为1963年还是1964年,可以利用210Pb法验证239+240Pu时标的可靠性,例如博斯腾湖B-2[24]柱样利用210Pb法验证239+240Pu最大蓄积峰的年代为1 963±2 a,日月潭[22]利用210Pb法验证该峰值年为1964~1966年。同样的也可利用137Cs时标验证239+240Pu时标的年代,青海湖、抚仙湖、四海龙湾湖、滇池和苏干湖柱样239+240Pu最大蓄积峰年代均被定为1964年(表2)。万国江等在程海湖[3]的研究中明确指出239+240Pu最大蓄积峰可以作为湖泊沉积物定年的时标(1964年),这与137Cs时标在湖泊沉积柱样定年的应用类似。国外目前已研究的7个湖13根柱样同样也出现了典型的单峰,湖泊柱样中239+240Pu主要来源于全球大气沉降。例如澳大利亚的King湖、Victoria湖和Wellington湖[44]等柱样发现239+240Pu最大蓄积峰年代为1964年,这是考虑到沉降的滞后效应,与137Cs时标和210Pb所推算的年代都吻合,认为蓄积峰在1964年是可靠的。芬兰的Päijänne湖[39]4根柱样(水深为32~51 m)中239+240Pu最大沉积通量的年代定为1963~1965年,这是考虑了沉积的滞后效应。而日本的 Tamogi 湖、Ichiyanagi 湖和Takahoko 湖[25]的6根柱样(采样水深<6 m)中239+240Pu最大蓄积峰的年代均被定为1963年,放射性核素239+240Pu沉积滞后时间忽略不计。
非典型单峰的特征是柱样239+240Pu活度从起始层位急剧增加到一定值后,转折处往上柱样中239+240Pu活度并没有再迅速降低。非典型单峰的形成,可能是因为所取柱样的湖水深度较浅,上层沉积物易受风浪或者人类活动的扰动而出现了沉积物的混合。中国湖泊已研究的239+240Pu柱样剖面中有1根呈现出非典型单峰,即博斯腾湖的BS2-3柱样[13]。通过对博斯腾湖BS2-3柱样的239+240Pu活度和240Pu/239Pu比值分布的研究,发现在柱样质量深度12 g/cm2以上239+240Pu活度均匀一致。这说明BS2-3柱样受到扰动,所以此柱样也不能利用137Cs和210Pb进行年代的比对。由于239+240Pu的均匀分布深度取决于扰动深度,所以不能确定BS2-3柱样239+240Pu最大活度转折处的年代。
虽然柱样中239+240Pu出现了典型的单峰,但是如果柱样受到局部区域大气核试验或核事故沉降的影响,239+240Pu最大蓄积峰处的年代是仍需深入探讨。例如博斯腾湖柱样07BS10-2也出现典型单峰[13],但是最大蓄积峰值处的年代并非1964年。这是因为最大蓄积峰处的240Pu/239Pu比值(0.080)明显低于0.180,表明239+240Pu并非来自于全球大气沉降。由于柱样的采集地博斯腾湖距罗布泊核试验区较近,只有250 km。研究表明07BS10-2柱样最有可能是受到罗布泊大气核试验影响[13],而不是受到切尔诺贝利核事故(240Pu/239Pu在0.31~0.40之间)的影响。研究发现由于新疆地区干燥的气候和低的年降雨量(70 mm)[13],罗布泊再悬浮物中使得柱样剖面239+240Pu 的1964年蓄积峰被后期沉降的239+240Pu掩盖,而新的最大蓄积峰的相对于老的蓄积峰(1964年蓄积峰)“上移”,利用137Cs定年为1967~1973年间[13],这个时段正是中国在罗布泊进行大气核试验的高峰期。07BS10-2柱样中239+240Pu/137Cs比值(0.053)远远高于全球沉降的比值(0.028),这也说明此柱样受到局部区域核试验的影响。虽然利用137Cs已经给出了239+ 240Pu最大蓄积峰时间区间,但是缩小最大蓄积峰所指的特定年代仍需进一步的研究与探讨。
相似的研究表明国外湖泊中也发现了局部区域核试验或核事故239+240Pu的信号,对239+240Pu最大蓄积峰产生影响:例如哈萨克斯坦[45]Alkat池和Korosteli池239+240Pu最大蓄积峰年代被提前到1950年代而非1963年,这是因为这2个湖泊位于前苏联塞米巴拉金斯克核试验基地的附近,受到早期(20世纪50年代)局部大规模核试验影响,导致放射性核素最大沉降年代不在1963年,而出现了239+240Pu最大蓄积峰的“下移”。另外,从哈萨克斯坦Alkat池(71 MBq/km2)和Korosteli池(221 MBq/km2)沉积通量可知明显高于50°~60°N 的推荐参考值(48.1±7.4 MBq/km2)。所以湖泊柱样239+240Pu的最大蓄积峰的年代可能受到局部核试验沉降的干扰。同样的,对于芬兰[39]的Päijänne湖除了全球大气沉降外,采用端元法计算表明有0.17±0.07%的239+240Pu是来自于1986年前苏联切尔诺核事故的局部沉降。需要说明的是2011年3月11日在日本发生了福岛核事故,事故中释放出了1.0~6.4×109Bq[10,46]的239+240Pu,然而这些钚同位素的释放对于日本湖泊沉积柱样的影响目前仍较少报道,需要持续的关注。
1) 中国湖泊239+240Pu的主要来源于全球大气核试验沉降,湖泊沉积柱样中表层沉积物的240Pu/239Pu均值为0.177±0.019;柱样240Pu/239Pu均值为0.177±0.008;柱样239+240Pu的沉积通量范围在7.45~240.6 MBq/km2之间,因湖泊所处沉积环境及纬度的差异而变化。湖泊柱样剖面中239+240Pu多呈单峰分布,239+240Pu最大蓄积峰具有时标(1964年)价值。
2) 由于239Pu和240Pu的半衰期较长,未来可以替代活度渐微的137Cs作为湖泊示踪研究的有效核素。环境敏感的青藏高原湖区关于239+240Pu的示踪研究目前还处于空白,罗布泊核试验对中国湖泊的影响仍需要深入的探讨。
致谢:感谢北京大学物理学院郭秋菊老师和南京大学地理与海洋科学学院肖智同学在论文写作中给予的帮助。
The authors have declared that no competing interests exist.
| [1] |
137Cs及210Pbex方法湖泊沉积计年研究新进展 [J].
<p><sup>137</sup>Cs及<sup>210</sup>Pb<sub>ex</sub>方法广泛应用于湖泊现代沉积计年。不扰动沉积物柱心的采样和高精度的分样装置是获取准确计年结果的前提。沉积物剖面中1975年层节<sup>137</sup>Cs次级峰值可作为辅助计年时标;沉积物中绝大部分<sup>137</sup>Cs处于稳定态保证了<sup>137</sup>Cs计年时标的可靠性。季节性滞水带缺氧湖泊中<sup>210</sup>Pb沉积后再迁移可能导致<sup>210</sup>Pb<sub>ex</sub>计年结果偏低。沉积物早期成岩过程中,铅化学相的转移提供了铅扩散迁移的地球化学条件;Pb—Po的扩散机理分别受Fe—Mn循环控制。</p>
Progresses on 137Cs and 210Pbex dating of lake sediments [J].
<p><sup>137</sup>Cs及<sup>210</sup>Pb<sub>ex</sub>方法广泛应用于湖泊现代沉积计年。不扰动沉积物柱心的采样和高精度的分样装置是获取准确计年结果的前提。沉积物剖面中1975年层节<sup>137</sup>Cs次级峰值可作为辅助计年时标;沉积物中绝大部分<sup>137</sup>Cs处于稳定态保证了<sup>137</sup>Cs计年时标的可靠性。季节性滞水带缺氧湖泊中<sup>210</sup>Pb沉积后再迁移可能导致<sup>210</sup>Pb<sub>ex</sub>计年结果偏低。沉积物早期成岩过程中,铅化学相的转移提供了铅扩散迁移的地球化学条件;Pb—Po的扩散机理分别受Fe—Mn循环控制。</p>
|
| [2] |
中国湖泊沉积物137Cs和210Pbex断代的一些问题 [J].https://doi.org/10.3969/j.issn.1001-7410.2012.03.09 URL Magsci [本文引用: 1] 摘要
<sup>137</sup> Cs和 <sup>210</sup> Pb<sub>ex</sub>是湖泊沉积物断代常用的两种核素,沉积物中核素的深度分布,不但随核素的大气沉降量变化,也与流域环境变化和沉积后核素的再分布有关。我国环境复杂,人类活动强烈,<sup>137</sup> Cs和 <sup>210</sup> Pb<sub>ex</sub>深度分布的非理想曲线常见于我国一些湖泊的沉积物。本文简要介绍了湖泊沉积物 <sup>137</sup> Cs和 <sup>210</sup> Pb<sub>ex</sub>深度分布理想曲线和断代基本原理,在参阅大量有关中国湖泊沉积物 <sup>137</sup> Cs和 <sup>210</sup> Pb<sub>ex</sub>断代文献的基础上,讨论了 <sup>137</sup> Cs和 <sup>210</sup> Pb<sub>ex</sub>非理想深度分布曲线的解译和沉积物断代的几个常见问题。主要观点如下: 1)我国湖泊沉积物不存在所谓的1974年和1986年蓄积峰;2)一些湖泊沉积出现的非单峰型 <sup>137</sup> Cs深度分布曲线,可能与人类活动或湖流扰动湖泊底泥、流域侵蚀产沙环境变化和 <sup>137</sup> Cs主要来源于冰川融水补给等因素有关;3)沉积物中的核素垂向运移,不改变剖面中1963年 <sup>137</sup> Cs蓄积峰的位置,不影响其断代标志意义;4)流域环境突发事件引起的沉积剖面中的 <sup>137</sup> Cs和 <sup>210</sup> Pb<sub>ex</sub>明显异常,是断代的可靠标志等。最后介绍了根据沉积剖面 <sup>137</sup> Cs和 <sup>210</sup> Pb<sub>ex</sub>总量与本底值对比,求算沉积速率的核素质量平衡法。
Wen Anbang et al. Discussion on applying 137Cs and 210Pbex for lake sediment dating in China .https://doi.org/10.3969/j.issn.1001-7410.2012.03.09 URL Magsci [本文引用: 1] 摘要
<sup>137</sup> Cs和 <sup>210</sup> Pb<sub>ex</sub>是湖泊沉积物断代常用的两种核素,沉积物中核素的深度分布,不但随核素的大气沉降量变化,也与流域环境变化和沉积后核素的再分布有关。我国环境复杂,人类活动强烈,<sup>137</sup> Cs和 <sup>210</sup> Pb<sub>ex</sub>深度分布的非理想曲线常见于我国一些湖泊的沉积物。本文简要介绍了湖泊沉积物 <sup>137</sup> Cs和 <sup>210</sup> Pb<sub>ex</sub>深度分布理想曲线和断代基本原理,在参阅大量有关中国湖泊沉积物 <sup>137</sup> Cs和 <sup>210</sup> Pb<sub>ex</sub>断代文献的基础上,讨论了 <sup>137</sup> Cs和 <sup>210</sup> Pb<sub>ex</sub>非理想深度分布曲线的解译和沉积物断代的几个常见问题。主要观点如下: 1)我国湖泊沉积物不存在所谓的1974年和1986年蓄积峰;2)一些湖泊沉积出现的非单峰型 <sup>137</sup> Cs深度分布曲线,可能与人类活动或湖流扰动湖泊底泥、流域侵蚀产沙环境变化和 <sup>137</sup> Cs主要来源于冰川融水补给等因素有关;3)沉积物中的核素垂向运移,不改变剖面中1963年 <sup>137</sup> Cs蓄积峰的位置,不影响其断代标志意义;4)流域环境突发事件引起的沉积剖面中的 <sup>137</sup> Cs和 <sup>210</sup> Pb<sub>ex</sub>明显异常,是断代的可靠标志等。最后介绍了根据沉积剖面 <sup>137</sup> Cs和 <sup>210</sup> Pb<sub>ex</sub>总量与本底值对比,求算沉积速率的核素质量平衡法。
|
| [3] |
239+240Pu作为湖泊沉积物计年时标: 以云南程海为例 [J].
在近代沉积作用领域<sup>137</sup>Cs时标与<sup>210</sup>Pb计年结合,获得了广泛而有效的应用.然而,<sup>137</sup>Cs经过两个半衰期的衰变已难于辩识.环境中的Pu核素具有相对较长的半衰期,也随全球大气扩散而散落于地球表面,可望作为沉积计年的时间标志.通过程海沉积物柱芯中<sup>239+240</sup>Pu比活度、<sup>240</sup>Pu/<sup>239</sup>Pu原子比率及校正到沉积年代的<sup>137</sup>Cs比活度的对比研究表明:二者比活度的垂直剖面基本相似、<sup>239+240</sup>Pu比活度与北半球<sup>137</sup>Cs逐年沉降量之间也具有很好的对应关系,显示出<sup>239+240</sup>Pu同样具有湖泊沉积计年的时标价值.不同层节沉积物中,<sup>239+240</sup>Pu/<sup>137</sup>Cs的平均值为0.016;∑<sup>239+240</sup>Pu/∑<sup>137</sup>Cs=0.012,与全球大气散落沉降的活度比相近.<sup>239+240</sup>Pu/<sup>137</sup>Cs活度比的垂直变化,寓意出<sup>239+240</sup>Pu在沉积物中较<sup>137</sup>Cs具有更小的扩散迁移能力.<sup>240</sup>Pu/<sup>239</sup>Pu原子比率平均值为0.195±0.021,显示<sup>240+239</sup>Pu主要来自全球大气散落沉降;沉积物8cm深度出现的异常点,显示出切尔诺贝利核事故影响的痕迹.
239+240Pu as a dating marker in lake sediments: An example from Lake Chenghai, China .
在近代沉积作用领域<sup>137</sup>Cs时标与<sup>210</sup>Pb计年结合,获得了广泛而有效的应用.然而,<sup>137</sup>Cs经过两个半衰期的衰变已难于辩识.环境中的Pu核素具有相对较长的半衰期,也随全球大气扩散而散落于地球表面,可望作为沉积计年的时间标志.通过程海沉积物柱芯中<sup>239+240</sup>Pu比活度、<sup>240</sup>Pu/<sup>239</sup>Pu原子比率及校正到沉积年代的<sup>137</sup>Cs比活度的对比研究表明:二者比活度的垂直剖面基本相似、<sup>239+240</sup>Pu比活度与北半球<sup>137</sup>Cs逐年沉降量之间也具有很好的对应关系,显示出<sup>239+240</sup>Pu同样具有湖泊沉积计年的时标价值.不同层节沉积物中,<sup>239+240</sup>Pu/<sup>137</sup>Cs的平均值为0.016;∑<sup>239+240</sup>Pu/∑<sup>137</sup>Cs=0.012,与全球大气散落沉降的活度比相近.<sup>239+240</sup>Pu/<sup>137</sup>Cs活度比的垂直变化,寓意出<sup>239+240</sup>Pu在沉积物中较<sup>137</sup>Cs具有更小的扩散迁移能力.<sup>240</sup>Pu/<sup>239</sup>Pu原子比率平均值为0.195±0.021,显示<sup>240+239</sup>Pu主要来自全球大气散落沉降;沉积物8cm深度出现的异常点,显示出切尔诺贝利核事故影响的痕迹.
|
| [4] |
放射性核素钚在湖泊沉积物中的分布特性及沉积年代学和流域侵蚀应用 [D].Distribution characteristics of radionuclide plutonium in lake sediments and their application in sedimentary chronology and watershed erosion . |
| [5] |
Plutonium AMS measurements in Yangtze River estuary sediment [J].https://doi.org/10.1016/j.nimb.2009.10.122 URL [本文引用: 1] 摘要
The quantity of material exported by the river is expected to decrease substantially as a consequence of an extensive continuing program of dam construction within the river catchment. We report here AMS measurements of plutonium isotope concentrations and ratios for selected depth increments from a sediment core, collected from the sub-aqueous delta of the Yangtze River estuary. The Pu derives from atmospheric nuclear weapons testing in the 1950s and 1960s, and is potentially a useful tracer of sediment deposition times in the marine environment. The results show considerable structure in the depth-concentration profile, and offer an excellent opportunity to compare Pu with the more commonly used 137 Cs isotopic tracer. The AMS data show superior sensitivity and indicate that the 240 Pu/ 239 Pu ratio can provide a check on the deposition dates. The changes in the 240 Pu and 239 Pu concentrations and the 240 Pu/ 239 Pu ratios with sediment depth all indicate the possibility of using Pu as a geochronological tool for coastal sediment studies.
|
| [6] |
Determination of Pu isotope concentrations and isotope ratio by inductively coupled plasma mass spectrometry: A review of analytical methodology [J].https://doi.org/10.1039/b617568f URL [本文引用: 1] 摘要
A number of analytical methods for Pu isotopes based on ICP-MS measurement have been developed and applied to the measurement of ultra-trace levels of Pu in nuclear fuel samples and environmental samples. The endeavour to improve the detection limit to sub-106118g (ag) mL611has been continued by using efficient sample introduction systems. This review summarizes and critically discusses various types of ICP-MS, sample introduction systems and separation methods applied to the determination of Pu in many sample types. Together with the separation method, the adjustment of the Pu oxidation state in the loading solution preparation step and Pu elution step is summarized. The interference problem from polyatomic ions in ICP-MS coupled with various sample introduction systems is described, especially focused on the UH+interference. Several factors affecting the trueness and precision of Pu results are discussed.
|
| [7] |
Determination of plutonium and other transuranic elements by inductively coupled plasma mass spectrometry: A historical perspective and new frontiers in the environmental sciences [J].https://doi.org/10.1016/j.sab.2008.04.018 URL [本文引用: 3] 摘要
Inductively coupled plasma mass spectrometry (ICPMS), particularly with sector field mass analyzers (SF-ICPMS), has emerged in the past several years as an excellent analytical technique for rapid, highly sensitive determination of transuranic elements (TRU) in environmental samples. SF-ICPMS has advantages of simplicity of sample preparation, high sample throughput, widespread availability in laboratories worldwide, and relatively straightforward operation when compared to other competing mass spectrometric techniques. Arguably, SF-ICPMS is the preferred technique for routine, high-throughput determination of 237 Np and the Pu isotopes, excepting 238 Pu, at fg-pg levels in environmental samples. Many research groups have now demonstrated the SF-ICPMS determination of 23902+02240 Pu activities, 240 Pu/ 239 Pu and other Pu atom ratios in several different application areas. Many studies have examined the relative contribution of global fallout vs. local/regional Pu sources in the environment through measurement of 240 Pu/ 239 Pu and, in some cases, 241 Pu/ 239 Pu and 242 Pu/ 239 Pu. “Stratospheric fallout”, which was deposited from thermonuclear tests, conducted largely during the 1952–1964 time period, is characterized by a well-defined 240 Pu/ 239 Pu of ~020.18, while most other sources have different ratios. Examples of local/regional Pu sources are the Nevada Test Site, the Chernobyl plume, and accidents at Palomares, Spain and Thule, Greenland. The determination of Pu activities and atom ratios has stimulated much interest in the use of Pu as a marine tracer; several studies have shown that Pu is transported over long distances by ocean currents. 240 Pu/ 239 Pu ratios >020.20 in sediments and seawater of the North Pacific are ascribed to ocean current transport of fallout from the Pacific Proving Ground. In nuclear forensics, much effort is focused on detection and fingerprinting of small amounts of TRU in environmental samples consisting of bulk material or individual isolated particles. Activity measurements of 23902+02240 Pu, determined by SF-ICPMS, have the potential to supplement and/or replace 137 Cs as a tracer of erosion, deposition, and sedimentation. Undoubtedly, the application of SF-ICPMS in TRU analysis will continue to expand, witness new developments, and generate interesting unforeseen applications in upcoming years.
|
| [8] |
长江口及苏北潮滩沉积物中放射性核素钚(Pu) 的分布特征与环境意义[D] .Distribution characteristics and environmental significance of the radionuclide Pu in the sediments of the Yangtze River estuary and the north Jiangsu tidal flat . |
| [9] |
Plutonium isotopes as tracers for ocean processes: a review [J].https://doi.org/10.1016/j.marenvres.2009.08.002 URL PMID: 19773079 [本文引用: 1] 摘要
Since the first nuclear weapons tests in the 1940s, pulsed inputs of plutonium isotopes have served as excellent tracers for understanding sources, pathways, dynamics and the fate of pollutants and particles in the marine environment. Due to the well-defined spatial and temporal inputs of Pu, the long half-lives of Pu and Pu and its unique chemical properties, Pu is a potential tracer for various physical and biogeochemical ocean processes, including circulation, sedimentation and biological productivity, and hence a means of assessing the impacts of global climate change. Due to the source dependency of the Pu isotopic signature, plutonium isotopes are beginning to be exploited as tools for the evaluation and improvement of regional and global ocean models that will enhance understanding of past and future changes in the oceans. This paper addresses the major sources of Pu and the physical and biogeochemical behaviour in the marine environment. Finally, the use of Pu isotopes as tracers for various oceanic processes (e.g. water mass transport, particle export, and sedimentation) is considered.
|
| [10] |
Isotopic evidence of plutonium release into the environment from the Fukushima DNPP accident [J].https://doi.org/10.1038/srep00304 URL PMID: 3297203 [本文引用: 2] 摘要
The Fukushima Daiichi nuclear power plant (DNPP) accident caused massive releases of radioactivity into the environment. The released highly volatile fission products, such as Te, I, Cs, Cs and Cs were found to be widely distributed in Fukushima and its adjacent prefectures in eastern Japan. However, the release of non-volatile actinides, in particular, Pu isotopes remains uncertain almost one year after the accident. Here we report the isotopic evidence for the release of Pu into the atmosphere and deposition on the ground in northwest and south of the Fukushima DNPP in the 20-30 km zones. The high activity ratio of Pu/Pu (> 100) from the Fukushima DNPP accident highlights the need for long-term Pu dose assessment, and the ingrowth of Am. The results are important for the estimation of reactor damage and have significant implication in the strategy of decontamination.
|
| [11] |
Isotopic analysis of uranium and plutonium using ICP-MS and estimation of burn-up of spent uranium in contaminated environmental samples [J].https://doi.org/10.1039/b202196j URL [本文引用: 1] 摘要
Environmental monitoring of actinides and evaluation of the contamination source nuclear weapons tests, nuclear power plant and nuclear reprocessing plant accidents,etc. requires precise and accurate isotopic analysis of actinides, especially uranium and plutonium. Double-focusing sector-field inductively coupled plasma mass spectrometry ICP-SFMS using a low-flow microconcentric nebulizer with membrane desolvation, “Aridus”, was applied for isotopic measurements of uranium and plutonium at the ultratrace level. The detection limit 3σfor236U and239Pu after chemical extraction was 0.2 pg l611in aqueous solution and 0.04 pg g611in soil, respectively.235U238U,236U238U and240Pu239Pu isotope ratios were measured in soil samples collected within the 30 km zone around the Chernobyl nuclear power plant. The average240Pu239Pu isotope ratio in contaminated surface soil was 0.396 ± 0.014. The burn-up grade and the portion of spent uranium in the spent uraniumnatural uranium mixture in soil were calculated using the iteration method. A slight variation in the burn-up grade of spent reactor uranium was revealed by analyzing235U238U and236U238U isotope ratios. A relationship between the240Pu239Pu isotope ratio and burn-up of spent uranium was observed.
|
| [12] |
Global distribution of Pu isotopes and 237Np [J]. |
| [13] |
Vertical distributions of radionuclides 239+ 240Pu, 240Pu/239Pu, and 137Cs in sediment cores of Lake Bosten in Northwestern China [J].https://doi.org/10.1021/es405364m URL [本文引用: 13] |
| [14] |
Pu isotopes in soils collected downwind from Lop Nor: Regional fallout vs. global fallout [J].https://doi.org/10.9734/JSRR/2015/14076 URL [本文引用: 2] 摘要
Aims: This work aims to explain seasonal changes in frugivorous bird species richness, abundance and diversity, addressing climatic and habitat variables (rainfall, Photosynthetically Active Radiation as PPDF) and species trait factors (diet), while considering the effect of phylogenetic constraints. Place and Duration of Study: Forest Reserve of Chancan , C rdoba Province, Argentina (31 2' S and 65 25' W), during 1995-1996. Methodology: In the study area two randomly located sampling points separated each other by two km were established. Phenological records for seven forest plant species producing fruits were taken monthly, along with habitat and climatic variables (PPDF, rainfall). Bird sampling was done monthly. Fourteen transects, each of 50 m long were permanently marked from randomly located points in N-S direction. While slowly walking along each transect, all bird sightings as well as hearings both to right and left sides were recorded. The bird species and the vegetation stratum where the sighting occurred were also recorded. Statistical Analysis: For all the bird species and for frugivorous species, bird species richness (S), species abundance as sightings, diversity (Shannon Index H ) and evenness (H /lnS) were calculated for each sampling date. Friedman test was used to test differences in species richness and sightings among dates. For frugivorous bird data analysis, two approaches were used, one with the species values taken as independent data points, and the other removing phylogenetic effects by means of the analysis of independent contrasts. Categorical Principal Component Analysis (CATPCA) was used to explore the relationships among species dates of sighting initiation, duration of the sighting period and abundances at peak dates, using species values and independent contrasts. CATPCA (with species values) was also used to explore the relationships among frugivorous bird species richness, abundance and diversity, and climatic (rainfall) and habitat (PPDF and fruit abundance) variables. Results: A total of 67 species were recorded during the sampling period. Richness rose in spring, peaked during summer and then declined smoothly to winter. In contrast, abundance maintained fluctuating values during the sampling period, with a small peak in autumn. There were no significant differences in vegetation strata occupancy by different species of birds, although some groups showed a degree of preference. Considering frugivorous birds, a total of 29 frugivorous species were recorded during the sampling period. The temporal trend of species richness and diversity was similar to the pattern showed by all the species, although abundance showed a bimodal trend. CATPCA using species values and independent contrasts showed common overall results for the variables initiation and maximum of frugivorous species abundance, that were inversely or not correlated with duration of sightings, maximum abundance and total abundance along the sampling period. However, the behaviour of the variable Diet changed when independent contrasts were used. From a closer relationship with sighting initiation and peak and a greater importance with species values data, Diet showed a more distant relationship with these sightings variables and a negligible value when independent contrasts were used. Besides, using independent contrasts many species were differently related with the variables and the dispersion of the species was greater in the ordination space. Regarding climatic and habitat variables, rainfall and PPDF showed an overall similar seasonal pattern, although PPFD began rising earlier during the dry season. Rainfall and PPDF were temporally correlated. Fruits began appearing in spring, peaked during this season, and then decreased sharply to disappear during winter. Fruit abundance was highly correlated with PPFD but not with rainfall. CATPCA of climatic, habitat, and frugivorous bird variables (richness, abundance and diversity) separated spring, summer and autumn sampling dates from the last autumn date and winter dates. PPDF and fruit abundance explained most of the variance in bird richness and diversity but not in abundance. Rainfall did not explain the behaviour of any bird variable. Conclusion: We conclude that habitat characteristics, mainly PPFD and fruit abundance, are shaping the seasonal species composition (richness and diversity), although not abundance, of frugivorous bird assemblages in semiarid Chaco forests. The importance of the frugivorous diet diversification, as a species trait factor that could be contributing to shape the seasonal arrangement of frugivorous birds, was secondary and mainly related to the timing of appearance in the favourable season. However, even this modest contribution of diet diminished when the phylogeny were taken into account, showing a strong phylogenetic signal.
|
| [15] |
中国地区湖泊沉积物中137Cs 分布特征和环境意义 [J].https://doi.org/10.3321/j.issn:1003-5427.2009.01.001 URL Magsci [本文引用: 3] 摘要
137Cs是人为放射性核素,长期以来,它在沉积物岩芯剖面中的分布被用作近代沉积物定年的重要手段之一,本文全面收集了关于我同湖泊沉积物中137Cs分布的研究文献,对它们进行了综合分析和对比;试图揭示中国湖泊沉积物中137Cs剖面分布特征和环境意义;结合我同湖泊分区和特点,分别讨论了我国5大湖区137Cs的总体特征和主要影响因素,研究表明:影响137Cs沉积剖面分布的因素,除了纬度和海拔外,还应与当地的地貌特征、降雨量、植被状况和人类活动有关;全球核大气沉降是中同湖泊沉积物的137Cs剖面分布最主要的来源,同时我国早期的大气核试验和前苏联切尔诺贝利核泄漏事件对我国部分地区137Cs分布可能有一定的影响.
The distribution characteristic and environmental significance of Cesium-137 deposit profile in Chinese lacustrine sediment .https://doi.org/10.3321/j.issn:1003-5427.2009.01.001 URL Magsci [本文引用: 3] 摘要
137Cs是人为放射性核素,长期以来,它在沉积物岩芯剖面中的分布被用作近代沉积物定年的重要手段之一,本文全面收集了关于我同湖泊沉积物中137Cs分布的研究文献,对它们进行了综合分析和对比;试图揭示中国湖泊沉积物中137Cs剖面分布特征和环境意义;结合我同湖泊分区和特点,分别讨论了我国5大湖区137Cs的总体特征和主要影响因素,研究表明:影响137Cs沉积剖面分布的因素,除了纬度和海拔外,还应与当地的地貌特征、降雨量、植被状况和人类活动有关;全球核大气沉降是中同湖泊沉积物的137Cs剖面分布最主要的来源,同时我国早期的大气核试验和前苏联切尔诺贝利核泄漏事件对我国部分地区137Cs分布可能有一定的影响.
|
| [16] |
典型地区湖泊中210Pb、137Cs 和 Pu 的剖面分布特征及其环境意义 [D].Spatial distribution of lead, radio-cesium and plutonium in typical lake sediments and their application for recent chronology . |
| [17] |
Global fallout Pu recorded in lacustrine sediments in Lake Hong feng, SW China [J].https://doi.org/10.1016/j.envpol.2007.06.027 URL PMID: 17651874 [本文引用: 4] 摘要
Studies on the distribution and isotope compositions of fallout Pu are important for source characterization of possible future non-fallout Pu contamination in aquatic environments, and useful for dating of recent sediments to understand the pollution history of environmental contaminants. We present the historical record of atmospheric Pu fallout reconstructed from a sediment core from Lake Hongfeng, China. The Pu activity profile was in agreement with the 137Cs profile. Inventories were 50.7 Bq m(-2) for 239+240Pu and 1586 Bq m(-2) for 137Cs. The average 240Pu/239Pu atom ratio was 0.185+/-0.009, indicating that Pu originated from global stratospheric fallout rather than from direct tropospheric or close-in fallout from the Chinese nuclear testing conducted in the 1970s. Our data suggested that Lake Hongfeng would be an ideal setting for monitoring atmospheric fallout and environmental changes in this region.
|
| [18] |
Vertical distributions of 239+240Pu activity and 240Pu/239Pu atom ratio in sediment core of Lake Chenghai, SW China [J].https://doi.org/10.1007/s10967-006-7001-2 URL [本文引用: 1] 摘要
Due to the different 240 Pu/ 239 Pu atom ratios from different sources of Pu in the environment, Pu isotopes have been widely used for source identification of radionuclides in sediments. In this work, using sector-field ICP-MS, we investigated Pu inventory and its isotopic composition in a lacustrine sediment core collected in Chenghai Lake, SW China. The 240 Pu/ 239 Pu atom ratios in this sediment core ranged from 0.166 to 0.271 with a mean of 0.195卤0.021, which was slightly higher than that of global fallout. The 239+240 Pu/ 137 Cs activity ratios ranged from 0.0155 to 0.0411, with a mean of 0.0215, and the 239+240 Pu inventory was 35.4 MBq/km 2 ; both 239+240 Pu/ 137 Cs activity ratio and Pu inventory were close to those values of global fallout at 20 30 N. Three peaks were observed for both 137 Cs and 239+240 Pu activities in the examined sediment core; they most probably indicated the maximum deposition of global fallout between 1963 and 1964, the fallout from a series of Chinese nuclear tests during the 1970s, and the deposition of resuspended Pu-bearing particles from the Chernobyl accident. Therefore, the vertical profile of Pu isotopes should provide useful time markers for rapid dating of recent sediments.
|
| [19] |
Vertical distributions of plutonium and 137Cs in lacustrine sediments in northwestern China: Quantifying sediment accumulation rates and source identifications [J].https://doi.org/10.1021/es9029649 URL PMID: 20302293 [本文引用: 6] 摘要
Abstract We investigated the vertical distributions of 239+240Pu and 137Cs activities and 240Pu/239Pu atom ratios in two lakes in northwestern China. The 240Pu/239Pu atom ratio from the Chinese nuclear test (CNT) site at Lop Nor is too complicated to identify the regional fallout source. However, radionuclides from the test site may be resolved mainly by the vertical distribution of radionuclides because there is no overlap between the global fallout peak and the local fallout peak. We analyzed Pu isotopes and 137Cs in sediments from two lakes (Sugan and Shuangta) located in northwestern China, near the CNT, and Lake Sihailongwan located in northeastern China to date recent lacustrine sediments and resolve global/local fallout sources. The apparently low 240Pu/239Pu atom ratio of 0.103 +/- 0.010 at Lake Sugan was likely representative of the fallout from the Lop Nor site. Our results also demonstrated that the 239+240Pu activity was more useful for recent chronology of lacustrine sediments, compared to 137Cs. Sediment accumulation rates of 0.651, 0.058-0.061, and 0.015 g x cm(-2) x a(-1) for sediment cores of Lake Shuangta, Lake Sugan and Lake Sihailongwan, respectively, were obtained by using the 239+240Pu fallout peak as a discrete time marker for 1964. The respective contributions of 137Cs and 239+240Pu from the CNT were estimated to be about 40 and 27% for Lake Sugan and 36 and 20% for Lake Shuangta. Plutonium isotopes in lacustrine sediments were proven to be useful for quantifying sediment accumulation rates and for source identification of the radioactive contamination.
|
| [20] |
Anomalous plutonium isotopic ratios in sediments of Lake Qinghai from the Qinghai-Tibetan Plateau, China [J].https://doi.org/10.1021/es202315c URL PMID: 21950768 [本文引用: 4] 摘要
The vertical profiles of (239+240)Pu and (137)Cs activities and (240)Pu/(239)Pu isotopic ratios are determined for three sediment cores of Lake Qinghai from the Qinghai-Tibetan Plateau, China, and compared with those in sediments of another three lakes (Lakes Bosten, Sugan, and Shuangta), the only existing ones closest to Lop Nor area, China's nuclear weapons test site in the northwestern part of the country. The mean inventory of 47.7 卤 18.7 MBq km(-2) for (239+240)Pu activity in Lake Qinghai is comparable to the average value of global fallout expected at the same latitude, yet the mean inventory of 1112.0 卤 78.0 MBq km(-2) for (137)Cs is slightly lower than that of global fallout. Anomalously low (240)Pu/(239)Pu isotopic ratios (0.038-0.125) were found in the 3-6.5 cm deep sediment layers, indicating the trace Pu input from early nuclear weapons research activities at Atomic City in the lake's watershed during the 1950-60s. Model calculation indicated that the Pu input accounted for approximately 5-16% of the total Pu inventory. The observation of low (240)Pu/(239)Pu ratio in the deep sediment layer provided a new time marker for recent sediment dating in the lake and around the area. The results are of great significance to the further understanding of sources, records, and environmental impacts of global and regional nuclear activities in the environment and provide important chronological information for further studies on the water eutrophication process and climatic change, and reconstruction of pollution history of organic contaminants and heavy metals in the watershed of Lake Qinghai.
|
| [21] |
Determination of plutonium isotopes in freshwater lake sediments by sector-field ICP-MS after separation using ion-exchange chromatography [J].https://doi.org/10.1016/j.apradiso.2008.01.001 URL PMID: 18276148 摘要
Abstract The determination of Pu isotopes in lake sediments is important for many studies, such as Pu pollution source identification, sediment mixing estimation, erosion evaluation and establishment of deposition chronology in lakes. In this paper, a simple analytical method using sector field inductively coupled plasma mass spectrometry (ICP-MS) combined with two-stage chromatographic separation and purification of Pu was developed based on the optimization and adaptation of the previously published method for marine samples with an emphasis on the study of the elimination of interferences for the analysis of freshwater lake sediments. A strong base anion-exchange resin (AG MP-1M) was used to purify Pu isotopes with concentrated HBr as the final eluent for Pu elution. The chemical yields were ca. 64% and the decontamination factor for U was ca. 10(5). The developed method was validated using a freshwater lake sediment reference material (SRM-4354) and a marine sediment reference material (IAEA-368), and applied to the determination of Pu isotopes in sediment samples of Lake Poyang, East China. For the analysis of certified reference materials, both 239+240Pu activity of 31.6 mBq g(-1) and 240Pu/239Pu atom ratio of 0.033 for IAEA-368 were comparable to the certified value and/or literature values. As for SRM-4354, 239+240Pu activity of 3.90 mBq g(-1) agreed well with the certified value. However, the mean 240Pu/239Pu atom ratio of 0.144 was lower than those reported by other laboratories. This difference suggested that this material may be isotopically inhomogeneous. 240Pu/239Pu atom ratios of Poyang Lake sediment samples ranged from 0.185 to 0.192 with a mean value of 0.187+/-0.004, indicating that plutonium pollution originated from global fallout.
|
| [22] |
Lead-210 and plutonium fallout in Taiwan as recorded at a subalpine lake [J].https://doi.org/10.1016/S0743-9547(96)00072-4 URL [本文引用: 2] 摘要
A sediment core collected from the Sun Moon Lake in middle Taiwan was investigated for Pb and Pu. Based on the decrease of excess Pb with depth, the mean sedimentation rate in the lake during the past half century is about 0.9 cm yr, which is unequivocally supported by the appearance of the 1963 plutonium fallout maximum at 26-28 cm. The short-term sedimentation rate is one order of magnitude greater than C-based long-term sedimentation rates in the lake reported previously. This may be attributed to the deterioration of soil conservation associated with the construction of a dam five decades ago.Total downcore inventories of excess Pb and Pu are 54.5 dpm cmand 0.21 dpm cm, respectively. This Pb inventory requires a flux of 1.7 dpm cmyrat steady state, which is similar to Pb fluxes observed at other sites in the western Pacific rim. The inventory of Pu is in excellent agreement with documented cumulative Pu from global fallout (0.96 +/- 0.07 mCi km) at the 20-30N latitudinal band. Our data suggest that the Sun Moon Lake is an ideal setting for monitoring atmospheric fallout and environmental changes in this region.
|
| [23] |
放射性钚和铯在湖泊中的时空分布特性及近期沉积年代学应用[D] .Temporal and spatial distribution of radioactive plutonium and cesium in lakes and recent depositional chronology applications . |
| [24] |
新疆博斯腾湖沉积岩心的210Pb、228Th、239,240Pu 和3H的分布及意义 [J].Distributions of 210Pb,238Th,239,240Pu and 3H and their implications in sediment core from bosten lake, Xinjiang,China [J]. |
| [25] |
Inventories of 239+240Pu, 137Cs, and excess 210Pb in sediments from freshwater and brackish lakes in Rokkasho, Japan, adjacent to a spent nuclear fuel reprocessing plant [J].https://doi.org/10.1016/j.jenvrad.2009.06.008 URL PMID: 19586693 [本文引用: 2] 摘要
We investigated the vertical profiles of 239+240 Pu, 137 Cs, and excess 210 Pb ( 210 Pb ex ) in sediment core samples obtained from two freshwater lakes and two brackish lakes situated near the first commercial spent nuclear fuel reprocessing plant in Rokkasho, Japan, before the final test of the plant using actual spent nuclear fuel. The inventory of 239+240 Pu in those lakes was larger than that in soil in Rokkasho, which indicated the inflow of 239+240 Pu from the catchment area in addition to direct deposition on the lake surfaces. The 137 Cs inventory in sediments of the brackish lakes was lower than that in the soil, which showed that part of the 137 Cs was removed from the sediments by the brackish water or that it was not deposited into the sediments, because of the high solubility of Cs in brackish water. The 137 Cs inventory in sediments of the freshwater lakes was higher than that of the brackish lakes, and comparable with that in soil except for one core sample out of four. The 239+240 Pu/ 137 Cs ratio in freshwater lake sediments was higher than that in soil, and that indicated that part of the 137 Cs was lost from the sediments. The low inventory of 137 Cs may be attributable to competition for absorption sites in sediments with ammonium ions formed in the reducing environment which occurs from summer to fall in the sediments. Those data will be used as background data on the artificial radionuclides in the lakes to assess the effect of released radionuclides on their concentrations.
|
| [26] |
Deposition and accumulation of plutonium isotopes in Antarctica [J].https://doi.org/10.1038/279628a0 URL [本文引用: 1] 摘要
DATA on the deposition of plutonium isotopes are presented here from the atmosphere at Dome C (123°10′E, 74°39′S; 3,214m elevation) on the high Antarctic plateau. Plutonium isotopes are among the anthropogenic chemicals that have become global contaminants 1–3 and it is, therefore, important to gain a historical perspective to their worldwide dispersion. The analysis of successive layers of permanent snow fields permits the determination of both present and historical fluxes of anthropogenic chemicals and other contaminants that are dispersed through the atmosphere 3–6 . Dome C is an ideal site for such studies: annual precipitation at Dome C is of the order of 3.7 g H 2 O cm 612 (ref. 7), considerably lower than the mean annual deposition of 15.5 g H 2 O cm 612 over the entire continent 8 . The mean annual temperature is 6153.5 °C 7 , with summer temperatures remaining well below freezing, precluding vertical percolation through successive layers and reducing potential losses from volatilisation.
|
| [27] |
Effects of Ionizing Radiation: United Nations Scientific Committee on the Effects of Atomic Radiation: UNSCEAR 2006 Report, Volume 1-Report to the General Assembly, with Scientific Annexes A and B [J].https://doi.org/10.1093/rpd/ncp262 URL [本文引用: 1] |
| [28] |
我国环境土壤和地表水沉积物中Pu的分布特征研究 [J].
我国不同地区表层土壤Pu放射性活度水平有较大差异,总体来讲239+240Pu活度浓度均在1 mBq/g以下。新疆核试验场上风向地区已有研究结果表明Pu来源于全球大气沉降,没有受到我国核试验的影响;而下风向地区,有采样点表明239+240Pu沉积通量达到了同纬度全球沉降值的5倍以上(300 Bq/m2),而湖泊沉积物中有低于全球沉降240Pu/239Pu原子比值的数据报道。但由于报道数据有限,尚不能全面评价我国核试验对下风向地区的影响大小和影响范围。我国核试验场周边以外地区Pu沉积通量均在全球沉降范围以内(10~60 Bq/m2),240Pu/239Pu比值也与全球沉降比值(0.18)没有显著差异。Pu在不同类型的土壤中呈现出不同的分布形式,其迁移行为受到土壤类型、气候条件等多种因素的影响。
Concentration and characterization of plutonium in soils and groundwater sediments in China .
我国不同地区表层土壤Pu放射性活度水平有较大差异,总体来讲239+240Pu活度浓度均在1 mBq/g以下。新疆核试验场上风向地区已有研究结果表明Pu来源于全球大气沉降,没有受到我国核试验的影响;而下风向地区,有采样点表明239+240Pu沉积通量达到了同纬度全球沉降值的5倍以上(300 Bq/m2),而湖泊沉积物中有低于全球沉降240Pu/239Pu原子比值的数据报道。但由于报道数据有限,尚不能全面评价我国核试验对下风向地区的影响大小和影响范围。我国核试验场周边以外地区Pu沉积通量均在全球沉降范围以内(10~60 Bq/m2),240Pu/239Pu比值也与全球沉降比值(0.18)没有显著差异。Pu在不同类型的土壤中呈现出不同的分布形式,其迁移行为受到土壤类型、气候条件等多种因素的影响。
|
| [29] |
137Cs质量平衡法测算青海湖现代沉积速率的尝试 [J].https://doi.org/10.18307/2009.0612 URL Magsci [本文引用: 1] 摘要
本文是~(137)Cs质量平衡法测算青海湖现代沉积速率的尝试.青海湖和其他低沉积速率湖泊沉积物剖面中,深度数cm处的~(137)Cs蓄积峰,也可能是沉降到底泥表面的~(137)Cs尘埃,以扩散和迁移的方式向下入渗形成.因此,将沉积剖面中的~(137)Cs蓄积峰解释为1963年的沉积,并据此计算沉积速率,未必合理.青海湖湖滨草地测得的2005年~(137)Cs本底值为1 17.7mBq/cm~2.湖泊中部海心山到东南部渔场一线的6个孔的~(137)Cs面积活度介于92.9-325.0mBq/cm~2,其中青海湖东南部两个孔的~(137)Cs面积活度较高,分别为本底值的155%和270%;湖泊中部4个孔的~(137)Cs面积活度略高于或低于本底值.显然,湖泊东南部有明显沉积发生,特别是位于江西沟冲积扇前缘水下部分的QHH02孔,沉积强烈,水深也最小;湖泊中部沉积轻微.根据表层底泥样品的~(137)Cs浓度,入湖河流泥沙的~(137)Cs浓度和流域内草地表层土壤~(137)Cs浓度的分析,初步确定C=30mBq/g,为1963年以来青海湖沉积泥沙的平均~(137)Cs浓度.利用~(137)Cs质量平衡模型求得的湖泊中部的平均沉积速率为0.020cm/a,和根据布哈河输沙模数求算出的青海湖平均沉积速率0.018cm/a吻合,远低于已报导的断代法测定的青海湖沉积速率.湖泊东南部的沉积速率大于湖泊中部,QHH02孔的沉积速率高达0.229cm/a,是已报导的青海湖沉积速率的两倍.<dt><strong><t>Abstract:</t></strong></dt><dd>This paper was an attempt to use the ~(137)Cs mass balance model for assessment of recent deposition rates in Lake Qinghai. ~(137)Cs concentration peak at the depth of a few centimeters in the deposit profiles of Lake Qinghai and other lakes with lower deposition rates may be caused by the nuclide downward diffusion and migration progresses after the ~(137)Cs deposited on the surface of lake bottom mud. Therefore, the interpretation of the sediment layer at the ~(137)Cs peak depth depositing in 1963 and the calculation method of sediment deposition rates under that assumption may not be reasonable. Local ~(137)Cs reference inventory was 117.7mBq/cm~2 in 2005 obtained from grass land of the flat lakeside, ~(137)Cs inventories of the six lake sediment cores collected from the Island Hill of the center of Lake Qinghai to the Fish Port in the south-eastern lake ranged from 92.9mBq/cm~2to 325.0mBq/cm~2. It was clear that sediment deposition apparently occurred in the south-western part of the lake, particularly, the deposition is quite fast at the QHH02 Core position, which is located in the front of the underwater alluvial fan. However, sediment deposition was very slow at the centre part of the lake. The average ~(137)Cs concentration of the deposited sediments in Lake Qinghai since 1963 was estimated to be 30mBq/g by analyses of the ~(137)Cs concentrations from the lake mud in surface layers, the sediment discharged from inlet rivers, and the soil in surface layers on the grass land in the catchment. The average deposition rate in the centre of the lake was 0.020cm/a calculated by the ~(137)Cs mass balance model, which agreed to 0.018cm/a of the specific sediment yield of the Buha River, but much lower than the reported deposition rates estimated by conventional dating techniques. The deposition rate of the QHH02 Core was 0.229cm/a, suggesting that the deposition rates in the south-western part of the lake were much higher than the rates in the centre part of the lake and which was twice of the reported deposition rate of Lake Qinghai.
An attempt to use the 137Cs mass balance model for assessment of recent deposition rates in Lake Qinghai, China. [J].https://doi.org/10.18307/2009.0612 URL Magsci [本文引用: 1] 摘要
本文是~(137)Cs质量平衡法测算青海湖现代沉积速率的尝试.青海湖和其他低沉积速率湖泊沉积物剖面中,深度数cm处的~(137)Cs蓄积峰,也可能是沉降到底泥表面的~(137)Cs尘埃,以扩散和迁移的方式向下入渗形成.因此,将沉积剖面中的~(137)Cs蓄积峰解释为1963年的沉积,并据此计算沉积速率,未必合理.青海湖湖滨草地测得的2005年~(137)Cs本底值为1 17.7mBq/cm~2.湖泊中部海心山到东南部渔场一线的6个孔的~(137)Cs面积活度介于92.9-325.0mBq/cm~2,其中青海湖东南部两个孔的~(137)Cs面积活度较高,分别为本底值的155%和270%;湖泊中部4个孔的~(137)Cs面积活度略高于或低于本底值.显然,湖泊东南部有明显沉积发生,特别是位于江西沟冲积扇前缘水下部分的QHH02孔,沉积强烈,水深也最小;湖泊中部沉积轻微.根据表层底泥样品的~(137)Cs浓度,入湖河流泥沙的~(137)Cs浓度和流域内草地表层土壤~(137)Cs浓度的分析,初步确定C=30mBq/g,为1963年以来青海湖沉积泥沙的平均~(137)Cs浓度.利用~(137)Cs质量平衡模型求得的湖泊中部的平均沉积速率为0.020cm/a,和根据布哈河输沙模数求算出的青海湖平均沉积速率0.018cm/a吻合,远低于已报导的断代法测定的青海湖沉积速率.湖泊东南部的沉积速率大于湖泊中部,QHH02孔的沉积速率高达0.229cm/a,是已报导的青海湖沉积速率的两倍.<dt><strong><t>Abstract:</t></strong></dt><dd>This paper was an attempt to use the ~(137)Cs mass balance model for assessment of recent deposition rates in Lake Qinghai. ~(137)Cs concentration peak at the depth of a few centimeters in the deposit profiles of Lake Qinghai and other lakes with lower deposition rates may be caused by the nuclide downward diffusion and migration progresses after the ~(137)Cs deposited on the surface of lake bottom mud. Therefore, the interpretation of the sediment layer at the ~(137)Cs peak depth depositing in 1963 and the calculation method of sediment deposition rates under that assumption may not be reasonable. Local ~(137)Cs reference inventory was 117.7mBq/cm~2 in 2005 obtained from grass land of the flat lakeside, ~(137)Cs inventories of the six lake sediment cores collected from the Island Hill of the center of Lake Qinghai to the Fish Port in the south-eastern lake ranged from 92.9mBq/cm~2to 325.0mBq/cm~2. It was clear that sediment deposition apparently occurred in the south-western part of the lake, particularly, the deposition is quite fast at the QHH02 Core position, which is located in the front of the underwater alluvial fan. However, sediment deposition was very slow at the centre part of the lake. The average ~(137)Cs concentration of the deposited sediments in Lake Qinghai since 1963 was estimated to be 30mBq/g by analyses of the ~(137)Cs concentrations from the lake mud in surface layers, the sediment discharged from inlet rivers, and the soil in surface layers on the grass land in the catchment. The average deposition rate in the centre of the lake was 0.020cm/a calculated by the ~(137)Cs mass balance model, which agreed to 0.018cm/a of the specific sediment yield of the Buha River, but much lower than the reported deposition rates estimated by conventional dating techniques. The deposition rate of the QHH02 Core was 0.229cm/a, suggesting that the deposition rates in the south-western part of the lake were much higher than the rates in the centre part of the lake and which was twice of the reported deposition rate of Lake Qinghai.
|
| [30] |
青海湖现代沉积速率空间分布及沉积通量初步研究 [J].[本文引用: 1] 摘要
<p>考察了青海湖表层沉积物<sup>137</sup>Cs活度及通量时空分布, 建立了湖泊沉积速率空间分布模式. 青海湖河口/岸边区域沉积物<sup>137</sup>Cs通量高, 但平均<sup>137</sup>Cs活度低; 湖中心区域<sup>137</sup>Cs通量低但平均活度高. 河口/岸边区域沉积速率高, 沉积物陆源组分(如SiO<sub>2</sub>, Fe<sub>2</sub>O<sub>3</sub>, Ti等)的含量及通量高. 湖中心区域沉积速率低, 化学/生物沉积组分(如次生碳酸盐)含量高. 因此, 决定青海湖沉积速率空间分布的主要因素是流域陆源物质的堆积速率. 根据本文获得的不同湖区沉积速率计算了青海湖平均质量堆积速率(0.0337 g•cm<sup>−2</sup>•a<sup>−1</sup>), 并用Ca质量平衡方法检验了该平均值的合理性. 在此基础上, 估算了青海湖沉积通量及流域泥沙输入和大气粉尘对湖泊沉积的贡献.</p>
Spatial pattern of modern sedimentation rate of Qinghai Lake and a preliminary estimate of the sediment flux .[本文引用: 1] 摘要
<p>考察了青海湖表层沉积物<sup>137</sup>Cs活度及通量时空分布, 建立了湖泊沉积速率空间分布模式. 青海湖河口/岸边区域沉积物<sup>137</sup>Cs通量高, 但平均<sup>137</sup>Cs活度低; 湖中心区域<sup>137</sup>Cs通量低但平均活度高. 河口/岸边区域沉积速率高, 沉积物陆源组分(如SiO<sub>2</sub>, Fe<sub>2</sub>O<sub>3</sub>, Ti等)的含量及通量高. 湖中心区域沉积速率低, 化学/生物沉积组分(如次生碳酸盐)含量高. 因此, 决定青海湖沉积速率空间分布的主要因素是流域陆源物质的堆积速率. 根据本文获得的不同湖区沉积速率计算了青海湖平均质量堆积速率(0.0337 g•cm<sup>−2</sup>•a<sup>−1</sup>), 并用Ca质量平衡方法检验了该平均值的合理性. 在此基础上, 估算了青海湖沉积通量及流域泥沙输入和大气粉尘对湖泊沉积的贡献.</p>
|
| [31] |
Recent lake sedimentation in the middle and lower Yangtze basin inferred from 137Cs and 210Pb measurements [J].https://doi.org/10.1016/S1367-9120(02)00015-9 URL [本文引用: 2] 摘要
The reduction of water storage capacity in the lakes of the Yangtze basin was an important factor for the disastrous 1998 flooding. This study attempted to quantify sedimentation and its role in the water storage reduction in the middle and lower reaches of the Yangtze basin using the radionuclide of caesium-137 ( 137Cs) and lead-210 ( 210Pb) as tracers. Sixteen cores were taken from eight lakes, including the two largest lakes in the region (Poyanghu and Dongtinghu). The two dating techniques were used in combination to quantify recent sediment accumulation rates and their changes over the last few decades. The 137Cs and 210Pb measurements indicated higher sedimentation rates for Dongtinghu which were consistent with observed severe reduction of water storage capacity. The inferred sedimentation rates for the remaining lakes were lower and did not reflect the perceived rate of severe soil erosion upstream or the substantial water storage reduction. The low sedimentation rates inferred for most lakes tentatively suggest that sediment deposition was not the primary reason for the observed reduction in water storage capacity. Nevertheless, a clear increasing trend in sedimentation rates has been documented for most of the studied lakes over the past few decades. Sedimentation and its role in water storage reduction require further study due to the many problems associated with its quantification such as the post-depositional redistribution of sediments and water exchanges between the Yangtze river and the studied lakes.
|
| [32] |
Activities and geochronology of 137Cs in lake sediments resulting from sediment resuspension [J].https://doi.org/10.1016/j.jenvrad.2016.11.015 URL [本文引用: 2] 摘要
In lakes with a large surface area to watershed ratio 137 Cs delivery is primarily by direct atmospheric fallout to the lake surface, where its activity in the sediments has been used to estimate the exposure to organisms and sediment mass deposition rates. Comparison of 137 Cs in the historical atmospheric fallout record with 137 Cs activity profiles in sediment cores reveals that although the general features of a maxima in the fallout deposition can be matched to activity peaks in the core, the general shape of the 137 Cs profile is not an exact replica of the fallout history. Instead, the sediment reflects post-depositional processes such as resuspension, bioturbation, partitioning of 137 Cs between the sediment solids and the pore fluids, and molecular diffusion of 137 Cs through the pore fluids. Presented here is a model that couples these processes to a system time averaging (STA) model that accounts for the time history of 137 Cs fallout and the particle residence time in the water column or in the ctive surface sediment subject to resuspension. Sediment profiles are examined by comparing reasonable ranges of each of the coefficients of each of these major processes and by applying the model to cores collected from two large, shallow lakes, Lake Erie (USA/Canada) and Lake Winnipeg (Canada). The results indicate that the STA model with molecular diffusion and sediment resuspension best describes the data from these large, shallow lakes.
|
| [33] |
现代沉积年分辨的137Cs计年——以云南洱海和贵州红枫湖为例 [J].https://doi.org/10.1088/0256-307X/15/12/024 URL Magsci [本文引用: 2] 摘要
<p>1964,1975及1986年三个<sup>137</sup>CS时标计算出红枫湖和洱海沉积物平均堆积速率完全一致,说明1975年和1986年次级蓄积峰作为计年时标的可靠性。洱海沉积物平均堆积速率为0.047±0.002g/(cm<sup>2</sup>·a),与<sup>210</sup>Pb方法所获得的结果一致;红枫湖为0.17±0.01g/(cm<sup>2</sup>·a),与其建湖以来沉积物实际堆积的观察结果吻合。洱海1964年沉积物中<sup>137</sup>CS的比活度(校正到沉积年代)仅46.4Bq/kg,而红枫湖达145Bq/kg。由于红枫湖沉积物堆积速率约为洱海的3.7倍,所以其1964年层节沉积物中<sup>137</sup>CS蓄积量比洱海大11.5倍。红枫湖沉积物中<sup>137</sup>CS累计值的99.4%分配于1985年以前,而洱海的19.4%分配于1986年以后,显示出<sup>137</sup>CS在洱海沉积物中的较大扩散能力。</p>
137Cs dating by annual distinguishes for recent sedimentation: Samples from Ehai lake and Hngfeng lake [J].https://doi.org/10.1088/0256-307X/15/12/024 URL Magsci [本文引用: 2] 摘要
<p>1964,1975及1986年三个<sup>137</sup>CS时标计算出红枫湖和洱海沉积物平均堆积速率完全一致,说明1975年和1986年次级蓄积峰作为计年时标的可靠性。洱海沉积物平均堆积速率为0.047±0.002g/(cm<sup>2</sup>·a),与<sup>210</sup>Pb方法所获得的结果一致;红枫湖为0.17±0.01g/(cm<sup>2</sup>·a),与其建湖以来沉积物实际堆积的观察结果吻合。洱海1964年沉积物中<sup>137</sup>CS的比活度(校正到沉积年代)仅46.4Bq/kg,而红枫湖达145Bq/kg。由于红枫湖沉积物堆积速率约为洱海的3.7倍,所以其1964年层节沉积物中<sup>137</sup>CS蓄积量比洱海大11.5倍。红枫湖沉积物中<sup>137</sup>CS累计值的99.4%分配于1985年以前,而洱海的19.4%分配于1986年以后,显示出<sup>137</sup>CS在洱海沉积物中的较大扩散能力。</p>
|
| [34] |
有关湖泊沉积137Cs 深度分布资料解译的探讨 .Discussion on interpretations of 137Cs depth distribution profiles of lake deposits . |
| [35] |
137Cs 在滇西与黔中地区散落的差异——青藏隆起对滇西地区全球性扩散大气污染物散落屏蔽效应的推断 [J].https://doi.org/10.3321/j.issn:1001-7410.2001.05.004 URL Magsci [本文引用: 1] 摘要
<p>云贵高原是青藏隆起在南亚大陆形成的一个海拔梯度大、地势格局复杂的特异环境单元。该地域兼受东南季风与西南季风的交汇影响 ,是全球变化的敏感区之一。青藏隆起对云贵高原现代环境影响主要表现在 :1 )全球性大气扩散污染物的屏蔽效应和局地性大气扩散污染物的滞留效应 ;2 )区域化学风化的增强效应和物理侵蚀的梯级效应 ;3)地表环境地球化学过程的低纬度 -高海拔效应。核素示踪模式分析表明 :滇西与黔中地区之间<sup>137</sup>Cs自大气散落差异明显 [1 986年以前 ,洱海和红枫湖沉积物中<sup>137</sup>Cs散落的累计值分别为 ( 0 .1 1±0 .0 1 )Bq cm<sup>2</sup> 及 ( 0 .37± 0 .0 1 )Bq cm<sup>2</sup> ],而<sup>7</sup>Be的散落相近。这说明青藏隆起对滇西地区存在全球性扩散大气污染物散落的屏蔽效应.</p>
The differentials of fallout 137Cs Between western Yunnan and central Guizhou: Implication for the barrier erect of Qinghai-xizang uplift on global atmospheric pollutants in Yunan-Guizhou plateau .https://doi.org/10.3321/j.issn:1001-7410.2001.05.004 URL Magsci [本文引用: 1] 摘要
<p>云贵高原是青藏隆起在南亚大陆形成的一个海拔梯度大、地势格局复杂的特异环境单元。该地域兼受东南季风与西南季风的交汇影响 ,是全球变化的敏感区之一。青藏隆起对云贵高原现代环境影响主要表现在 :1 )全球性大气扩散污染物的屏蔽效应和局地性大气扩散污染物的滞留效应 ;2 )区域化学风化的增强效应和物理侵蚀的梯级效应 ;3)地表环境地球化学过程的低纬度 -高海拔效应。核素示踪模式分析表明 :滇西与黔中地区之间<sup>137</sup>Cs自大气散落差异明显 [1 986年以前 ,洱海和红枫湖沉积物中<sup>137</sup>Cs散落的累计值分别为 ( 0 .1 1±0 .0 1 )Bq cm<sup>2</sup> 及 ( 0 .37± 0 .0 1 )Bq cm<sup>2</sup> ],而<sup>7</sup>Be的散落相近。这说明青藏隆起对滇西地区存在全球性扩散大气污染物散落的屏蔽效应.</p>
|
| [36] |
中国湖泊现状及面临的重大问题与保护策略 [J].https://doi.org/10.18307/2010.0601 URL [本文引用: 1] 摘要
我国湖泊数量多、类型全、分布广,湖泊的形成演化不仅受流域自然环境因素及变化的影响,而且还深受人类活动的干扰,呈现出不同的区域演变特征和生态环境问题.近几十年来,我国湖泊数量、面积和分布都发生了较为显著的变化,并面临着湖泊萎缩与调蓄能力减少、水质下降与富营养化加重、生物多样性减少与生态退化、河湖水力和生态联系阻隔以及湖岸线和环湖地带过度开发等问题,引发一系列生态与环境后果,严重影响流域居民日常生活和经济的可持续发展.本文通过大量湖泊野外考察和调查,查清了我国面积大于1km2湖泊的数量、面积和分布状况,结合历史湖泊调查和相关研究资料,系统分析了近几十年我国湖泊面临的重大生态环境问题及区域特征,提出了我国湖泊保护的策略.
Lake status, major problems and protection strategy in China .https://doi.org/10.18307/2010.0601 URL [本文引用: 1] 摘要
我国湖泊数量多、类型全、分布广,湖泊的形成演化不仅受流域自然环境因素及变化的影响,而且还深受人类活动的干扰,呈现出不同的区域演变特征和生态环境问题.近几十年来,我国湖泊数量、面积和分布都发生了较为显著的变化,并面临着湖泊萎缩与调蓄能力减少、水质下降与富营养化加重、生物多样性减少与生态退化、河湖水力和生态联系阻隔以及湖岸线和环湖地带过度开发等问题,引发一系列生态与环境后果,严重影响流域居民日常生活和经济的可持续发展.本文通过大量湖泊野外考察和调查,查清了我国面积大于1km2湖泊的数量、面积和分布状况,结合历史湖泊调查和相关研究资料,系统分析了近几十年我国湖泊面临的重大生态环境问题及区域特征,提出了我国湖泊保护的策略.
|
| [37] |
Evaluating the mobility of 137Cs, 239+240Pu and 210Pb from their distributions in laminated lake sediments [J].https://doi.org/10.1007/BF00678102 URL [本文引用: 2] 摘要
Post-depositional mobility of 137 Cs, 239+240 Pu and 210 Pb was assessed in six small lake basins by comparing sedimentary nuclide profiles with their known fallout history. Laminae couplets, when present, were determined to be varves because the 137 Cs and 239+240 Pu 1963 fallout peaks are present in laminae couplets corresponding to years 1962–1964. There is no evidence of mobility of 210 Pb, because 1) mass accumulation rates based on 210 Pb agree with those based on 137 Cs and 239+240 Pu peak depths and with those based on varve counts, and 2) 210 Pb ages agree with varve ages. Significant mobility of 137 Cs is evident from the penetration of 137 Cs to depths 15–20 cm deeper than 239+240 Pu. Deep penetration of 137 Cs in spite of a sharp gradient below the peak is interpreted by a numerical model to suggest that 137 Cs is present in two distinct forms in these sediments, 67–82% as an immobile form and 18–33% reversibly adsorbed with a K d of approximately 5000. The profiles can be interpreted equally well assuming a small portionof the total 137 Cs was present as an extremely mobile phase (K d 615000) in the months to years following peak fallout, slowly becoming more strongly adsorbed. High NH 4 + concentrations in porewaters may enhance diffusion of the mobile form of 137 Cs, but not of the immobile form of 137 Cs that defines the sharp gradient. Mobility of 137 Cs is likely also enhanced by the low clay content and the high porosity of these sediments. Thus the first detection of 137 Cs in the sediments cannot automatically be assumed to correspond to a date of 1952 (initial testing of thermonuclear weapons), although the depth of the peak can be assumed to correspond to 1963 (the year of maximum fallout from testing of thermonuclear weapons). 239+240 Pu is a more reliable sediment chronometer than 137 Cs because it is significantly less mobile.
|
| [38] |
Sediment focusing in six small lakes inferred from radionuclide profiles [J].https://doi.org/10.1007/BF00678103 URL [本文引用: 2] 摘要
Sediment focusing in six small lake basins is inferred from sedimentary radionuclide profiles. The activities of 137 Cs and 9+240 Pu do not decrease to zero above the sub-surface maximum but tail off gradually. Similar behavior is observed in the sediments of three lakes for 134 Cs and 60 Co, which were added only to the lake. This upward tailing is not caused by bioturbation or erosion from the watershed. Sediment focusing is the likely cause, further substantiated by inventories in deep sediments of 9+240 Pu and 210 Pb that are twice as high as expected from atmospheric fallout. Inventories in deep sediments of 137 Cs are in several cases lower than expected from atmospheric fallout, and cannot be explained by hydraulic flushing from the lakes, as this would require unreasonable flushing rates. The low 137 Cs inventories and the sedimentary profiles of the 137 Cs/ 9+240 Pu ratio are consistent with 137 Cs removal from the water column by boundary scavenging to shallow sediments. The profiles and inventories of all three nuclides could be reproduced with a simple three box model, assuming focusing of shallow sediments (50–60% of total sediment area) to deep sediments with a rate constant of 5–10% yr 611 .
|
| [39] |
137Cs, 239,240Pu and 241Am in bottom sediments and surface water of Lake Paeijaenne, Finland [J].https://doi.org/10.1016/j.jenvrad.2009.03.006 URL PMID: 19362758 [本文引用: 3] 摘要
The concentrations and vertical distribution of 239,240 Pu, 241 Am and 137 Cs in the bottom sediments and water samples of Lake P01ij01nne were investigated. This lake is important, since the P01ij01nne area received a significant deposition from the Chernobyl fallout. Furthermore Lake P01ij01nne is the raw water source for the Helsinki metropolitan area. In addition no previous data on the distribution of plutonium and americium in the sediment profiles of Lake P01ij01nne exist. Only data covering the surface layer (0–102cm) of the sediments are previously available. In the sediments the average total activities were 4502±021502Bq/m 2 and 2002±02702Bq/m 2 for 239,240 Pu and 241 Am, respectively. The average 241 Am/ 239,240 Pu ratio was 0.4502±020.14. The 241 Am/ 239,240 Pu ratio is lowest in the surface layer of the sediments and increases as a function of depth. The 238 Pu/ 239,240 Pu ratio of the sediment samples varied between 0.01202±020.025 and 0.16202±020.079, decreasing as a function of depth. The average activity in water was 4.902±020.902mBq/m 3 and 4.102±020.202mBq/m 3 for 239,240 Pu and 241 Am, respectively. The 241 Am/ 239,240 Pu ratio of water samples was 0.8202±020.17. 239,240 Pu originating from the Chernobyl fallout calculated from the average total activities covers approximately 1.9502±020.01% of the total 239,240 Pu activity in the bottom sediments. The average total 137 Cs activity of sediment profiles was 10002±021502kBq/m 2 and 19.302±021.402Bq/m 3 in water samples.
|
| [40] |
Coupling between 210Pbex and organic matter in sediments of a nutrient-enriched lake: An example from Lake Chenghai, China [J].https://doi.org/10.1016/j.chemgeo.2005.07.025 URL [本文引用: 3] 摘要
Sediment cores were collected from deep-water areas of Lake Chenghai, China in June 1997. The vertical profile of 137Cs activity gives reliable geochronological results. The results also indicate that sediment accumulation rates in deep-water areas of Lake Chenghai were relatively constant in recent decades, averaging 0.43 g cm 61 2 y 61 1, despite a variable organic carbon influx. 210Pb eq (= 226Ra) activity was relatively constant also, with an average value of 54.3 ± 3.2 Bq kg 61 1. Vertical profiles of 210Pb ex (= 210Pb total 61 226Ra) decreased exponentially, resulting in somewhat lower sediment accumulation rates (0.3 g cm 61 2 y 61 1). These lower rates are likely less reliable, as the relatively large fluctuations in 210Pb ex activities correlate closely to the organic carbon (C org) content of the sediments. For example, the vertical profile of 210Pb ex activity displays peaks at mass depths of 3.7–4.7 g cm 61 2 (10–12 cm) and 10–11 g cm 61 2(25–28 cm), similar to the maxima in the vertical profile of C org. This phenomenon must be related to the delivery of particulate organic matter (POM) from the water to the sediments, or to watershed soil erosion. Since the mean atomic ratios of H org / C org and C org / N org in Lake Chenghai sediments are 5.5 and 7.0, respectively, indicating that POM was predominantly derived from the remains of authigenic algae, this eliminates watershed erosion rates as a primary control on lake sedimentation rates as resolved by 210Pb ex. Sedimentation fluxes ( F(C org)) of particulate organic carbon since 1970 varied between 60 to 160 g m 61 2 y 61 1, and appeared to closely influence variations in 210Pb ex concentrations. For example, sedimentation fluxes of 210Pb ex (F( 210Pb ex)) showed maxima in the years 1972–1974 and 1986–1989, likely reflecting historical variations of lake biological productivity or carbon preservation.
|
| [41] |
Analysis of the 50-year records of the atmospheric deposition of long-lived radionuclides in Japan [J].https://doi.org/10.1016/j.apradiso.2007.09.019 URL PMID: 18502651 [本文引用: 2] 摘要
Long-lived anthropogenic radionuclides ( 137 Cs, 90 Sr, and Pu isotopes) have been determined in monthly atmospheric deposition samples collected in Japan since 1956. The maximum annual deposition occurred in 1963 after the large-scale atmospheric nuclear weapons testing of 1961 1962. In the 1980s, the fallout from the Chinese nuclear weapons tests was observed and the released radionuclides from the Chernobyl accident affected radioactive deposition in Japan until the early 1990s. Recently, the deposition rates have been boosted by the resuspension of radionuclides in deposited particles, the 239,240 Pu content of which may originate from dusts from the East Asian continent deserts and arid areas.
|
| [42] |
Pu同位素比值在沉积物测年中的应用 [J].Pu isotope ratios as the geochronometer for sediments . |
| [43] |
用137Cs计年法确定湖泊沉积物沉积速率研究进展 [J].https://doi.org/10.3321/j.issn:1001-8166.2005.06.011 URL Magsci [本文引用: 1] 摘要
<p><sup>137</sup>Cs计年法利用<sup>137</sup>Cs固有的理化和沉降特性,在湖泊沉积物的<sup>137</sup>Cs垂直分布与大气137Cs沉降间确立对应关系,找出有异常<sup>137</sup>Cs含量的沉积层作为时标,但需注意<sup>137</sup>Cs从水体表面至湖底的时间和粘粒含量对各层<sup>137</sup>Cs含量的影响,并用其它方法校验时标的可靠性。再求取不同时标层间的年均沉积厚度,或因克服了压实效应而更能反映真实沉积速率的年均沉积通量,且结合GIS等手段进一步估算湖泊各区域的沉积总量;还可延伸研究湖泊内源污染负荷及相关环境演变和湖泊演化。但是,沉积柱样的分割厚度取多少才能既满足计年精度要求又不使工作量过大,<sup>137</sup>Cs的大气沉降时间与进入沉积物时间还与泥沙的陆地迁移时间有关,沉积物中究竟是否发生<sup>137</sup>Cs下渗及其机理等都还是此法应用中有待解决的问题。</p>
An overview on the evaluation of sediment accumulation rate of lake by 137Cs dating .https://doi.org/10.3321/j.issn:1001-8166.2005.06.011 URL Magsci [本文引用: 1] 摘要
<p><sup>137</sup>Cs计年法利用<sup>137</sup>Cs固有的理化和沉降特性,在湖泊沉积物的<sup>137</sup>Cs垂直分布与大气137Cs沉降间确立对应关系,找出有异常<sup>137</sup>Cs含量的沉积层作为时标,但需注意<sup>137</sup>Cs从水体表面至湖底的时间和粘粒含量对各层<sup>137</sup>Cs含量的影响,并用其它方法校验时标的可靠性。再求取不同时标层间的年均沉积厚度,或因克服了压实效应而更能反映真实沉积速率的年均沉积通量,且结合GIS等手段进一步估算湖泊各区域的沉积总量;还可延伸研究湖泊内源污染负荷及相关环境演变和湖泊演化。但是,沉积柱样的分割厚度取多少才能既满足计年精度要求又不使工作量过大,<sup>137</sup>Cs的大气沉降时间与进入沉积物时间还与泥沙的陆地迁移时间有关,沉积物中究竟是否发生<sup>137</sup>Cs下渗及其机理等都还是此法应用中有待解决的问题。</p>
|
| [44] |
Plutonium as a chronomarker in Australian and New Zealand sediments: a comparison with 137Cs [J].https://doi.org/10.1016/j.jenvrad.2009.09.008 URL PMID: 19857913 [本文引用: 1] 摘要
This paper shows examples of the use of nuclear weapons fallout Pu as a chronomarker in sediment cores from Australia (3 sites) and New Zealand (1 site). The Pu profiles of five cores are examined and compared with the corresponding 137 Cs profiles and 210 Pb geochronologies. We find that Pu has significant advantages over 137 Cs, including greater measurement sensitivity using alpha spectrometry and mass spectrometric techniques compared to 137 Cs measurements by gamma spectrometry. Moreover, Pu provides additional chronomarkers associated with changes in the Pu isotopic composition of fallout during the 1950s and 1960s. In particular, the 238 Pu/ 239+240 Pu activity ratio shows distinct shifts in the early 1950s and the mid to late 1960s, providing important known-age horizons in southern hemisphere sediments. For estuarine and near-shore sediments Pu sometimes has another significant advantage over 137 Cs due to its enrichment in bottom sediment relative to 137 Cs resulting from the more efficient scavenging of dissolved Pu in seawater by sediment particles.
|
| [45] |
Plutonium, 137Cs and U in some pond and lake sediments from areas surrounding the Semipalatinsk Nuclear Test Site: With emphasis on anomalously high U accumulation [J].https://doi.org/10.1007/s10967-004-0483-x URL [本文引用: 1] |
| [46] |
Distribution of Puisotopes in marine sediments in the Pacific 30 km off Fukushima after the Fukushima Daiichi nuclear power plant accident [J].https://doi.org/10.1016/j.chemer.2011.08.001 URL [本文引用: 1] 摘要
The Fukushima Dai-ichi Nuclear Power Plant (DNPP) accident has caused serious contamination of the marine environment from atmospheric fallout deposition and the direct discharges of highly radioactive liquid wastes. In contrast to the immediate intensive studies on the distributions of released fission products, such as I, Cs and Cs, information on the possible contamination by actinides in the marine environment is quite limited. In this study, we report the first data-set on the distribution of Pu isotopes in surface sediments in the Pacific 30 km off Fukushima after the Fukushima DNPP accident. Activities of Pu and Pu, and atom ratios of Pu/Pu and Pu/Pu in surface sediments collected in July-August, 2011 were analyzed to make a quick assessment on the environmental impact of the possible Pu contamination. The observed Pu activities and Pu/Pu atom ratios are comparable to those previously reported in marine sediments in the western North Pacific and its marginal seas, and in Japanese estuaries before the accident. The Pu contamination from the Fukushima DNPP accident was not observed in marine sediments outside the 30 km zone. (author)
|

/
| 〈 |
|
〉 |

