高文兰 , 李双双, 段克勤
Gao Wenlan, Li Shuangshuang, Duan Keqin
中图分类号: P468.0+21
文献标识码: A
文章编号: 1000-0690(2018)03-0464-10
通讯作者:
收稿日期: 2017-03-23
修回日期: 2017-05-20
网络出版日期: 2018-03-21
版权声明: 2018 《地理科学》编辑部 本文是开放获取期刊文献,在以下情况下可以自由使用:学术研究、学术交流、科研教学等,但不允许用于商业目的.
基金资助:
作者简介:
作者简介:高文兰(1985-),女,山西忻州人,博士研究生,主要从事全球变化与极端天气事件研究。E-mail: gaowenlan1@126.com
展开
摘要
基于1960~2015年西安气象站点逐日最高温、最低温数据,采用RHtest软件对非均一化气温序列进行订正,进而选取16项极端气温指数,对西安极端气温变化特征进行分析。结果表明:① 由于气象站点迁移,西安气温资料存在非均一性,导致极端气温变化趋势被低估;② 全球变暖背景下,西安极端气温变化表现出:“快速增温与平稳波动并存,冷暖变化趋势相反,夜晚增暖趋势比白天明显,白天波动变化明显于夜晚,持续性高温事件变化不大,持续性低温事件大幅下降”的变化特征;③ 通过不同区域趋势变化对比、冷暖、昼夜变化关系对比发现,受城市热岛影响,西安极端低温事件减少更为突出,远高于中国其他对比区域(秦岭南北、黄土高原、东北地区等);④ 在昼夜变化上,西安极端气温变化与中国、全球变化具有一致性,但是通过冷暖指标对比发现,西安极端气温变化具有区域性,表现为冷昼日数下降高于暖昼日数上升,冷夜日数下降高于暖夜日数上升,冷持续日数和暖持续日数共同表现为下降趋势。
关键词:
Abstract
Based on daily maximum and minimum temperatures observed by the China Meteorological Administration at the Xi’an meteorological station during the period 1960-2015, the series exhibiting breakpoints are adjusted using RH test software. Temporal trends of 16 extreme temperature indices are evaluated by least-squares linear regression and moving average methods; the linear trends are significant for 11 of these 16 indices. The trends of extreme temperature indices for Xi’an, China, the globe, and other regions in China are compared. Further, trends of the relative magnitudes of cold versus warm indices and day versus night indices are compared. The results are as follows: 1) Due to the migration of the meteorological station, the value of the temperature series is lower than the original meteorological station data. The warming trends of extreme temperatures are underestimated based on the in-homogeneity dataset. 2) In the context of global warming, extreme temperature variation presents its own characteristics in Xi’an. First, the extreme temperature trends show rapid warming with stable fluctuation, but the opposite trends occur in warm and cold indices; warm indices increase while cold indices decrease. Second, the warming trends are faster during the nighttime than the daytime, whereas the amplitudes of fluctuations are greater during the daytime than the nighttime. Third, warm spell events increase slowly, but cold spell events decrease rapidly. 3) Extreme temperature indices are compared between Xi’an and other regions (the southern and northern regions of the Qinling Mountains, the Loess Plateau, northeast China, etc.). Due to the impact of the urban heat island phenomenon, the decrease of extreme low temperature events is more pronounced in Xi’an than in the other regions compared. 4) With regard to daytime versus nighttime indices, the nighttime indices in all regions show the characteristic of warming faster than the daytime indices. In the case of cold versus warm indices, Xi’an exhibits its regional features: the warming magnitude is faster on cold days than on warm days, and a similar trend is seen on cold nights and warm nights; indices of cold and warm spell durations show a downward trend. Overall, this study indicates that the trends of temperature extremes in Xi’an are in accordance with global warming during 1960-2015.
Keywords:
在全球尺度上,70%地区极端气温事件呈现昼夜增温的不对称性[1];欧洲、美国东部、大洋洲等地区极端气温事件也呈现不断增加的趋势[2,3,4]。在中国,许多学者针对不同地理区域极端气温时空变化进行研究,指出黄土高原[5]、长江流域[6]、珠江流域[7]、中国沿海[8]极端气温呈现冷指数下降,暖指数上升的变化趋势,高纬度地区变幅更为明显[9];从冷暖指标角度分析,发现中国不同区域极端气温变化具有“冷暖不对称、季节不同步、昼夜不对称”的特征[10]。此外,不同省市极端气温的研究也逐渐增多[11,12,13]。由于气候背景、区域特征、驱动力等存在差异,不同区域极端气温的变化特征往往不同;加之,快速城市化的影响,许多气象站点均出现迁址、观测仪器、统计规则和方法等变更的情况,导致观测序列存在系统性偏差[14]。利用非均一化数据,分析城市地区极端气温变化,会低估或得出错误的结论[15]。
西安城市规模不断扩大,使得城市气候发生明显变化。在已有研究中,许多学者综合气象和遥感数据,对西安热岛效应的时空演变、形成机制进行研究[16],揭示了经济发展、人口增长、能源消耗等因素对热岛强度的贡献程度[17],且以景观生态格局、冬季供暖能耗、城市雾霾日数变化为切入,分析气候变暖对生态环境、居民生活的影响[18,19,20]。值得一提的是,西安快速城市化,加强了热岛效应,使原设立在北郊气象站的周边环境发生变化,不再满足本地气候观测要求。在2006年,西安气象观测站迁至泾河工业园区,承担国家基准气候站观测任务。迁站导致气象数据存在非均一性,使得相关研究呈现2种态势:① 在区域尺度分析时,放弃西安站,仅选择气候资料连续的站点进行研究[21];② 在城市尺度分析时,衔接新旧资料,不关注气候资料非均一化影响[22]。基于非均一化的观测资料,会导致西安极端气温变化研究结论存在不确定性,甚至隐瞒真实的气候变化趋势[14]。
基于此,本文首先对气象站点迁移导致的气温数据的不连续点进行检测,并对气温数据进行均一性订正;然后选取气候变化检测、监测和指标专家组(ETCCDMI)推荐的16项极端气温指标,对1960~2015年西安极端气温变化趋势进行分析;通过均一化前后趋势对比,中国不同区域趋势变化对比,分析前期研究结论的不确定性,说明西安极端气温变化的特殊性,以期为区域适应、减缓和应对气候变化提供理论支持。
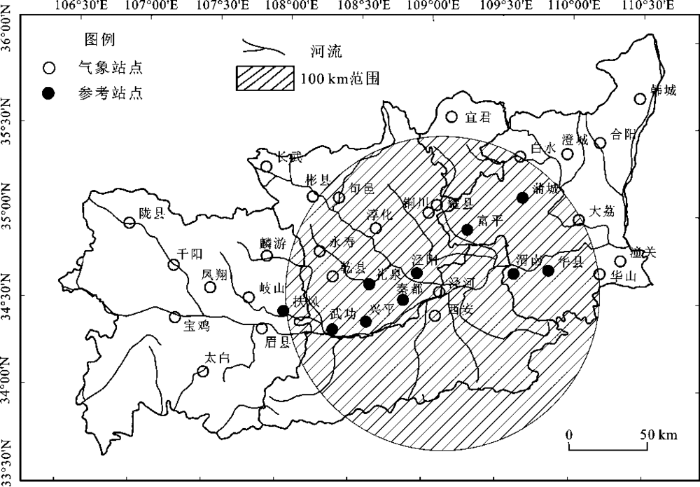
本文气象数据来源于国家气候中心和陕西省气象局,数据经过严格的质量控制;除礼泉、泾阳缺测数据低于0.5%外,其他33个站点数据缺测率较低。在此,对个别台站缺测资料进行插补处理,经补插后的台站数据具有较好的连续性和完整性(图1)。
1.2.1 极端气温指数定义
本文极端气温指数采用气候变化检测、监测和指标专家组(ETCCDMI)推荐的16项极端气温指数(表1),已被广泛应用于极端气候事件的研究。
表1 极端气温指数定义
Table 1 The definition of extreme temperature indices
| 分类 | 缩写 | 极端气温指数 | 定义 | 单位 |
|---|---|---|---|---|
| 绝对指数 | SU | 夏季日数 | 年内日最高温>25℃的日数 | d |
| TR | 热夜日数 | 年内日最低温>20℃的日数 | d | |
| ID | 冰冻日数 | 年内日最高温<0℃的日数 | d | |
| FD | 霜冻日数 | 年内日最低温<0℃的日数 | d | |
| 相对指数 | TX90 | 暖昼日数 | 年日最高温>1971~2000年第90个百分位值的日数 | d |
| TX10 | 冷昼日数 | 年日最高温<1971~2000年第10个百分位值的日数 | d | |
| TN90 | 暖夜日数 | 年日最低温>1971~2000年第90个百分位值的日数 | d | |
| TN10 | 冷夜日数 | 年日最低温<1971~2000年第10个百分位值的日数 | d | |
| 极值指数 | TXx | 最高温极高值 | 年日最高温的最大值 | ℃ |
| TXn | 最高温极低值 | 年日最高温的最小值 | ℃ | |
| TNx | 最低温极高值 | 年日最低温的最大值 | ℃ | |
| TNn | 最低温极低值 | 年日最低温的最小值 | ℃ | |
| 持续指数 | WSDI | 暖持续日数 | 年日最高温>1971~2000年第90个百分位值的连续6 d日数 | d |
| CSDI | 冷持续日数 | 年日最低温<1971~2000年第10个百分位值的连续6 d日数 | d | |
| DTR | 气温日较差 | 年内日最高温与最低温差值 | ℃ | |
| GSL | 生物生长季 | 首次气温连续6 d>5℃与首次连续6 d<5℃间隔的日数 | d |
1.2.2 RHtest均一性检验
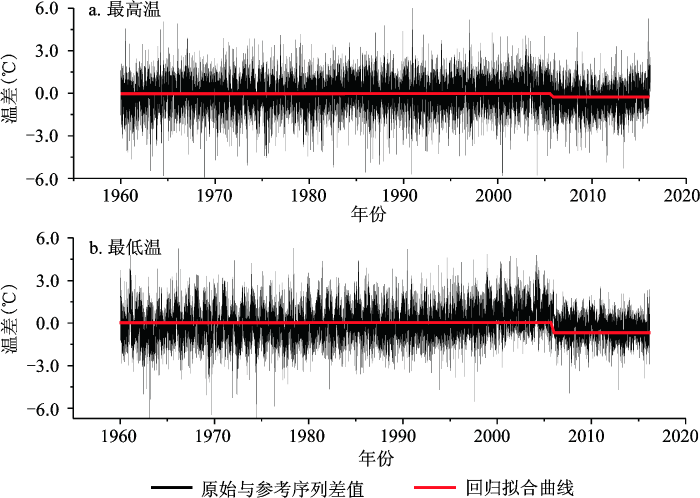
2006年,西安气象站由未央路(现为市区)迁至泾河工业园(现为郊区),由于城市热岛效应,泾河站气温低于原观测站(图2)。采用RHtests v4软件,对西安气温数据进行均一性检验及订正。在参考站点选择方面,依据关中地区35个台站资料,以距离泾河站<100 km、高差<200 m为标准,选取周边地区10个候选参考站(图1)。以此为基础,选择相关系数r>0.80的渭南和蒲城2站,利用相关系数加权法构建参考序列。
图2 1960~2015年泾河站日最高、最低温均一化检验结果
Fig.2 Homogeneity assessment results for daily maximum and minimum temperature in Jinghe station during 1960-2015
西安年均最高、最低温订正前后曲线交点均出现在2006年,说明2006年气象站点迁移是西安气温非均一化的主要原因。1960~2015年西安年均最高、最低温分别为19.6℃、9.6℃,订正后分别为19.3℃、9.3℃,订正后2006年之前气温均有所下降(图3)。
图3 1960~2015年西安均一化订正前后气温序列
Fig.3 Temperature series before and after homogenization in Xi’an during 1960-2015
1) 在趋势变化上,1960~2015年西安原始序列和订正序列年均最高温、最低温呈现显著的上升趋势(P<0.05)。其中,原始序列年均最高温、最低温增温速率分别为0.19℃/10a、0.48℃/10a,订正后分别为0.25℃/10a、0.54℃/10a,订正后增温幅度有所上升,最低温(夜间)增温速率高于最高温(白天)。
2) 在年代变化上,1960~2015年西安最高温变化可分为3个阶段:1960~1985年为波动下降期,1986~2002年为快速上升期,2003~2015年为先降后升期;与最高温相比,最低温变化略有差异,主要体现在第1阶段(1960~1985年),最低温呈现先下降后缓慢上升,并未呈现明显的波动下降。
2.2.1 绝对指数变化特征
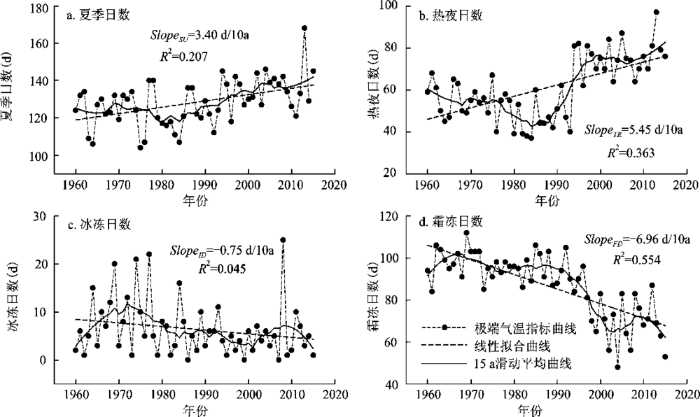
1960~2015年西安夏季日数和热夜日数呈现显著的上升趋势,变化速率分别为3.40 d/10a和5.45 d/10a,两者线性拟合趋势均通过0.01显著水平检验(图4)。对于冷指标而言,衡量白天寒冷程度的冰冻日数,呈现不显著的下降趋势(-0.75 d/10a);衡量夜间寒冷程度的霜冻日数,呈现明显的下降趋势(-6.96 d/10a)。说明西安夏季日数不断增加,夜晚炎热程度不断增强,白天寒冷程度减弱较小,夜间寒冷程度明显下降,无霜期不断增加。
图4 1960~2015年西安极端气温绝对指数年际变化趋势
Fig.4 Linear trend in absolute indices of annual extreme temperature events in Xi’an during 1960-2015
在变化过程上,西安绝对指数变化主要特征表现为:快速增温与平稳波动并存,冷暖变化趋势相反。其中,① 20世纪60年代到80年代中期,夏季日数平稳波动后略有下降,冰冻日数先上升后下降;热夜日数持续下降、霜冻日数则平稳波动;② 20世纪80年代末到21世纪初,夏季日数快速增长,冰冻日数则维持平稳波动;热夜日数先快速增长后维持高位波动,而霜冻日数则先快速下降后维持低位波动。
2.2.2 相对指数变化特征
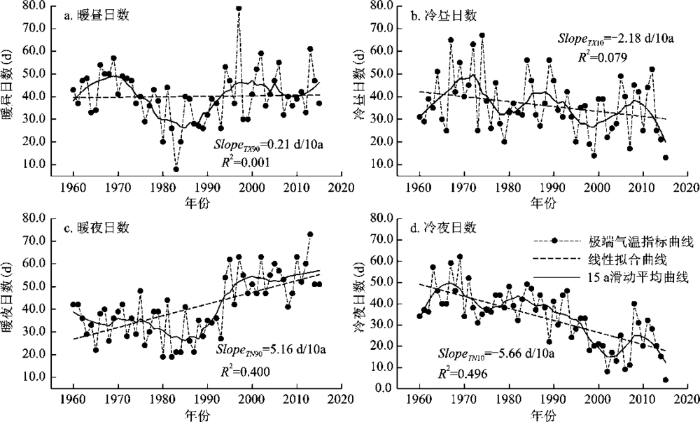
1960~2015年西安极端气温变化呈现出新的特征:“夜晚增暖趋势明显于白天,白天年代波动明显于夜晚”。其中,暖夜日数变化趋势为5.16 d/10a,高于暖昼日数上升速率0.21 d/10a;冷夜日数变化趋势为-5.66 d/10a,高于冷昼日数下降速率-2.18 d/10a。说明在白天,西安炎热程度增加不明显,寒冷程度略有下降;而夜晚炎热程度大幅上升,寒冷程度呈现快速下降(图5)。
图5 1960~2015年西安极端气温相对指数变化特征
Fig.5 Linear trend in relative indices of annual extreme temperature events in Xi’an during 1960-2015
在变化过程上,暖昼日数变化峰值年分别为:1969年、1997年,冷昼日数峰值年分别为:1974年、1984年、1989年和2012年,整体曲线呈现明显的年代“高低波动”特征。在夜间,暖夜日数呈现“Z”型突变增长,20世纪60 年代到80年代中期维持低位波动且略有下降,20世纪80年代末到90年代呈快速上升趋势,1998年后则维持高位稳定波动,这与全球变暖停滞时间一致;对于冷夜日数变化而言,线性变化趋势更加明显,也可以清晰看到,1998~2015年冷夜日数下降趋势减弱,且维持低位波动。也就是说,全球变暖停滞背景下,西安昼夜炎热程度增加趋势有所减弱,昼夜寒冷程度在大幅下降后,处于低位平稳波动状态。
2.2.3 持续指数变化特征
1960~2015年西安暖持续日数以平稳波动为主,冷持续日数呈现波动下降,气温日较差持续减小,作物生长季则呈现波动上升。除暖持续日数趋势不显著外,其他指数变化均通过0.05水平显著检验(图6)。说明西安持续性高温事件变化不大,但是持续性低温事件大幅下降。在变化过程上,西安冷持续日数呈稳步下降趋势(-2.76 d/10a),1960~1989年冷持续日数年均为16.0 d,1990~2015年下降为7.1 d;由于夜间温度的快速上升,西安昼夜温差持续下降,生长季长度也在增加。但是20世纪80年代,生长季存在一个“谷值”,其中,1981~1991年生长季年均为267.2 d,低于1960~2015年生长季年均长度279.5 d。
图6 1960~2015年西安极端气温持续指数变化特征
Fig.6 Linear trend in durative indices of annual extreme temperature events in Xi’an during 1960-2015
2.2.4 极值指数变化特征
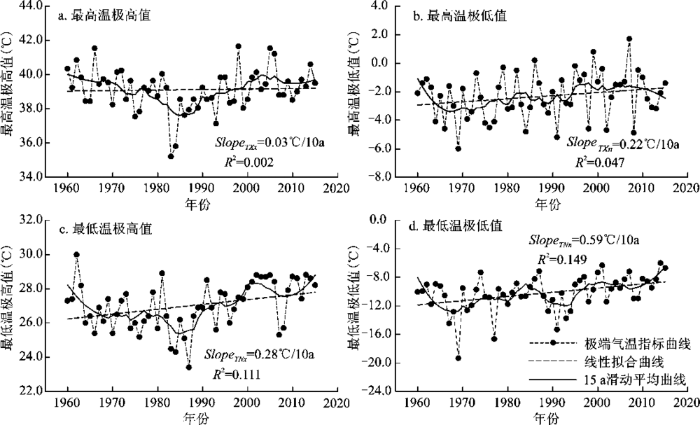
近56 a西安极值指数呈现快速上升趋势(图7)。其中,最高温极高值、最高温极低值、最低温极高值和最低温极低值上升速率为:0.03℃/10a、0.22℃/10a、0.28℃/10a和0.59℃/10a。在变化阶段上,最高温极高值和最低温极高值变化具有一致性,以1984年为界,均呈现出先下降后上升的变化过程;最高温极低值和最低温极低值变化趋势基本一致,均无明显的趋势转折,呈现波动上升趋势;最低温极低值的增温趋势最为明显,其次是最低温极高值和最高温极低值,最高温极高值增温幅度最小。
图7 1960~2015年西安极端气温极值指数变化特征
Fig.7 Linear trend in extremal indices of annual extreme temperature events in Xi’an during 1960-2015
2.2.5 不同区域极端气温指数对比
在已有研究基础上,对比气温均一化前后、以及东北地区[23]、黄土高原[5]、秦岭地区[24]、长江流域[6]、珠江流域[7]、中国[25]和全球[26]等7个区域极端气温变化趋势,说明西安极端气温变化的特殊性(表2)。
表2 西安与其他区域极端气温指数变化趋势对比
Table 2 Trends of temperature extremes from this study and other works
| 指数 | 本文 | 东北地区 | 黄土高原 | 秦岭南北 | 长江流域 | 珠江流域 | 中国 | 全球 | |
|---|---|---|---|---|---|---|---|---|---|
| 1960~2015年 | 1960~2011年 | 1960~2013年 | 1960~2012年 | 1960~2012年 | 1960~2012年 | 1961~2010年 | 1951~2011年 | ||
| 均一化 | 否 | 是 | 否 | 是 | 否 | 否 | 否 | 否 | 是 |
| SU | 2.87* | 3.40* | 2.30* | 2.76* | 2.49* | 2.16* | 1.60* | 2.30* | 0.47* |
| TR | 5.41* | 5.45* | 1.42* | 1.24* | 1.95* | 1.05* | 2.58* | 1.90* | 0.91* |
| ID | -0.39 | -0.75 | -1.74* | -2.21* | -0.50* | -0.42* | -0.02 | -1.70* | -1.23* |
| FD | -5.96* | -6.96* | -3.36* | -3.22* | -3.39* | -3.04* | -0.68* | -3.40* | -1.80* |
| TX90 | -0.21 | 0.21 | 0.97* | 2.60* | 1.37* | 1.71* | 1.01* | 1.60* | 0.80* |
| TX10 | -1.89* | -2.18* | -0.86* | -2.71* | -0.95* | -1.03* | -0.02 | -0.80* | -0.67* |
| TN90 | 4.46* | 5.16* | 2.17* | 3.41* | 2.70* | 2.95* | 1.98* | 2.80* | 1.17* |
| TN10 | -5.06* | -5.66* | -1.80* | -4.31* | -2.39* | -3.45* | -1.23* | -1.70* | -1.09* |
| TXx | 0.01 | 0.03 | 0.11 | / | 0.05* | 0.14* | 0.10* | 0.19* | 0.11* |
| TXn | 0.17 | 0.22 | 0.39 | / | 0.26* | 0.28* | 0.22 | 0.34* | 0.28* |
| TNx | 0.25* | 0.28* | 0.23* | / | 0.11* | 0.18* | 0.16* | 0.25* | 0.12* |
| TNn | 0.49* | 0.59* | 0.82* | / | 0.31* | 0.42* | 0.44* | 0.56* | 0.45* |
| WSDI | -0.71 | -0.59 | / | 0.68* | 0.56* | 0.73* | 1.23* | 2.30* | 1.18* |
| CSDI | -2.58* | -2.76* | / | -0.69 | -0.29* | -1.60* | -0.56* | -0.40* | -0.62* |
| DTR | -0.29* | -0.29* | -0.24 | -0.06 | -0.07* | -0.09* | -0.11* | / | -0.09* |
| GSL | 2.69* | 3.50* | 2.62* | 3.16* | 2.38* | / | 0.28 | 2.80* | 1.01* |
1) 均一化后极端气温趋势均有上升。除昼夜温差(DTR)之外,均一化后西安极端气温变化幅度均高于非均一化数据。其中,均一化之前暖昼日数为下降趋势(-0.21 d/10a),经均一化之后,暖昼日数上升趋势为0.21 d/10a,更符合区域变暖的客观事实。同时,均一化之后,夏季日数、暖夜日数和生长季增加趋势更加明显,霜冻日数和冷夜日数下降趋势也更加显著,说明采用非均一化数据,会低估西安极端气温的变化趋势。
2)西安极端低温事件下降幅度突出。与中国其他区域相比,西安绝对指标(SU、TR、FD)、相对指标(TN90、TN10)、极值指标(TNx)、持续性指标(CSDI、DTR、GSL)等9个指数的变幅,均高于其他区域;除SU、DTR、GSL外,其他指标均与最低温度有关,说明在夜间,西安极端气温变化幅度比其他区域更为明显。其原因可能是:对比区域多为气候背景,西安极端气温变化则叠加城市热岛效应,使得夜间增温幅度高于其他地区。
3) 西安极端高温事件上升幅度较弱。与中国其他区域相比,西安暖昼日数、最高温极高值、最高温极低值上升幅度小于其他对比区域;与此同时,对比区域暖持续日数变化呈现显著上升趋势,但是西安地区却呈现不显著的下降趋势。上述4个极端气温指数均与最高温相关,说明在白天,西安极端气温上升幅度比其他区域偏弱。
4) 冷/暖、昼/夜差异对比。1960~2015年西安冷指数(FD、TX10、TN10)变暖幅度高于暖指数(TR、TX90、TN90)、夜指数(TN90、TN10)变暖幅度高于昼指数(TX90、TX10)、低温指数(TNx、TNn)增温幅度快于高温指数(TXx、TXn)、气温极低值(TXn、TNn)增温幅度高于气温极高值(TXx、TNx)。西安极端气温变化趋势呈现出“冷暖不对称、昼夜不对称”的特点。
与黄土高原相似,1960~2015年西安TX10/TN10下降幅度高于TX90/TN90上升幅度,长江流域仅表现为TN10下降幅度高于TN90上升幅度,东北地区、秦岭地区、珠江流域、中国及全球则与之相反,TX10和TN10下降幅度低于TX90和TN90上升幅度。与此同时,与中国其他区域相似,西安ID下降趋势低于SU上升趋势,但是与全球尺度规律相反。除珠江流域之外,西安与其他区域共同表现为FD下降趋势高于TR上升趋势。在黄土高原和长江流域,CSDI下降趋势快于WSDI上升趋势,其他区域呈现CSDI下降趋势慢于WSDI上升趋势,两指数在西安却共同呈现下降趋势,仅是WSDI下降趋势小于CSDI。上述4个方面,西安极端气温变化与其他区域不一致。
西安极端气温变化与中国其他区域一致的指标,主要为极值指标、低温指标。这些指标对比关系本质是:夜间增温快于白天。说明在冷暖指标上,西安极端气温变化具有区域性,而在昼夜指标上,西安极端气温变化与中国、全球变化具有一致性。
基于1960~2015年均一化的逐日最高、最低气温数据,利用16项极端气温指数,对西安极端气温变化特征进行分析,通过均一化前后趋势对比,中国不同区域趋势变化对比,冷暖、昼夜变化对比,分析前期研究结论的不确定性,说明西安极端气温变化的特殊性。得到结论如下:
1) 受城市化影响,西安气象站由城区迁往郊区,导致数据存在非均一化。经均一化订正后,1960~2015年西安年均最高温和最低温有所下降,但是增温趋势明显上升。除昼夜温差(DTR)之外,均一化后西安极端气温变化幅度均高于非均一化数据,说明采用非均一化数据,会低估西安极端气温的变化趋势。
2) 1960~2015年西安极端气温变化呈现:“快速增温与平稳波动并存,冷暖变化趋势相反,夜晚增暖趋势明显于白天,白天波动变化明显于夜晚,持续性高温事件增加较弱,持续性低温事件大幅减少”的变化特征。全球变暖背景下,西安夜晚温度不断上升,夏季日数不断增加,夜晚炎热程度不断增强;白天寒冷程度波动变化,夜间寒冷程度明显下降;昼夜温差不断减小,生长季也不断变长。
3) 通过均一化前后趋势对比、不同区域趋势变化对比、冷暖、昼夜变化关系对比,发现采用非均一化数据,会低估西安极端气温变化趋势;受城市热岛效应影响,西安极端低温事件变化幅度更为突出,远高于中国其他对比区域(秦岭南北、黄土高原、东北地区等);在昼夜变化上,西安极端气温变化与中国、全球变化具有一致性,呈现出:“冷暖不对称、昼夜不对称”的特征,但是在冷暖变化上,西安极端气温变化更具有区域性,其中冷昼日数下降幅度高于暖昼日数上升幅度,冷夜日数下降幅度高于暖夜日数上升幅度,冷持续日数和暖持续日数共同表现为下降趋势。
关于西安极端气温变化特征的研究,未来还有许多工作值得探索。
1) 热岛效应分析。在夜间,西安极端低温变化幅度比中国其他区域偏高;在白天,极端高温变化幅度比中国其他区域偏弱。Skarbit等对匈牙利南部城市赛格德城市气候研究发现,夏末秋初,赛格德市白天呈现冷岛效应,而夜晚的热岛效应更突出[27]。由于小时数据获取的限制,前期西安热岛效应研究,涉及逐小时昼夜响应差异分析相对较少。利用白天最高温数据(14时左右),会忽略早晨(8~9时)城市的冷岛效应。因此,未来研究中,明晰西安白天是否存在冷岛效应,探讨夜间热岛效应季节和年代变化特征,解释“西安夜间增温偏强,白天增温偏弱”的原因,是未来研究的重点方向。
2) 气候适应分析。提高极端天气风险管理和适应气候变化的能力,是区域经济社会可持续发展的内在需求。从极端气温变化转为适应性研究,需要关注基础设施建设、城市发展、公共健康管理中的风险问题。尤其是公共健康方面,利用更加精细化和客观的热量平衡模型,评估西安不同区域居民对极端气温的感知变化,为科学适应气候变化提供决策依据。
The authors have declared that no competing interests exist.
| [1] |
Global observed changes in daily climate extremes of temperature and precipitation [J].https://doi.org/10.1029/2005JD006290 URL [本文引用: 1] 摘要
A suite of climate change indices derived from daily temperature and precipitation data, with a primary focus on extreme events, were computed and analyzed. By setting an exact formula for each index and using specially designed software, analyses done in different countries have been combined seamlessly. This has enabled the presentation of the most up-to-date and comprehensive global picture of trends in extreme temperature and precipitation indices using results from a number of workshops held in data-sparse regions and high-quality station data supplied by numerous scientists world wide. Seasonal and annual indices for the period 1951-2003 were gridded. Trends in the gridded fields were computed and tested for statistical significance. Results showed widespread significant changes in temperature extremes associated with warming, especially for those indices derived from daily minimum temperature. Over 70% of the global land area sampled showed a significant decrease in the annual occurrence of cold nights and a significant increase in the annual occurrence of warm nights. Some regions experienced a more than doubling of these indices. This implies a positive shift in the distribution of daily minimum temperature throughout the globe. Daily maximum temperature indices showed similar changes but with smaller magnitudes. Precipitation changes showed a widespread and significant increase, but the changes are much less spatially coherent compared with temperature change. Probability distributions of indices derived from approximately 200 temperature and 600 precipitation stations, with near-complete data for 1901-2003 and covering a very large region of the Northern Hemisphere midlatitudes (and parts of Australia for precipitation) were analyzed for the periods 1901-1950, 1951-1978 and 1979-2003. Results indicate a significant warming throughout the 20th century. Differences in temperature indices distributions are particularly pronounced between the most recent two periods and for those indices related to minimum temperature. An analysis of those indices for which seasonal time series are available shows that these changes occur for all seasons although they are generally least pronounced for September to November. Precipitation indices show a tendency toward wetter conditions throughout the 20th century.
|
| [2] |
Trends in indices of daily temperature and precipitation extremes in Europe, 1946-99 [J].https://doi.org/10.1175/1520-0442(2003)0162.0.CO;2 URL [本文引用: 1] 摘要
Trends in indices of climate extremes are studied on the basis of daily series of temperature and precipitation observations from more than 100 meteorological stations in Europe. The period is 194609“99, a warming episode. Averaged over all stations, the indices of temperature extremes indicate 0904symmetric0909 warming of the cold and warm tails of the distributions of daily minimum and maximum temperature in this period. However, 0904asymmetry0909 is found for the trends if the period is split into two subperiods. For the 194609“75 subperiod, an episode of slight cooling, the annual number of warm extremes decreases, but the annual number of cold extremes does not increase. This implies a reduction in temperature variability. For the 197609“99 subperiod, an episode of pronounced warming, the annual number of warm extremes increases 2 times faster than expected from the corresponding decrease in the number of cold extremes. This implies an increase in temperature variability, which is mainly due to stagnation in the warming of the cold extremes. For precipitation, all Europe-average indices of wet extremes increase in the 194609“99 period, although the spatial coherence of the trends is low. At stations where the annual amount increases, the index that represents the fraction of the annual amount due to very wet days gives a signal of disproportionate large changes in the extremes. At stations with a decreasing annual amount, there is no such amplified response of the extremes. The indices of temperature and precipitation extremes in this study were selected from the list of climate change indices recommended by the World Meteorological Organization09“Commission for Climatology (WMO09“CCL) and the Research Programme on Climate Variability and Predictability (CLIVAR). The selected indices are expressions of events with return periods of 509“60 days. This means that the annual number of events is sufficiently large to allow for meaningful trend analysis in 09030450 yr time series. Although the selected indices refer to events that may be called 0904soft0909 climate extremes, these indices have clear impact relevance.
|
| [3] |
Monitoring changes in climate extremes: A tale of international collaboration [J].https://doi.org/10.1175/2008BAMS2501.1 URL [本文引用: 1] 摘要
Abstract The monitoring and analysis of daily climate records to identify trends in extreme climate events have been primarily limited to data from Canada, the US, the Soviet Union, China, and Australia. Their data was hard to analyze since they used varying measures of extremes. As such, the need to update and converge the findings has been recognized at the November 1999 meeting of what is now known as the joint Expert Team on Climate Change Detection and Indices. The task was to converge the exact formulation of a suite of agreed indices of climate extremes from daily data and the organization of a regional climate-change workshops. As of 2004, a total of five workshops have been conducted in Melbourne. The workshops included participants from neighboring countries and from other areas of the world to provide guidance on the analysis of the climate data.
|
| [4] |
The changing nature of temperature extremes in Australia and New Zealand [J].https://doi.org/10.1016/j.atmosres.2007.06.007 URL [本文引用: 1] 摘要
ABSTRACT A dense network of stations in Australia and New Zealand, including urbanised sites, was analysed to assess urbanisation effects on indices of extreme temperature, type of distribution change observed, and relationships with key climate drivers (El Ni o Southern Oscillation (ENSO), sea-surface temperature (SST) and mean sea-level pressure (MSLP) patterns). A strong spatial and temporal coherence of trends in extreme temperature indices was notable across both rural and urban stations, except for diurnal temperature range which was strongly influenced by urbanisation and biased by data limitations. Increased mean maximum and mean minimum temperature, general increases in hot days and warm nights, and decreases in cool days and cold nights, persisted over three analysis periods (1931-2005, 1946-2005 and 1961-2005), with the proportion of significant trends increasing as analysis period lengthened for all indices except hot days. Rural stations had fewer significant increasing trends in warm extremes, while urbanised sites showed a greater number of significant hot day increases. Strong correlations were found between measures of mean temperature and temperature extremes, consistent across all three analysis periods and largely independent of urban status. The most common form of distributional change, for both maximum and minimum temperature, involved a significant shift in the mean and one or both extremes. However, the proportion of stations with this type of distribution shift reduced in the later period, with relatively more stations having no distribution change, or shifts in the mean (but not extremes) over 1961-2005, possibly due to a change in the relationship between ENSO and temperature and/or the effects of rapid population growth since the 1950s. This study indicates that measures of ENSO, such as NINO3.4 or our second MSLP pattern, have the potential to better predict temperature extremes over large areas of Australasia, especially eastern Australia, compared to other broadscale climate indices, such as near-global SST patterns.
|
| [5] |
Changes in extreme temperature and precipitation events in the Loess Plateau (China) during 1960-2013 under global warming [J].https://doi.org/10.1016/j.atmosres.2015.09.001 URL [本文引用: 2] 摘要
In recent decades, extreme climatic events have been a major issue worldwide. Regional assessments on various climates and geographic regions are needed for understanding uncertainties in extreme events' responses to global warming. The objective of this study was to assess the annual and decadal trends in 12 extreme temperature and 10 extreme precipitation indices in terms of intensity, frequency, and duration over the Loess Plateau during 1960–2013. The results indicated that the regionally averaged trends in temperature extremes were consistent with global warming. The occurrence of warm extremes, including summer days (SU), tropical nights (TR), warm days (TX90), and nights (TN90) and a warm spell duration indicator (WSDI), increased by 2.76 ( P 02<020.01), 1.24 ( P 02<020.01), 2.60 ( P 02=020.0003), 3.41 ( P 02<020.01), and 0.68 ( P 02=020.0041) days/decade during the period of 1960–2013, particularly, sharp increases in these indices occurred in 1985–2000. Over the same period, the occurrence of cold extremes, including frost days (FD), ice days (ID), cold days (TX10) and nights (TN10), and a cold spell duration indicator (CSDI) exhibited decreases of 61023.22 ( P 02<020.01), 61022.21 ( P 02=020.0028), 61022.71 ( P 02=020.0028), 61024.31 ( P 02<020.01), and 61020.69 ( P 02=020.0951) days/decade, respectively. Moreover, extreme warm events in most regions tended to increase while cold indices tended to decrease in the Loess Plateau, but the trend magnitudes of cold extremes were greater than those of warm extremes. The growing season (GSL) in the Loess Plateau was lengthened at a rate of 3.1602days/decade ( P 02<020.01). Diurnal temperature range (DTR) declined at a rate of 61020.0602°C /decade ( P 02=020.0931). Regarding the precipitation indices, the annual total precipitation (PRCPTOT) showed no obvious trends ( P 02=020.7828). The regionally averaged daily rainfall intensity (SDII) exhibited significant decreases (61020.1402mm/day/decade, P 02=020.0158), whereas consecutive dry days (CDD) significantly increased (1.9602days/decade, P 02=020.0001) during 1960–2013. Most of stations with significant changes in SDII and CDD occurred in central and southeastern Loess Plateau. However, the changes in days of erosive rainfall, heavy rain, rainstorm, maximum 5-day precipitation, and very-wet-day and extremely wet-day precipitation were not significant. Large-scale atmospheric circulation indices, such as the Western Pacific Subtropical High Intensity Index (WPSHII) and Arctic Oscillation (AO), strongly influences warm/cold extremes and contributes significantly to climate changes in the Loess Plateau. The enhanced geopotential height over the Eurasian continent and increase in water vapor divergence in the rainy season have contributed to the changes of the rapid warming and consecutive drying in the Loess Plateau.
|
| [6] |
Trends and variability of daily temperature extremes during 1960-2012 in the Yangtze River Basin, China [J].https://doi.org/10.1016/j.gloplacha.2014.11.008 URL [本文引用: 2] 摘要
The variability of surface air temperature extremes has been the focus of attention during the past several decades, and may exert a great influence on the global hydrologic cycle and energy balance through thermal forcing. Based on daily minimum (TN) and maximum temperature (TX) observed by the China Meteorological Administration at 143 meteorological stations in the Yangtze River Basin (YRB), a suite of temperature indices recommended by the Expert Team on Climate Change Detection and Indices, with a primary focus on extreme events, were computed and analyzed for the period of 1960–2012 for this area. The results show widespread significant changes in all temperature indices associated with warming in the YRB during 1960–2012. On the whole, cold-related indices, i.e., cold nights, cold days, frost days, icing days and cold spell duration index significantly decreased by 61023.45, 61021.03, 61023.04, 61020.42 and 61021.602days/decade, respectively. In contrast, warm-related indices such as warm nights, warm days, summer days, tropical nights and warm spell duration index significantly increased by 2.95, 1.71, 2.16, 1.05 and 0.7302days/decade. Minimum TN, maximum TN, minimum TX and maximum TX increased significantly by 0.42, 0.18, 0.19 and 0.1402°C/decade. Because of a faster increase in minimum temperature than maximum temperature, the diurnal temperature range (DTR) exhibited a significant decreasing trend of 61020.0902°C/decade for the whole YRB during 1960–2012. However, the decreasing trends all occurred in 1960–1985, while increasing trends though insignificant were found in all sub-regions and the whole YRB during 1986–2012. Geographically, stations in the eastern Tibet Plateau and northeastern YRB showed stronger trends in almost all temperature indices. Time series analysis indicated that the YRB was dominated by a general cooling trend before the mid-1980s, but a warming trend afterwards. In general, the overall warming in the YRB was mainly due to the warming in 1986–2012. Strong relationships between temperature trends and elevation were detected in this study. The warming rates increased with elevation when elevation is above 35002m, but decreased with elevation when elevation is below 35002m.
|
| [7] |
珠江流域1960-2012年极端气温的时空变化特征 [J].https://doi.org/10.11849/zrzyxb.2015.08.010 URL [本文引用: 2] 摘要
根据珠江流域43个气象站点(1960—2012年)16个极端气温指标数据,采用线性回归、Mann-Kendall(M-K)和小波分析法分析珠江流域极端气温的时空变化特征。变化趋势分析表明,除结冰日数(ID0)、月最高气温极小值(TXn)、冷昼日数(TX10p)和作物生长期(GSL)4个指标呈现出不显著的变化趋势外,夏日日数(SU25)、热浪日数(TR20)尤其是暖夜日数则呈明显上升趋势(P<0.05);空间变化分析表明,冷夜日数(TN10p)、冷日持续指数(CSDI)和昼夜温差幅度(DTR)以及冷昼日数(TX10p)在整个珠江流域大致呈下降趋势,其余10个指标大致呈上升趋势,呈现出较好的流域一致性;突变分析表明,除了ID0、TX10p和GSL三个指标之外,其余指标均通过了显著性检验,大多数突变点发生于1980年代,其中夏日日数(SU25)、热浪日数(TR20)的突变点分别为2001和1994年;周期分析表明,大部分指标呈现多个周期震荡,且都以2~4 a为主周期。SCSMI(南中国海夏季季风指数)与ENSO是造成研究区极端高气温的重要因素。
Temporal and spatial variation characteristics of extreme temperature in the Pearl River Basin during 1960-2012 .https://doi.org/10.11849/zrzyxb.2015.08.010 URL [本文引用: 2] 摘要
根据珠江流域43个气象站点(1960—2012年)16个极端气温指标数据,采用线性回归、Mann-Kendall(M-K)和小波分析法分析珠江流域极端气温的时空变化特征。变化趋势分析表明,除结冰日数(ID0)、月最高气温极小值(TXn)、冷昼日数(TX10p)和作物生长期(GSL)4个指标呈现出不显著的变化趋势外,夏日日数(SU25)、热浪日数(TR20)尤其是暖夜日数则呈明显上升趋势(P<0.05);空间变化分析表明,冷夜日数(TN10p)、冷日持续指数(CSDI)和昼夜温差幅度(DTR)以及冷昼日数(TX10p)在整个珠江流域大致呈下降趋势,其余10个指标大致呈上升趋势,呈现出较好的流域一致性;突变分析表明,除了ID0、TX10p和GSL三个指标之外,其余指标均通过了显著性检验,大多数突变点发生于1980年代,其中夏日日数(SU25)、热浪日数(TR20)的突变点分别为2001和1994年;周期分析表明,大部分指标呈现多个周期震荡,且都以2~4 a为主周期。SCSMI(南中国海夏季季风指数)与ENSO是造成研究区极端高气温的重要因素。
|
| [8] |
1960-2013年中国沿海极端气温事件变化特征 [J].https://doi.org/10.13249/j.cnki.sgs.2016.04.016 Magsci [本文引用: 1] 摘要
<p>基于1960~2013年中国沿海110个地面气象站资料,分析了中国沿海极端气温事件的变化特征。结果表明:中国近54 a来月最高气温极小值(TXn)、极端最高温(TXx)、极端最低温(TNn)和月最低气温极大值(TNx)都呈上升趋势,其中极端最低气温上升幅度最大,升幅为0.40 ℃/10a。日较差(DTR)、冷昼日数(TX10p)和冷夜日数(TN10p)呈下降趋势,降幅分别为<i>-</i>0.12℃/10a、<i>-</i>0.7 d/10a和<i>-</i>2.19 d/10a,暖昼日数(TX90p)和暖夜日数(TN90p)呈显著上升趋势,升幅分别为1.31 d/10a和2.24 d/10a。SU25和TR20近30 a上升幅度分别为6.35 d/10a和5.28 d/10a。从空间变化来看TXn、TXx、TNn和TNx分别有97%、71%、97%和97%气象站呈上升趋势,大部分都通过了0.01水平的显著性检验。TX10p、TN10p和DTR分别有90%、99%和81%的气象站呈下降趋势。大部分极端气温指数变化趋势与纬度、经度和海拔有显著的相关性。极端气温指数在气候变暖突变前后也存在明显差异,TX10p、TN10p和DTR在气候变暖后明显减少,而其他指数则明显上升。</p>
Variation of extreme temperature events in coastal region of China in 1960-2013 .https://doi.org/10.13249/j.cnki.sgs.2016.04.016 Magsci [本文引用: 1] 摘要
<p>基于1960~2013年中国沿海110个地面气象站资料,分析了中国沿海极端气温事件的变化特征。结果表明:中国近54 a来月最高气温极小值(TXn)、极端最高温(TXx)、极端最低温(TNn)和月最低气温极大值(TNx)都呈上升趋势,其中极端最低气温上升幅度最大,升幅为0.40 ℃/10a。日较差(DTR)、冷昼日数(TX10p)和冷夜日数(TN10p)呈下降趋势,降幅分别为<i>-</i>0.12℃/10a、<i>-</i>0.7 d/10a和<i>-</i>2.19 d/10a,暖昼日数(TX90p)和暖夜日数(TN90p)呈显著上升趋势,升幅分别为1.31 d/10a和2.24 d/10a。SU25和TR20近30 a上升幅度分别为6.35 d/10a和5.28 d/10a。从空间变化来看TXn、TXx、TNn和TNx分别有97%、71%、97%和97%气象站呈上升趋势,大部分都通过了0.01水平的显著性检验。TX10p、TN10p和DTR分别有90%、99%和81%的气象站呈下降趋势。大部分极端气温指数变化趋势与纬度、经度和海拔有显著的相关性。极端气温指数在气候变暖突变前后也存在明显差异,TX10p、TN10p和DTR在气候变暖后明显减少,而其他指数则明显上升。</p>
|
| [9] |
Changes in daily climate extremes in China and their connection to the large scale atmospheric circulation during 1961-2003 [J].https://doi.org/10.1007/s00382-009-0735-0 URL [本文引用: 1] 摘要
Based on daily maximum and minimum surface air temperature and precipitation records at 303 meteorological stations in China, the spatial and temporal distributions of indices of climate extremes are analyzed during 1961–2003. Twelve indices of extreme temperature and six of extreme precipitation are studied. Temperature extremes have high correlations with the annual mean temperature, which shows a significant warming of 0.27°C/decade, indicating that changes in temperature extremes reflect the consistent warming. Stations in northeastern, northern, northwestern China have larger trend magnitudes, which are accordance with the more rapid mean warming in these regions. Countrywide, the mean trends for cold days and cold nights have decreased by 610.47 and 612.0602days/decade respectively, and warm days and warm nights have increased by 0.62 and 1.7502days/decade, respectively. Over the same period, the number of frost days shows a statistically significant decreasing trend of 613.3702days/decade. The length of the growing season and the number of summer days exhibit significant increasing trends at rates of 3.04 and 1.1802days/decade, respectively. The diurnal temperature range has decreased by 610.18°C/decade. Both the annual extreme lowest and highest temperatures exhibit significant warming trends, the former warming faster than the latter. For precipitation indices, regional annual total precipitation shows an increasing trend and most other precipitation indices are strongly correlated with annual total precipitation. Average wet day precipitation, maximum 1-day and 5-day precipitation, and heavy precipitation days show increasing trends, but only the last is statistically significant. A decreasing trend is found for consecutive dry days. For all precipitation indices, stations in the Yangtze River basin, southeastern and northwestern China have the largest positive trend magnitudes, while stations in the Yellow River basin and in northern China have the largest negative magnitudes. This is inconsistent with changes of water vapor flux calculated from NCEP/NCAR reanalysis. Large scale atmospheric circulation changes derived from NCEP/NCAR reanalysis grids show that a strengthening anticyclonic circulation, increasing geopotential height and rapid warming over the Eurasian continent have contributed to the changes in climate extremes in China.
|
| [10] |
中国极端气候变化观测研究回顾与展望 [J].https://doi.org/10.3878/j.issn.1006-9585.2010.04.01 URL [本文引用: 1] 摘要
评述、总结了近年有关中国极端气候变化的观测研究成果,讨论了尚未解决的科学问题和今后应重点加强的工作方向。已有研究表明,1951年以来中国大陆地区极端气候事件频率和强度发生了一定变化,但不同类型和不同区域极端气候变化存在明显差异。从全国范围看,与异常偏冷相关的极端事件如寒潮、冷夜和冷昼天数、霜冻日数等,显著减少减弱,偏冷的气候极值减轻;与异常偏暖相关的暖夜、暖昼日数明显增多,暖夜日数增多尤其明显,但高温事件频数和偏热的气候极值未见显著长期趋势;全国平均暴雨和极端强降水事件频率和强度有所增长,特别是长江中下游和东南地区、西部特别是西北地区有较明显增长,而华北、东北中南部和西南部分地区减少减弱;多数地区小雨频数明显下降,偏轻和偏强降水的强度似有增加;全国遭受气象干旱的范围呈较明显增加趋势,其中华北和东北地区增加更为显著;登陆和影响我国的热带气旋、台风频数有所下降,其造成的降水总量有较明显减少;北方地区的沙尘暴事件从总体上看有显著减少减弱趋势;我国东部部分地区夏季雷暴发生频率也存在较明显下降趋势。现有工作表明,在涉及极端气候变化研究的资料处理和分析方法方面还有改进余地。观测资料的非均一性,以及观测环境改变和城市化对地面气候要素变化趋势的影响偏差,需要进行深入评价和客观订正。此外,目前对于区域极端气候变化的综合分析还较薄弱,在极端气候变化机理的研究方面有待加强。
Progresses in observation studies of climate extremes and changes in mainland China .https://doi.org/10.3878/j.issn.1006-9585.2010.04.01 URL [本文引用: 1] 摘要
评述、总结了近年有关中国极端气候变化的观测研究成果,讨论了尚未解决的科学问题和今后应重点加强的工作方向。已有研究表明,1951年以来中国大陆地区极端气候事件频率和强度发生了一定变化,但不同类型和不同区域极端气候变化存在明显差异。从全国范围看,与异常偏冷相关的极端事件如寒潮、冷夜和冷昼天数、霜冻日数等,显著减少减弱,偏冷的气候极值减轻;与异常偏暖相关的暖夜、暖昼日数明显增多,暖夜日数增多尤其明显,但高温事件频数和偏热的气候极值未见显著长期趋势;全国平均暴雨和极端强降水事件频率和强度有所增长,特别是长江中下游和东南地区、西部特别是西北地区有较明显增长,而华北、东北中南部和西南部分地区减少减弱;多数地区小雨频数明显下降,偏轻和偏强降水的强度似有增加;全国遭受气象干旱的范围呈较明显增加趋势,其中华北和东北地区增加更为显著;登陆和影响我国的热带气旋、台风频数有所下降,其造成的降水总量有较明显减少;北方地区的沙尘暴事件从总体上看有显著减少减弱趋势;我国东部部分地区夏季雷暴发生频率也存在较明显下降趋势。现有工作表明,在涉及极端气候变化研究的资料处理和分析方法方面还有改进余地。观测资料的非均一性,以及观测环境改变和城市化对地面气候要素变化趋势的影响偏差,需要进行深入评价和客观订正。此外,目前对于区域极端气候变化的综合分析还较薄弱,在极端气候变化机理的研究方面有待加强。
|
| [11] |
吉林省极端严寒事件时空分布特征及评估方法研究 [J].
利用1951~2013年最低气温资料和灰色关联度、气候倾向率、Gumbel极值分布等方法分析了吉林省严寒的时空分布特征和气候变化规律,给出了严寒过程的等级评估指标和异常气候重现期指标,对2011~2013年的严寒过程进行了评估。结果表明:吉林省严寒主要在冬季出现,在1月中旬前后达到峰值;中南部地区为严寒多发区,其它地区出现较少;吉林省年平均严寒发生次数呈下降的趋势,其中中西部地区呈上升的趋势,东南部地区呈下降的趋势;吉林省严寒次数的阶段性变化明显, 1951~1980年呈偏多的阶段, 1981~2013年处于偏少阶段;吉林省严寒过程主要出现在1月;利用序位以及等级评估、异常气候重现期评估指标对严寒过程进行评估,可满足快速、及时评估的气象服务的需求。
Spatial-temporal characteristics and assessment of the bitter cold event in Jilin Province .
利用1951~2013年最低气温资料和灰色关联度、气候倾向率、Gumbel极值分布等方法分析了吉林省严寒的时空分布特征和气候变化规律,给出了严寒过程的等级评估指标和异常气候重现期指标,对2011~2013年的严寒过程进行了评估。结果表明:吉林省严寒主要在冬季出现,在1月中旬前后达到峰值;中南部地区为严寒多发区,其它地区出现较少;吉林省年平均严寒发生次数呈下降的趋势,其中中西部地区呈上升的趋势,东南部地区呈下降的趋势;吉林省严寒次数的阶段性变化明显, 1951~1980年呈偏多的阶段, 1981~2013年处于偏少阶段;吉林省严寒过程主要出现在1月;利用序位以及等级评估、异常气候重现期评估指标对严寒过程进行评估,可满足快速、及时评估的气象服务的需求。
|
| [12] |
近60a丹东极端温度和降水事件变化特征 [J].
<p>利用丹东1951~2010 年逐日温度和降水资料,以多重分形去趋势波动分析法定义极端事件的阈值,分析了该地区极端最高温度、极端最低温度和极端降水的变化特征。结果表明:近60 a 丹东极端最低温度事件比极端最高温度和极端降水事件发生次数多,极端最高温度强度比极端最低温度大,平均超出了1.5 ℃,而极端降水平均强度为30.3 mm,都在20 世纪70 年代最小,70 年代是转折期;50 年代的极端气候事件(温度和降水)最为严重,其次是90 年代,70 年代的严重度最轻;极端降水频次变化不明显,极端最高温度事件可以由夏季平均最高温度的变化预测,有不显著的增多趋势,而极端最低温度事件可以用冬季平均日较差温度的变化预测,在今后一段时间内有显著减少的趋势。</p>
Characteristics of extreme temperature and precipitation events over Dandong during the last six decades .
<p>利用丹东1951~2010 年逐日温度和降水资料,以多重分形去趋势波动分析法定义极端事件的阈值,分析了该地区极端最高温度、极端最低温度和极端降水的变化特征。结果表明:近60 a 丹东极端最低温度事件比极端最高温度和极端降水事件发生次数多,极端最高温度强度比极端最低温度大,平均超出了1.5 ℃,而极端降水平均强度为30.3 mm,都在20 世纪70 年代最小,70 年代是转折期;50 年代的极端气候事件(温度和降水)最为严重,其次是90 年代,70 年代的严重度最轻;极端降水频次变化不明显,极端最高温度事件可以由夏季平均最高温度的变化预测,有不显著的增多趋势,而极端最低温度事件可以用冬季平均日较差温度的变化预测,在今后一段时间内有显著减少的趋势。</p>
|
| [13] |
1960~2014年北京极端气温事件变化特征 [J].https://doi.org/10.11820/dlkxjz.2011.06.009 URL Magsci [本文引用: 1] 摘要
<p>基于北京1960~2014 年逐日最高温、最低温、平均气温实测数据,采取RHtest 方法对气温序列进行均一性检验和修订。在此基础上选取16 个极端气温指标,分析了北京市极端气温变化趋势和突变特征,探讨了冷暖极端气温指数对北京气候暖化的贡献。结果表明:① 1960~2014 年北京气温暖化趋势明显,最低温增温速率远快于最高温,修订后增长速率为:最高温(0.17℃/10a) <平均温(0.30℃/10a) <最低温(0.51℃/10a);② 冷昼日数、冷夜日数、霜冻日数、冰冻日数、冷持续日数分别以-1.43 d/10a、-6.56 d/10a、-3.95 d/10a、-1.18 d/10a、-4.83 d/10a 的趋势减小;③ 暖昼日数、暖夜日数、夏季日数、热夜日数、暖持续日数、生物生长季以2.12 d/10a、5.27 d/10a、1.22 d/10a、5.43 d/10a、0.84 d/10a、1.96 d/10a 的趋势增加;④ 日最高(低) 气温极高值、日最高(低) 气温极低值和气温日较差的倾向率分别为0.21℃/10a、0.34℃/10a、0.31℃/10a、0.73℃/10a、-0.33℃/10a;⑤ 极端最低气温的变暖幅度大于极端最高气温,夜指数的变暖幅度大于昼指数,冷指数的变幅大于暖指数。极端气温冷指数、夜指数、低温指数的快速变化是近年来北京市气候暖化的最直接体现。</p>
Changes of extreme temperature events in Beijing during 1960-2014 .https://doi.org/10.11820/dlkxjz.2011.06.009 URL Magsci [本文引用: 1] 摘要
<p>基于北京1960~2014 年逐日最高温、最低温、平均气温实测数据,采取RHtest 方法对气温序列进行均一性检验和修订。在此基础上选取16 个极端气温指标,分析了北京市极端气温变化趋势和突变特征,探讨了冷暖极端气温指数对北京气候暖化的贡献。结果表明:① 1960~2014 年北京气温暖化趋势明显,最低温增温速率远快于最高温,修订后增长速率为:最高温(0.17℃/10a) <平均温(0.30℃/10a) <最低温(0.51℃/10a);② 冷昼日数、冷夜日数、霜冻日数、冰冻日数、冷持续日数分别以-1.43 d/10a、-6.56 d/10a、-3.95 d/10a、-1.18 d/10a、-4.83 d/10a 的趋势减小;③ 暖昼日数、暖夜日数、夏季日数、热夜日数、暖持续日数、生物生长季以2.12 d/10a、5.27 d/10a、1.22 d/10a、5.43 d/10a、0.84 d/10a、1.96 d/10a 的趋势增加;④ 日最高(低) 气温极高值、日最高(低) 气温极低值和气温日较差的倾向率分别为0.21℃/10a、0.34℃/10a、0.31℃/10a、0.73℃/10a、-0.33℃/10a;⑤ 极端最低气温的变暖幅度大于极端最高气温,夜指数的变暖幅度大于昼指数,冷指数的变幅大于暖指数。极端气温冷指数、夜指数、低温指数的快速变化是近年来北京市气候暖化的最直接体现。</p>
|
| [14] |
气候序列的均一化——定量评估气候变化的基础 [J].Homogenization of climate series: The basis for assessing climate change . |
| [15] |
地面气候资料均一性研究进展 [J].
气象台站观测的地面气候资料是气候变化研究的重要基础,气候资料的均一性检验和订正对于提高气候资料的质量和均一性状况具有实用意义和价值。通过回顾近年来国内外地面气候资料均一性研究进展、研究技术及发展趋势,总结了目前国内广泛应用的两种较为成熟的均一化方法(RHtest和MASH)及其对气温、风速资料均一性研究取得的一些成果,分析我国地面气候资料均一性研究的发展历程及现状,指出我国地面气候资料均一性研究存在的问题,未来需要在加强对台站元数据信息收集整理基础上,深入开展气候资料均一化技术和方法的基础研究,评估不同方法的优缺点,重建近百年中国地区均一化的气候序列。
Progresses in research of homogenization of climate data .
气象台站观测的地面气候资料是气候变化研究的重要基础,气候资料的均一性检验和订正对于提高气候资料的质量和均一性状况具有实用意义和价值。通过回顾近年来国内外地面气候资料均一性研究进展、研究技术及发展趋势,总结了目前国内广泛应用的两种较为成熟的均一化方法(RHtest和MASH)及其对气温、风速资料均一性研究取得的一些成果,分析我国地面气候资料均一性研究的发展历程及现状,指出我国地面气候资料均一性研究存在的问题,未来需要在加强对台站元数据信息收集整理基础上,深入开展气候资料均一化技术和方法的基础研究,评估不同方法的优缺点,重建近百年中国地区均一化的气候序列。
|
| [16] |
西安城市化对气温变化趋势的影响 [J].https://doi.org/10.3321/j.issn:0375-5444.2009.09.007 URL [本文引用: 1] 摘要
利用1951-2006年西安及周围3站点的气象数据分析了城市气温变化和周围台站温度变化的差异,给出了4个测站不同阶段、不同季节城市化影响气温变化的趋势系数及线性变化趋势。结果表明:城市化对气温的影响具有明显的阶段性和季节性。1980年以前,无论平均气温还是月最低气温和最高气温,西安与其周围站点的线性趋势系数及线性变化趋势相差不大;但在1980年以后,城市站的线性趋势系数明显大于周围站点的趋势系数,特别是在1993年以后,西安站的平均气温、最高和最低气温线性趋势系数远大于其周围站点的趋势系数,是周围站点的1.6~3.5倍,说明城市的热岛效应不但提高了城市的温度同时也改变城市的增温率,使得城市气温增温率加大。西安及其周围站的线性增暖趋势在春季最大,其中西安达到2.20oC/10a,是其它季节的2~4倍;秋季的线性增暖幅度次之,夏季最小。热岛效应对最高气温的最大贡献在春季,对最低气温的最大贡献在冬季。
The impact of urbanization on the surface temperature in Xi’an .https://doi.org/10.3321/j.issn:0375-5444.2009.09.007 URL [本文引用: 1] 摘要
利用1951-2006年西安及周围3站点的气象数据分析了城市气温变化和周围台站温度变化的差异,给出了4个测站不同阶段、不同季节城市化影响气温变化的趋势系数及线性变化趋势。结果表明:城市化对气温的影响具有明显的阶段性和季节性。1980年以前,无论平均气温还是月最低气温和最高气温,西安与其周围站点的线性趋势系数及线性变化趋势相差不大;但在1980年以后,城市站的线性趋势系数明显大于周围站点的趋势系数,特别是在1993年以后,西安站的平均气温、最高和最低气温线性趋势系数远大于其周围站点的趋势系数,是周围站点的1.6~3.5倍,说明城市的热岛效应不但提高了城市的温度同时也改变城市的增温率,使得城市气温增温率加大。西安及其周围站的线性增暖趋势在春季最大,其中西安达到2.20oC/10a,是其它季节的2~4倍;秋季的线性增暖幅度次之,夏季最小。热岛效应对最高气温的最大贡献在春季,对最低气温的最大贡献在冬季。
|
| [17] |
1993-2012年西安城区城市热岛效益强度变化趋势及影响因素分析 [J].https://doi.org/10.11849/zrzyxb.2015.06.008 URL [本文引用: 1] 摘要
基于西安市及其郊区(县)7个气象观测站1993—2012年的气温资料,采用回归分析、Mann-Kendall等方法分析了西安市过去20 a城市气温、热岛强度的变化规律,从城市经济发展、城市人口增长、城市能源消费等几方面揭示其与城市热岛效应的密切联系;同时运用灰色理论分析了诸影响因素对热岛强度的相对贡献度,并对西安未来热岛强度变化趋势进行了模拟。结果表明:1西安城区和郊区(县)气温均呈现波动上升的变化趋势,城市热岛强度变化具有明显的阶段性特征,且在2000年以后发生增强突变;2城市化的发展与城市热岛强度的变化具有密切关系,各要素相互之间呈现高度相关性,说明它们之间存在很强的传递作用;各要素与热岛强度呈现出极显著的相关关系,尤其是人口因素与热岛强度的关系最为密切,是影响热岛强度增强变化非常重要的一个综合性指标;从强度、密度和规模效应上来看,人口密度效应大于人口规模效应,经济密度效应稍大于经济规模效应,能耗强度效应大于能源规模效应;3各影响因素对热岛强度变化的贡献度存在明显差异,贡献程度最大的是常住人口数、常住人口密度和建成区面积,它们是影响热岛强度变化最为直接的因素;其余因素对热岛强度变化的贡献度相对较小,是间接的影响因素;4灰色建模显示,西安城市热岛强度在未来几年将继续呈现增强趋势。
The changing trend of heat island intensity and main influencing factors during 1993-2012 in Xi’an city .https://doi.org/10.11849/zrzyxb.2015.06.008 URL [本文引用: 1] 摘要
基于西安市及其郊区(县)7个气象观测站1993—2012年的气温资料,采用回归分析、Mann-Kendall等方法分析了西安市过去20 a城市气温、热岛强度的变化规律,从城市经济发展、城市人口增长、城市能源消费等几方面揭示其与城市热岛效应的密切联系;同时运用灰色理论分析了诸影响因素对热岛强度的相对贡献度,并对西安未来热岛强度变化趋势进行了模拟。结果表明:1西安城区和郊区(县)气温均呈现波动上升的变化趋势,城市热岛强度变化具有明显的阶段性特征,且在2000年以后发生增强突变;2城市化的发展与城市热岛强度的变化具有密切关系,各要素相互之间呈现高度相关性,说明它们之间存在很强的传递作用;各要素与热岛强度呈现出极显著的相关关系,尤其是人口因素与热岛强度的关系最为密切,是影响热岛强度增强变化非常重要的一个综合性指标;从强度、密度和规模效应上来看,人口密度效应大于人口规模效应,经济密度效应稍大于经济规模效应,能耗强度效应大于能源规模效应;3各影响因素对热岛强度变化的贡献度存在明显差异,贡献程度最大的是常住人口数、常住人口密度和建成区面积,它们是影响热岛强度变化最为直接的因素;其余因素对热岛强度变化的贡献度相对较小,是间接的影响因素;4灰色建模显示,西安城市热岛强度在未来几年将继续呈现增强趋势。
|
| [18] |
西安地区热岛效应与景观生态格局相关性研究 [J].
从景观生态学角度出发,基于2013年西安地区逐日平均、最高和最低气温数据以及遥感影像资料,运用数理统计和数字图像处理等方法,研究冬、夏季节地面气温表征的城市热岛效应变化特征,获取土地覆盖/利用类型信息。在此基础上,分析该地区景观格局特征,以及热岛效应与土地利用景观格局的关联性。结果表明:西安市城市建成区冬季、夏季均存在明显的热岛效应,且热岛效应对日最低温度敏感性更高;热岛效应强度与城镇用地和林地的面积、破碎度、斑块占景观总面积比、景观形状和斑块结合度均存在联系,且热岛效应对城镇用地景观格局的敏感性冬季高于夏季,而对林地景观格局的敏感性则是夏季高于冬季。
Relation between the urban heat island effect and landscape ecological pattern in Xi’an region .
从景观生态学角度出发,基于2013年西安地区逐日平均、最高和最低气温数据以及遥感影像资料,运用数理统计和数字图像处理等方法,研究冬、夏季节地面气温表征的城市热岛效应变化特征,获取土地覆盖/利用类型信息。在此基础上,分析该地区景观格局特征,以及热岛效应与土地利用景观格局的关联性。结果表明:西安市城市建成区冬季、夏季均存在明显的热岛效应,且热岛效应对日最低温度敏感性更高;热岛效应强度与城镇用地和林地的面积、破碎度、斑块占景观总面积比、景观形状和斑块结合度均存在联系,且热岛效应对城镇用地景观格局的敏感性冬季高于夏季,而对林地景观格局的敏感性则是夏季高于冬季。
|
| [19] |
气候变暖与西安市冬季供暖的能源消耗分析 [J].https://doi.org/10.3969/j.issn.1673-1719.2007.04.006 URL [本文引用: 1] 摘要
综合分析了西安市负积温、供暖初日、供暖终日、供暖期天数以及西安集中供暖面积和供暖热消耗量的多年变化。结果表明:在全球变暖的背景下,西安市亦存在冬季越来越暖,采暖期越来越短的趋势;随着经济的发展,集中供暖总面积和总供暖热消耗量不断增加,而单位供暖面积的热消耗量的总趋势随年代有所减少,但逐年耗热量与冬季气温的相关性并不好,说明实际供暖部门并没有根据气候变化调整能源投入。因此,建议冬季供暖的初、终日期及供暖强度应随着天气冷暖变化而随时调整,实现合理节能。
Climate warming and energy consumed for winter heating in Xi’an .https://doi.org/10.3969/j.issn.1673-1719.2007.04.006 URL [本文引用: 1] 摘要
综合分析了西安市负积温、供暖初日、供暖终日、供暖期天数以及西安集中供暖面积和供暖热消耗量的多年变化。结果表明:在全球变暖的背景下,西安市亦存在冬季越来越暖,采暖期越来越短的趋势;随着经济的发展,集中供暖总面积和总供暖热消耗量不断增加,而单位供暖面积的热消耗量的总趋势随年代有所减少,但逐年耗热量与冬季气温的相关性并不好,说明实际供暖部门并没有根据气候变化调整能源投入。因此,建议冬季供暖的初、终日期及供暖强度应随着天气冷暖变化而随时调整,实现合理节能。
|
| [20] |
1960-2012年西安地区雾霾日数与气象因素变化规律分析 [J].
利用1960—2012年西安区域7个气象站的历史地面观测资料,统计分析了西安区域能见度介于1-10 km的雾霾天气现象的长期气候变化及空间分布特征.结果发现,能见度介于1-10 km的雾霾日发生数存在准7-9年周期震荡,每7-9年形成一个峰型.同时还分析了能见度介于1-10 km的雾霾天气时的气象要素变化规律及相关关系.研究表明,53年来西安区域雾霾现象日数的波动性增加趋势非常明显;雾霾现象各月日数年内基本呈单谷型分布,雾霾现象最多出现于冬季,夏季出现概率较小;随着雾霾持续日数的递增,雾霾天气过程出现次数呈幂函数形式迅速递减;西安区域雾霾现象日数分布呈城区多发,近郊次之,远郊最少的特征;随着日均相对湿度的逐渐增大,西安市雾霾天气的出现几率呈先增大后减小的趋势;西安市出现的能见度介于1-10 km的雾霾现象中,仅有10.7%属于轻雾,其余的均为霾;气温越低,日平均风速越小(静风或风速≤2.0 m·s^-1),14时出现负变压或正变温,连续不降水日数越长时,越有利于雾霾天气的形成.
The changes of mist and haze days and meteorological element during 1960-2012 in Xi’an .
利用1960—2012年西安区域7个气象站的历史地面观测资料,统计分析了西安区域能见度介于1-10 km的雾霾天气现象的长期气候变化及空间分布特征.结果发现,能见度介于1-10 km的雾霾日发生数存在准7-9年周期震荡,每7-9年形成一个峰型.同时还分析了能见度介于1-10 km的雾霾天气时的气象要素变化规律及相关关系.研究表明,53年来西安区域雾霾现象日数的波动性增加趋势非常明显;雾霾现象各月日数年内基本呈单谷型分布,雾霾现象最多出现于冬季,夏季出现概率较小;随着雾霾持续日数的递增,雾霾天气过程出现次数呈幂函数形式迅速递减;西安区域雾霾现象日数分布呈城区多发,近郊次之,远郊最少的特征;随着日均相对湿度的逐渐增大,西安市雾霾天气的出现几率呈先增大后减小的趋势;西安市出现的能见度介于1-10 km的雾霾现象中,仅有10.7%属于轻雾,其余的均为霾;气温越低,日平均风速越小(静风或风速≤2.0 m·s^-1),14时出现负变压或正变温,连续不降水日数越长时,越有利于雾霾天气的形成.
|
| [21] |
1965-2013年黄土高原地区极端气温趋势变化及空间差异 [J].https://doi.org/10.11821/dlyj201604004 URL [本文引用: 1] 摘要
基于黄土高原地区52个气象站点逐日平均气温、最高和最低气温数据,采用一元线性趋势分析、相关分析等方法,分析该地区极端气温趋势变化及空间差异。结果表明:1日最高(低)气温极低值、日最高(低)气温极高值、热夜日数、暖昼(夜)日数、热持续日数、夏季日数和生物生长季日数呈增加的趋势,其余极端气温指数呈减小的趋势。2空间分布上,表征低温事件的冰冻日数、霜冻日数、冷昼(夜)日数和冷持续日数下降最显著的区域位于黄土高原北部;表征高温事件的热夜日数、夏季日数、暖昼(夜)日数和热持续日数上升最显著的区域主要位于黄土高原西北部;生物生长季日数上升最显著的区域主要位于黄土高原中部地区。3相关分析表明除了极值指数和气温日较差与其余极端气温指数相关性较差外,其余各极端气温指数之间均具有较好的相关性。4多数极端气温指数的变化趋势与平均气温关系密切,平均气温突变前后极端气温指数存在明显差异。5 Hurst指数结果表明黄土高原地区极端气温变化均呈同向变化特征。
Trend variations and spatial difference of extreme air temperature events in the Loess Plateau from 1965 to 2013 .https://doi.org/10.11821/dlyj201604004 URL [本文引用: 1] 摘要
基于黄土高原地区52个气象站点逐日平均气温、最高和最低气温数据,采用一元线性趋势分析、相关分析等方法,分析该地区极端气温趋势变化及空间差异。结果表明:1日最高(低)气温极低值、日最高(低)气温极高值、热夜日数、暖昼(夜)日数、热持续日数、夏季日数和生物生长季日数呈增加的趋势,其余极端气温指数呈减小的趋势。2空间分布上,表征低温事件的冰冻日数、霜冻日数、冷昼(夜)日数和冷持续日数下降最显著的区域位于黄土高原北部;表征高温事件的热夜日数、夏季日数、暖昼(夜)日数和热持续日数上升最显著的区域主要位于黄土高原西北部;生物生长季日数上升最显著的区域主要位于黄土高原中部地区。3相关分析表明除了极值指数和气温日较差与其余极端气温指数相关性较差外,其余各极端气温指数之间均具有较好的相关性。4多数极端气温指数的变化趋势与平均气温关系密切,平均气温突变前后极端气温指数存在明显差异。5 Hurst指数结果表明黄土高原地区极端气温变化均呈同向变化特征。
|
| [22] |
近60年西安市极端气温事件变化特征分析 [J].
分析西安市近60年极端温度事件的变化特征以及极端温度指数与气温的关系。选取1951—2010年西安市逐日平均气温、日最高气温以及日最低气温资料,采用世界气象组织(WMO)公布的极端温度指数,利用Mann-Kendall(M-K)方法进行极端气温事件分析。认为近60年来,西安年平均气温、年平均最低气温、年平均最高气温呈上升趋势,20世纪90年代增温尤为明显;3种气温的变化趋势除夏季平均最高气温呈下降趋势外,各季节均为上升趋势;年平均气温与极端气温指数之间存在明显的相关性;暖夜日数和暖昼日数呈上升趋势,而霜冻日数、冷夜指数和冷昼日数呈下降趋势,冷夜指数减小、暖夜指数增大的幅度远大于冷昼日数减少的幅度,夜间气温的上升对增暖的贡献更大;极端气温指数的变化存在明显的年际变化特征,并伴有突变发生,西安市气温升高主要发生在20世纪90年代初期。
Characteristics of extreme temperature events in Xi’an for the latest 60 years .
分析西安市近60年极端温度事件的变化特征以及极端温度指数与气温的关系。选取1951—2010年西安市逐日平均气温、日最高气温以及日最低气温资料,采用世界气象组织(WMO)公布的极端温度指数,利用Mann-Kendall(M-K)方法进行极端气温事件分析。认为近60年来,西安年平均气温、年平均最低气温、年平均最高气温呈上升趋势,20世纪90年代增温尤为明显;3种气温的变化趋势除夏季平均最高气温呈下降趋势外,各季节均为上升趋势;年平均气温与极端气温指数之间存在明显的相关性;暖夜日数和暖昼日数呈上升趋势,而霜冻日数、冷夜指数和冷昼日数呈下降趋势,冷夜指数减小、暖夜指数增大的幅度远大于冷昼日数减少的幅度,夜间气温的上升对增暖的贡献更大;极端气温指数的变化存在明显的年际变化特征,并伴有突变发生,西安市气温升高主要发生在20世纪90年代初期。
|
| [23] |
Recent trends in daily temperature extremes over northeastern China (1960-2011) [J].https://doi.org/10.1016/j.quaint.2014.09.010 URL [本文引用: 1] 摘要
Based on long-term, high-quality, and homogenous daily maximum and minimum temperature of 70 meteorological stations spanning the period from 1960 to 2011, the spatial and temporal characteristics of extreme temperature events in northeastern China have been investigated. A total of 14 indices are used to assess changes in extreme temperature distributions. All the temperature-based indices show patterns consistent with a general warming trend. The regional occurrence of the increase in warm nights (TN90p: 2.1702days/decade) and warm days (TX90p: 0.9702days/decade), and decrease in cool nights (TN10p:02611.8002days/decade) and cool days (TXx:02610.8602days/decade) was detected in the past 52 years. Moreover, the trend magnitudes in cold/warm nights are larger than those in cold/warm days, which indicate that trends in minimum temperature extremes are more rapid than trends in maximum temperature extremes, consistent with a long-term decrease in DTR. The other indices, including TNn, TNx, SU25, TR20, FD0, ID0, GSL, and DTR, show statistically significant changes except for Maximum and minimum values of maximum daily temperatures (TXx and TXn) which have statistically insignificant slopes at individual stations and in regional mean trend. For the majority of stations, significant increases are detected for heat related extremes such as summer days and tropical nights (SU25 and TR20) as well as for maximum and minimum values of minimum daily temperatures (TNn and TNx); With the exception of diurnal temperature range (DTR) and maximum daily maximum temperature (TXx), the other indices strongly correlate with annual mean temperature. In addition, there are high correlations among warm indices and among cold ones, respectively.
|
| [24] |
Analysis of extreme temperature events in the Qinling Mountains and surrounding area during 1960-2012 [J].https://doi.org/10.1016/j.quaint.2015.04.018 URL [本文引用: 1] 摘要
In this study, 16 indices of extreme temperature were calculated on the basis of daily maximum and minimum temperature data in the northern and southern regions of the Qinling Mountains (NSQ) using linear trend and correlation analysis and other methods to investigate the temporal variation trend, spatial distribution pattern and correlation of extreme temperature events. The results are as follows. (1) The extreme cold and warm indices exhibited contrasting variation trends over the entire region: the cold indices (TX10, TN10, ID, FD and CSDI) decreased; the warm indices (TX90, TN90, SU, TR and WSDI) increased; the extremal indices (TXn, TNn, TXx and TXn) increased; and the diurnal temperature range (DTR) decreased. (2) The absolute indices, extremal indices and other indices showed a certain latitudinal zonality: ice days (ID) and frost days (FD) decreased from north to south, while summer days (SU), tropical nights (TR), extremal indices (TXn, TNn, TXx and TXn), the cold and warm spell duration indicators (CSDI and WSDI, respectively) and growing season length (GSL) increased from north to south. (3) The correlation analysis results showed that, except for the extremal indices and individual indices, the extreme temperature indices correlated well. (4) The altitude has a large impact on spatial distribution of extreme temperature indices, and the ubiquity of the heat island effect in urban constructed regions also had an impact on amplitude of variation in extreme temperature.
|
| [25] |
Changes in temperature and precipitation extreme indices over China: analysis of a high-resolution grid dataset [J].https://doi.org/10.1002/joc.4400 URL [本文引用: 1] 摘要
ABSTRACT Based on the high-resolution gridding data (CN05) from 2416 station observations, a grid dataset of temperature and precipitation extreme indices with the resolution of 0.5°65×650.5° for China region was developed using the approach recommended by the Expert Team on Climate Change Detection and Indices. This article comprehensively presents temporal and spatial changes of these indices for the time period 1961–2010. Results showed widespread significant changes in temperature extremes consistent with warming, for instance, decreases in cold extremes and increases in warm extremes over China. The warming in the coldest day and night is larger than the warmest day and night, respectively, which is concurrent with the coldest night larger than the coldest day and the warmest night larger than the warmest day. Changes in the number of the cold and warm nights are more remarkable than the cold and warm days. Changes in precipitation extremes are, in general, spatially more complex and exhibit a less widespread spatial coverage than the temperature indices, for instance, the patterns of annual total precipitation amount, average daily precipitation rate, and the proportion of heavy precipitation in total annual precipitation are similar with negative trends in a southwest–northeast belt from Southwest China to Northeast China while positive trends in eastern China and northwestern China. The consistency of changes in climate extremes from the CN05 with other datasets based on the stations and reanalyses is also analysed.
|
| [26] |
Global land-based datasets for monitoring climatic extremes [J].https://doi.org/10.1175/BAMS-D-12-00109.1 URL [本文引用: 1] 摘要
The World Meteorological Organization (WMO) Commission for Climatology (CCl)/CLIVAR/JCOMM Expert Team on Climate Change Detection and Indices (ETCCDI) held a number of regional workshops whose data were used to help create HadEX, the first global land-based, gridded dataset of temperature and precipitation extremes. Experts from ETCCDI developed a new dataset to address the issues of HadEX, using the world's largest repository of daily in situ observations of temperature and precipitation. The resulting dataset was known as GHCNDEX, which was an operationally updated, global land gridded dataset of climate extremes. The experts also demonstrated the application of the dataset for climate change and climate monitoring purposes in addition to assessing some issues regarding uncertainty by comparing the results with existing datasets.
|
| [27] |
Employing an urban meteorological network to monitor air temperature conditions in the ‘local climate zones’ of Szeged, Hungary [J]. |

/
| 〈 |
|
〉 |

