刘星才 , 汤秋鸿, 尹圆圆
Liu Xingcai, Tang Qiuhong, Yin Yuanyuan
中图分类号: P96
文献标识码: A
文章编号: 1000-0690(2018)04-0636-09
通讯作者:
收稿日期: 2017-03-13
修回日期: 2017-07-20
网络出版日期: 2018-04-20
版权声明: 2018 《地理科学》编辑部 本文是开放获取期刊文献,在以下情况下可以自由使用:学术研究、学术交流、科研教学等,但不允许用于商业目的.
基金资助:
作者简介:
作者简介:刘星才(1984-),男,江西吉安人,助理研究员,主要从事陆地水循环和气候变化研究。E-mail: xingcailiu@igsnrr.ac.cn
展开
摘要
综合环境风险区划是变化环境下开展综合防灾减灾工作的基础,对于综合风险防范措施的制定具有指导意义。以农业、生态和人群3个系统为主要受灾体,从作物产量、生态系统变迁、高温热浪对人群的影响3个方面综合评估了4种典型浓度路径(Representative Concentration Pathways)RCP2.6、RCP4.5、RCP6.0和RCP8.5情景下21世纪末期(2071~2099年)的中国综合环境风险,并以RCP8.5情景为例编制了未来综合环境风险区划。结果表明,该时期中国综合环境风险主要出现在黄淮海地区、华南部分地区和青藏高原部分地区。综合环境风险区划共分为6个一级区和43个二级区;一级区分别为西北低风险区、东北生态较低风险区、青藏高原生态中度风险区、晋陕生态-农业中度风险区、华南农业高风险区、黄淮海农业-热浪高风险区。
关键词:
Abstract
Environmental risks, such as crop failure, mortality and vegetation deterioration caused by warming, drought, flood, heatwave, etc., tend to be more complex and interactive with each other. Integrated Environmental Risk Regionalization becomes the fundament for multi-hazard prevention and reduction under a changing environment. Regarding potential large losses from the agricultural system, ecosystem, and human being caused by climate change, we assessed the integrated environmental risk based on the crop yield changes, ecosystem shift and mortality by heatwave in China during the late 21st century (2071-2099) under four Representative Concentration Pathways (RCP2.6, RCP4.5, RCP6.0, and RCP8.5). Bias-corrected projections of future climate change were derived from five generic circulation model. Four major crops (rice, wheat, maize, and soybean) were considered, and the crop yield changes were projected by four global gridded crop models. The changes of crop yield during 2071-2099 compared to the period of 1980-2010 were computed to identify the risk in agricultural system. The Γ metric was used to assess the risk of ecosystem shift under climate change. The Γ metric describes the ecosystem state and its changes based on a set of macroscopic variables derived from four global gridded vegetation models. The larger Γ, changes in ecosystem state variables, indicates the larger risk of ecosystem shift in future. A heatwave event was identified by three successive days of high temperature that >35 °C. The mortality rate caused by heatwave events was estimated by the difference of mortality rate in a period with high-temperature and that in non-high-temperature days of the year. Regression was established between heatwave events and mortality rates. It was then used for estimation of mortality rate in the 2071-2099 period. These environmental risks were combined by a multi-risk index (IERI) to illustrate the integrated environmental risk in the future. In this study, the same weights were set for all environmental risks in the IERI calculation. The IERI was calculated at a spatial resolution of 0.5° for the 2071-2099 period under the four RCPs. The results showed that high integrated environmental risks will appear in the Huang-Huai-Hai region, relatively high integrated environmental risks will appear in the South China, and moderate integrated environmental risks will occur in the Tibet region. The integrated environmental risk regions (IERR) were then delineated based on the assessment. Six IERRs were identified for China, i.e., Northwest-Low-Risk region, Northeast-Relatively-Low-Risk region, Tibet-Moderate-Risk region, Jin-Shaan-Moderate-Risk region, South-China-High-Risk region, and Huang-Huai-Hai-High-Risk region. Fourty-two sub regions were further divided upon the six IERRs. Due to largely different environmental conditions of the six IERRs, they include quite different numbers of sub regions, namely 2, 6, 8, 7, 10, and 9 subregions, respectively. Though many environmental risks caused by climate change were not included in this assessment, the preliminary integrated environmental risk regionalization would be a reference for decision makers and future studies.
Keywords:
综合环境风险是以自然和人类社会为主要受灾体,综合考虑多种灾害发生概率及其危害程度,综合评估多种灾害给受灾体带来的损失[1]。综合环境风险区划是基于一定的区划原则和方法,在综合环境风险评估的基础上,对研究区进行的区域划分,以减轻环境风险和实现区域可持续发展为目的,对制定综合防灾减灾对策具有指导意义[2]。综合环境风险区划,按分类单元在空间上的连续性,包括区域区划和类型区划。本研究提及的区划为区域区划,即每一分类单位在地域上相连,且空间上不可重复[3]。中国学者先后开展了大量的自然灾害区划研究[4]。已有自然灾害区划包括如下两类:① 针对某一部门的自然灾害区划,如全国农业自然灾害综合区划[5,6,7],中国城市自然灾害区划[8,9],中国粮食产量风险区划[10];② 针对某一灾种的自然灾害区划,如中国洪水灾害危险程度区划[11,12,13,14,15]。
迄今为止,面向未来的综合风险评估及相应的区划研究依然少见。随着社会经济的发展,现代环境风险表现出更明显的综合性和复杂性[16,17]。但由于不同灾害之间的相互作用和影响,多灾害之间的转化也容易带来不可预料的风险和困难,单一灾种的评估和区划往往难以全面反映灾害带来的环境风险[18,19,20]。现代风险具有显著的影响范围广、高度不确定、综合性突出、破坏力强等特点,且风险形成机制复杂,不易预测[16]。因此,面对现代环境风险,全球和各国都非常有必要采用综合思想、技术和管理手段进行风险防范和管理。
气候变化是近几十年来自然灾害主要诱因之一,其带来的各种自然灾害对中国和全球社会经济均造成了巨大损失[21,22,23]。未来气候变化可能进一步增加受灾体面对多种风险的暴露度,影响灾害发生频率、危害程度和波及范围[24]。本文在国家重点基础研究发展计划——全球变化与环境风险关系及其适应性范式研究的支持下,通过预估未来气候变化、评估气候变化带来的环境风险对自然和人类社会的负面影响,开展了中国未来综合环境风险区划研究,以期为应对和防范气候变化带来的环境风险提供基础。
本文针对农业、生态系统和社会3个重要的受灾体,分别从作物产量、生态系统变迁以及高温热浪对人群的影响3方面开展风险评估。农业风险评估主要基于中国4种主要农作物的产量变化:水稻(Oryza sativa)、小麦(Triticum aestivum)、玉米(Zea mays)和大豆(Glycine max)[25];作物产量是反映农业生产系统状况的重要指标。生态系统变迁风险主要基于生态系统状态的稳定性[26],采用Γ指数来描述[27],该指标可以有效评估生态系统健康状况及其变化。高温热浪风险基于未来高温热浪事件致死可能性估计[28];高温热浪的危害是气候变化直接影响高密度人群地区(如城市)的人类生活甚至生命的主要方面。农业、生态系统和高温热浪3种环境风险的评估均采用了4种排放情景(Representative Concentration Pathways,RCP)下5个气候模式(General Circulation Model,GCM)的气候输出数据。4种排放情景为RCP2.6、RCP4.5、RCP6.0和RCP8.5,5个GCM分别是GFDL-ESM2M、HadGEM2-ES、IPSL-CM5A-LR、MIROC-ESM-CHEM、NorESM1-M。本文所有风险评估均在0.5度空间网格上开展,评估时段为21世纪末期(2071~2099年);单种环境风险的评估已在相应文献详细说明[25, 26, 28],此处仅简要叙述其评估方法。
1) 农业风险预估。基于5个气候模式输出结果驱动下的6个全球网格化作物模型(EPIC、GEPIC、IMAGE、LPJ-GUESS、pDSSAT和PEGASUS)的模拟结果,估算气候变化对未来中国主要农作物产量的变化,评估结果采用多模型中值[25]。以1980~2010年为基准期,计算未来农作物产量的相对变化,根据相对变化(MR,减产或增产程度)定义农业风险:MR>0为无风险,-5%<MR≤0为较低,-10%<MR≤-5%为低,-15%<MR≤-10%为中,-20%<MR≤-15%,MR≤-20%为极高。
2) 生态风险预估。基于5个气候模式输出结果驱动下的4个全球网格化植被模型(JeDi、JULES、LPJmL和VISIT)的模拟结果,采用综合考虑碳通量、碳储量和水通量变化的自然生态系统迁移指数[27]为指标,评估了不同RCP情景下中国自然生态系统的气候变化风险[26]。计算公式如公式1。生态风险等级定义如下:0≤Γ<0.1为较低风险;0.1≤Γ<0.2为低风险;0.2≤Γ<0.3为中风险;0.3≤Γ<0.4为高风险;0.4≤Γ为极高风险。
式中,Γ为生态风险指数(0~1),ΔV为植被结构变化,c为网格内生态系统变化,g为网格相对于整个研究区的生态系统变化,b为生态系统要素相对变化程度,S(x, σx)为c、g和b的年际变化。
3) 热浪风险预估。采用相对阈值与绝对阈值相结合的方法来设置热浪的临界温度值,即至少持续3 d,日最高温度不低于基准期(1980~2010年)的95百分位温度值,且不低于32℃。结合调查资料和已有研究分析夏季高温热浪期间气温与同期死亡率相对平均状态下增量之间的关系曲线,推断气候变化下人群相对热浪的脆弱性程度及其空间分布格局[28]。
综合环境风险评估是综合环境风险区划的基础,一般包括如下几个方面:灾害评估、多灾害评估、暴露度评估、脆弱性评估、多灾害风险评估。1970年以来,各国学者逐步开展多灾害风险的综合评估研究[29, 30]。不同研究中由于服务对象或研究目标的差异,所采用的评估方法略有不同。当前综合环境风险评估通常采用综合指数法对多种灾害的影响进行定量化。例如,联合国开发计划署(United Nations Development Programme, UNDP)采用灾害风险指数(Disaster Risk Index)评估国家尺度上多种灾害带来的人群死亡风险[31]。欧盟国家采用空间相关的多灾害风险综合指标用于欧洲地区综合风险及其空间特征评估[32]。多灾害风险综合指标一般有以下特征:①面向多种灾害,需要考虑多领域/部门的风险;②只关注空间上存在相关性的灾害风险,但对于空间相关较大的传染病以及相对单一的交通事故等灾害风险暂时不予考虑;③只关注对集体/人群造成危害的集合风险,对于个体所承受的风险不予考虑。Shi等[33] 提出了多灾害指数和多灾害风险指数分别对全球洪水、干旱、地震、台风等12种灾害及其风险进行了综合评估。
针对气候变化影响下社会经济、自然生态和人群等不同受灾体,本文在农业[25]、生态系统[26]和高温热浪[28]3种环境风险评估基础上,参考Shi等[33]多灾害风险指数估算了气候变化下的综合环境风险:
式中,IERI为综合环境风险指数,ri是第i种灾害风险水平,n为风险种类数,wi是第i种灾害风险水平的权重(本文使用等权重进行计算)。综合环境风险分为5级,≤1表示极低风险,≥5表示极高风险。
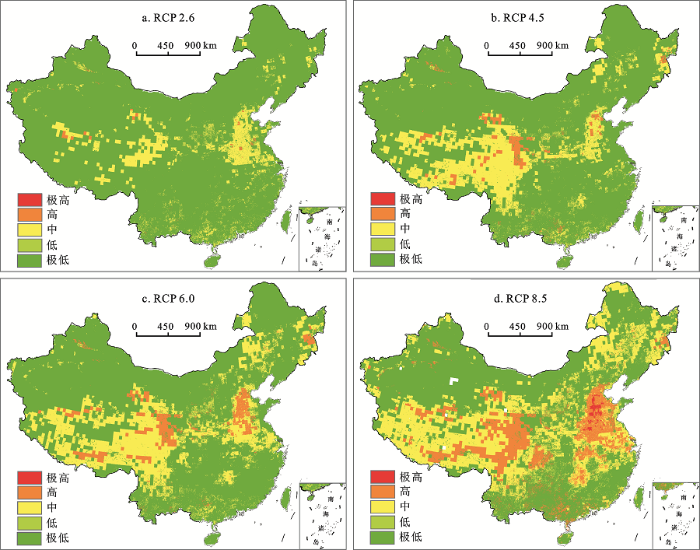
本文根据综合环境风险评估结果(图1),参考Shi 等[34]区划原则和“自上而下”的方法进行综合环境风险一级区划分。具体步骤如下:①根据综合环境风险评估结果确定气候变化敏感区域,如青藏高原地区和黄淮海平原,这类区域表现出对气候变化显著的响应,而且在空间上有较好的连续性,易于识别;②明确其他综合环境风险空间不连续范围,根据空间连续性和取大去小原则,采用“自上而下”方法确定各个分区边界;③根据主导因素原则确定各个分区的主要环境风险及其程度;④结合各个分区所在的地理或行政区划位置,确定分区名称和内涵。
图1 21世纪末期(2071~2099年)中国陆域综合环境风险预估结果
Fig.1 Integrated environmental risk of China in 2071-2099
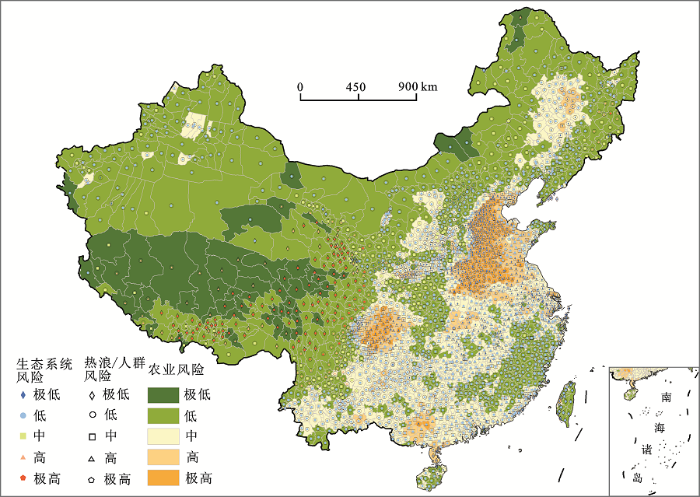
根据环境风险特征,采用“自下而上”的方法将每个综合环境风险一级区进一步划分为多个二级区,以便更有针对性地进行气候变化影响应对和防范。首先将网格尺度的风险评估转换成县(市)级单元评估结果(图2),通过对农业、生态和高温热浪风险评估结果叠加分析,由多个具有相似风险特征的县(市)合并得到综合环境风险二级区。将农业、生态系统和高温热浪3种主要环境风险均划分为5个等级,即极低、低、中、高、极高风险,3种风险等级相同或相似的区域即为综合风险二级区。为了防止二级区过多过于零碎,合并过程中会适当地包含周边零散的、至少两种风险等级与主要区域相同的县(市);上述条件均不满足,且面积过小不宜划分为一个二级区时,将其合并到周边主要风险等级相差一级的二级区。综合环境风险二级区以主要环境风险等级命名。
图2 RCP8.5情景下以县/市为单元的气候变化风险评估结果(2071~2099年)
Fig.2 Environmental risk for counties of China under RCP8.5 during 2071-2099
基于前述3种[25, 26, 28]的风险评估结果,利用综合环境风险指数(式2),评估了2071~2099年4种气候变化情景(RCP2.6、RCP4.5、RCP6.0和RCP8.5)下的中国综合环境风险(图1)。同时,将3种风险叠加显示,以明确不同区域的主导环境风险(图2)。采用前述综合与主导相结合的原则确定综合环境风险区域特征及风险程度。综合环境风险分为10级,其中1级最低、10级最高。总体来看,RCP2.6情景下中国综合环境风险最低,RCP8.5情景下风险最高。综合环境风险主要集中在气候变化敏感区,如黄淮海平原、青藏高原地区等。黄淮海平原地区农业生产发达、人口密集,尤其是淮河以北地区,水资源比较匮乏,农业发展面临较大的风险[35]。青藏高原地区是中国另一个重要的气候变化敏感区,该地区的气候变暖往往早于中国甚至全球其他地区,升温幅度也大于全球平均水平[36]。
RCP2.6情景下,综合环境风险主要集中在气候变化敏感区域,如黄淮海平原部分地区存在低风险(图1a);青藏高原地区人烟稀少,自然环境独特,其面临的主要环境风险是气候变化下生态系统变迁的风险[26]。
RCP4.5情景下,中国西部地区的综合环境风险有一定程度增加,尤其是青藏高原地区,部分综合环境风险达到中度水平,风险范围也扩大至高原东部边缘地区(图1b);甘肃和青海部分地区、黄河上游地区也存在低度风险。西部地区人口密度相对较低,主要表现为生态系统和农业风险。由于气温上升、大气CO2浓度上升在一定程度上对作物/植物生长有一定促进作用[37],黄淮海地区综合环境风险在该情景下相对略有收缩,风险主要出现在华北平原,包括河北、山东与河南部分地区。华北平原地区一直以来受水资源短缺问题影响,全球变暖又增加了高温热浪风险[38, 39]。珠江流域少部分地区也开始出现较轻度的综合环境风险,主要是南方地区高温增加导致作物生长受到较大影响。
RCP6.0情景下(图1c),中国西部、黄淮海平原以及东北地区综合环境风险均有增加。其中,青藏高原地区综合环境风险级别更高,范围向周边扩大,甚至延伸到云南、四川等地区。黄淮海平原地区也有类似变化,部分地区综合风险为中度,主要是农业和高温热浪风险。东北地区综合环境风险增加区域主要在黑龙江东部和内蒙古东部地区,主要是农业和生态系统风险。
RCP8.5情景下(图1d),综合环境风险显著增加,尤其是黄淮海平原,大部分地区处于高风险水平;与黄淮海平原相邻的长江中下游地区也出现了较明显的综合环境风险。青藏高原地区大部分地区综合环境风险依然处于低风险、部分地区达中度风险水平,但风险波及范围进一步往周边扩大。东北地区综合环境风险范围略有扩大,少部分地区有中度风险。值得注意的是,四川盆地和珠江流域均出现了中度的风险。此外,晋陕甘部分地区也存在一定程度的综合环境风险。RCP8.5情景气温升高明显,因此中国南部和东部大部分地区都面临较大的高温热浪和农业风险,青藏高原等高寒地区面临巨大的生态变迁压力。
图2显示了以县(市)为单元的气候变化下农业、生态系统和高温热浪风险评估结果。县(市)评估结果由网格平均得到,并将环境风险等级合并为5个,保留相似的空间分布。图2综合展示了各个地区在气候变化影响下的3种环境风险及其程度,有助于明确综合环境风险一级分区的主导环境风险以及进一步划分综合环境风险二级分区。
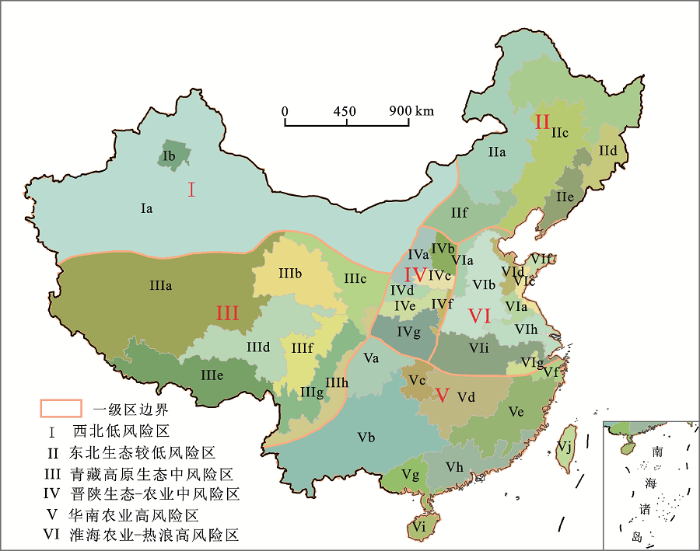
依据2.2所述综合环境风险区划方法,在图1d基础上将全国划分为6个综合环境风险一级区(表1),根据图2再划分出43个二级区(表2)。6个一级区分别命名为西北低风险区、东北生态较低风险区、青藏高原生态中度风险区、晋陕生态-农业中度风险区、华南农业高风险区、黄淮海农业-热浪高风险区(图3)。本文在综合环境风险区划过程中也考虑了各区的社会经济条件。尽管气候变化将给西北地区农作物单产带来一定负面影响,但由于该地区农业面积所占比例很小,因此本文将该地区归为气候变化低风险区。一级区命名规则采用“地名+主要风险及程度”形式并结合图1d和图2信息确定,二级区命名采用三种风险程度组合形式,便于识别区域主要环境风险特征。各一级区特征简要描述见表1;由于区域环境特征的差异,各一级区包含的二级区数量差别较大,分别包含有2、6、8、7、10和10个。
表1 综合环境风险区划特征
Table 1 Characteristics of integrated environmental risk zones
| 综合环境风险区a | 特征b | 主要环境风险 |
|---|---|---|
| 西北低风险区(2) | 气候干燥、降水很少,地表覆盖以荒漠/沙漠为主,有少量绿洲,人口密度很低,农业很少;未来气温上升约5.7℃,降水增加约15.6% | 有轻度农业风险,但面积较少,总体风险低 |
| 东北生态较低风险区(6) | 处于高纬度地区,气温较低,属于半湿润/半干旱地区;植被以草地和森林为主;农业较为发达,是中国主要粮食产地之一,人口密度中等;未来气温上升约5.75℃,降水增加约16% | 以农业和生态风险为主,两种风险均分布不广,程度中等或偏低 |
| 青藏高原生态中度风险区(8) | 自然地理环境独特,海拔高、气温低,冰雪覆盖面积较大,是中国重要河流发源地;植被以高寒草地草甸为主,生态系统相对较为脆弱;人口稀少,农业极少;未来气温上升约5.5℃,降水增加约22% | 以生态风险为主,程度中等、少部分地区偏高 |
| 晋陕生态-农业中度风险区(7) | 黄土高原和太行山脉山区,大部分属于半干旱地区;植被覆盖较少,部分为人工植被;农业较发达,人口密度中等;未来气温上升约4.9℃,降水增加约16.5% | 以农业和生态风险为主,程度中等 |
| 华南农业高风险区(10) | 南方湿润地区,覆盖了长江中下游大部、珠江流域和东南沿海地区;气温较高,水量丰沛;植被覆盖好;农业发达,是中国主要粮食产区之一;人口密度高;未来气温上升约4.6℃,降水增加约7% | 以农业风险为主,主要在珠江流域,程度偏高;部分地区有较中低程度的高温热浪风险 |
| 黄淮海农业-热浪高风险区(10) | 主要为黄淮海平原,覆盖黄河下游、淮河与海河大部分地区,属于半干旱/半湿润地区;农业发达,中国主要粮食产区之一,人口密度高;未来气温上升约5℃,降水增加约11% | 以农业风险和高温热浪风险为主,程度都偏高 |
表2 综合环境风险二级区
Table 2 Subregions of Integrated Environmental Risk Zones
| 代码 | 二级区名称 | 代码 | 二级区名称 |
|---|---|---|---|
| Ia | 农业低风险-生态低风险-热浪低风险区 | IVg | 农业低风险-生态中低风险-热浪低风险区 |
| Ib | 农业中风险-生态低风险-热浪低风险区 | Va | 农业高风险-生态极低风险-热浪高风险区 |
| IIa | 农业低风险-生态中风险-热浪低风险区 | Vb | 农业中风险-生态低风险-热浪低风险区 |
| IIb | 农业低风险-生态低风险-热浪低风险区 | Vc | 农业极低风险-生态低风险-热浪低风险区 |
| IIc | 农业中风险-生态低风险-热浪低风险区 | Vd | 农业中风险-生态低风险-热浪极高风险区 |
| IId | 农业低风险-生态高风险-热浪低风险区 | Ve | 农业低风险-生态中低风险-热浪中低风险区 |
| IIe | 农业低风险-生态低风险-热浪中风险区 | Vf | 农业中风险-生态低风险-热浪高风险区 |
| IIf | 农业低风险-生态极低风险-热浪低风险区 | Vg | 农业高风险-生态低风险-热浪中风险区 |
| IIIa | 农业极低风险-生态高风险-热浪极低风险区 | Vh | 农业中风险-生态低风险-热浪中高风险区 |
| IIIb | 农业低风险-生态极高风险-热浪低风险区 | Vi | 农业中低风险-生态低风险-热浪低风险区 |
| IIIc | 农业低风险-生态中低风险-热浪低风险区 | Vj | 农业低风险-生态低风险-热浪极低风险区 |
| IIId | 农业极低风险-生态极高风险-热浪极低风险区 | VIa | 农业中风险-生态低风险-热浪中高风险区 |
| IIIe | 农业低风险-生态极高风险-热浪极低风险区 | VIb | 农业极高风险-生态极低风险-热浪极高风险区 |
| IIIf | 农业低风险-生态高风险-热浪极低风险区 | VIc | 农业高风险-生态极低风险-热浪中高风险区 |
| IIIg | 农业低风险-生态高风险-热浪低风险区 | VId | 农业高风险-生态低风险-热浪高风险区 |
| IIIh | 农业中低风险-生态中低风险-热浪低风险区 | VIe | 农业中风险-生态低风险-热浪中风险区 |
| IVa | 农业中风险-生态低风险-热浪低风险区 | VIf | 农业低风险-生态低风险-热浪低风险区 |
| IVb | 农业低风险-生态低风险-热浪低风险区 | VIg | 农业高风险-生态极低风险-热浪高风险区 |
| IVc | 农业中风险-生态中风险-热浪低风险区 | VIh | 农业中风险-生态极低风险-热浪极高风险区 |
| IVd | 农业中低风险-生态中低风险-热浪低风险区 | VIi | 农业中风险-生态低风险-热浪高风险区 |
| IVe | 农业中风险-生态极低风险-热浪中风险区 | VIj | 农业极低风险-生态低风险-热浪中风险区 |
| IVf | 农业中风险-生态低风险-热浪高风险区 |
图3 2071~2099年RCP8.5情景下中国陆域综合环境风险区划
Fig.3 Regionalization of integrated environmental risk under RCP8.5 in China during 2071-2099
本文基于多模式多情景的未来气候变化预估数据和影响评估模拟数据,对中国未来综合环境风险进行了分析。不同情景下的综合风险评估表明,21世纪末期(2071~2099),中国综合环境风险从高到低依次为RCP8.5、RCP6.0、RCP4.5和RCP2.6。在RCP8.5情景下,中国综合环境高风险主要出现在黄淮海平原地区和华南部分地区;青藏高原及周边地区和晋陕甘地区也会出现中等程度的风险。本文以RCP8.5情景为例,根据综合环境风险评估结果编制了气候变化背景下中国未来综合环境风险区划,将全国分为6个一级区和43个二级区;分区尽量保持了行政边界完整性,对气候变化下的环境风险应对和防范措施制定有一定参考意义。
由于数据和评估方法的限制,本研究的风险评估和区划还存在一定的不足,主要表现在以下2个方面。
1) 风险评估和区划的不确定性。本文主要基于未来气候变化预估及其影响模拟,因此,综合环境风险评估和区划都存在较大不确定性。不确定性主要来自以下方面:① 未来气候要素变化(如气温上升幅度、降水变化)的预估不确定性较大,尤其是区域特征,不同的GCM之间有较大差异[40];② 不同影响评估模型对农作物产量[25]、生态系统变化[26]以及高温热浪的影响[28]等模拟存在显著的不确定性;③综合环境风险评估采用了等权重方法,这也会带来一定的不确定性。
2) 综合风险指标的局限性。本文综合环境风险区划目前只考虑了气候变化对农业、生态系统和高温热浪3个方面的影响,分别对应农业、生态系统、自然生态系统和人群,对于社会经济发展可能受到的影响没有进行评估。因此,该综合环境风险评估和区划还只是表现了气候变化给经济社会带来的部分风险。此外,本文综合风险指标计算采用了等权重方法,是否需要给不同风险赋予不同权重有待进一步探讨。未来气候变化对整个经济社会系统的影响及其带来的风险需要更加综合全面的模拟和评估[41,42],如对气候变化—水—能源—粮食等关系链的表达和模拟[43]。将来的研究中有必要加强气候变化对经济社会系统的影响评估,并据此制定相应的风险区划方案。
致谢:感谢中国科学院地理科学与资源研究所吴绍洪研究员给本文提供的宝贵建议。
The authors have declared that no competing interests exist.
| [1] |
|
| [2] |
重特大自然灾害综合评估 [J].https://doi.org/10.11820/dlkxjz.2014.09.001 URL Magsci [本文引用: 1] 摘要
基于作者近年对多次重特大自然灾害综合评估的实践,就重特大自然灾害的影响范围、破坏程度、直接经济损失的综合评估予以阐述。重特大自然灾害快速评估结果是制定应急救援、转移安置方案和恢复重建规划的科学依据。综合现场调查、遥感监测、模型评估和地方上报数据于一体,是提高重特大自然灾害评估结果准确度和精度的关键。制定科学合理的重特大自然灾害评估指标体系,仍然需要在大量综合评估的实践中完善。
Integrated assessment of large-scale natural disasters in China .https://doi.org/10.11820/dlkxjz.2014.09.001 URL Magsci [本文引用: 1] 摘要
基于作者近年对多次重特大自然灾害综合评估的实践,就重特大自然灾害的影响范围、破坏程度、直接经济损失的综合评估予以阐述。重特大自然灾害快速评估结果是制定应急救援、转移安置方案和恢复重建规划的科学依据。综合现场调查、遥感监测、模型评估和地方上报数据于一体,是提高重特大自然灾害评估结果准确度和精度的关键。制定科学合理的重特大自然灾害评估指标体系,仍然需要在大量综合评估的实践中完善。
|
| [3] |
中国综合自然区划的初步草案 [J].A preliminary draft of China integrated natural regionalization . |
| [4] |
|
| [5] |
中国农业自然灾害综合区划方案 [J].https://doi.org/10.3969/j.issn.1004-4574.2000.04.003 URL [本文引用: 1] 摘要
根据自然灾害系统理论,自然灾害的发生是以一定的孕灾大环境作为背景.地貌、水文、气候、植被、土壤等是组成自然综合体的要素.笔者提出了基于自然灾害基本单元进行自然灾害综合区划的原理和技术方法,选择全国l∶400万地貌类型图、1∶400万土壤类型图、全国县级行政界线图及中国自然灾害数据库省级报刊灾情库数据,进行全国农业自然灾害综合区划.
Comprehensive regionalization of agricultural natural disaster in China .https://doi.org/10.3969/j.issn.1004-4574.2000.04.003 URL [本文引用: 1] 摘要
根据自然灾害系统理论,自然灾害的发生是以一定的孕灾大环境作为背景.地貌、水文、气候、植被、土壤等是组成自然综合体的要素.笔者提出了基于自然灾害基本单元进行自然灾害综合区划的原理和技术方法,选择全国l∶400万地貌类型图、1∶400万土壤类型图、全国县级行政界线图及中国自然灾害数据库省级报刊灾情库数据,进行全国农业自然灾害综合区划.
|
| [6] |
我国农业自然灾害风险评估与区划 [J].https://doi.org/10.7621/cjarrp.1005-9121.20110306 URL [本文引用: 1] 摘要
利用基于灾情数据的评估方法对全国及31个省份的农业自然灾害风险进行评估,根据农作物灾害 风险的概率密度和累积分布函数计算其年均损失率,并据此进行区划。研究结果表明:(1)在我国31个省(市、自治区)中,有16个省份平均每年的农业因灾 损失率都在10%以上,全国农业因灾年均损失率为12.9%;(2)干旱和洪涝是导致我国农业损失的两个主要险种,分别占到总损失的51%和27%; (3)我国自然灾害各险种的高风险区均相对集中,建议政府采取针对性措施降低区域灾损风险。
Assessment and regional planning of Chinese agricultural natural disaster risks .https://doi.org/10.7621/cjarrp.1005-9121.20110306 URL [本文引用: 1] 摘要
利用基于灾情数据的评估方法对全国及31个省份的农业自然灾害风险进行评估,根据农作物灾害 风险的概率密度和累积分布函数计算其年均损失率,并据此进行区划。研究结果表明:(1)在我国31个省(市、自治区)中,有16个省份平均每年的农业因灾 损失率都在10%以上,全国农业因灾年均损失率为12.9%;(2)干旱和洪涝是导致我国农业损失的两个主要险种,分别占到总损失的51%和27%; (3)我国自然灾害各险种的高风险区均相对集中,建议政府采取针对性措施降低区域灾损风险。
|
| [7] |
Risk assessment to China’s agricultural drought disaster in county unit [J].https://doi.org/10.1007/s11069-011-0066-4 URL [本文引用: 1] 摘要
China faces drought disaster risk under the changing climate. Risk analysis is a suitable approach in order to design ex-ante measure able to anticipate effects of drought on agricultural production. In this article, with the support of historic drought disaster data from 583 agro-meteorological observations (1991–2009), a risk analysis method based on information diffusion theory was applied to create a new drought risk analysis model, and the risk of China’s agriculture drought disaster was evaluated on higher spatial resolution of county unit. The results show that in more than three hundred counties of China, risk probability was biyearly or annually when Drought Affected Index (DAI) was over 5%. When DAI was up to 40%, more than one hundred counties were prone to drought disaster annually or once every 502years. This showed that the impact of drought disaster on China’s agriculture, whether in frequency or intensity, was large. With the different level of DAI, China’s agricultural drought risk pattern showed variable pattern characteristics. When DAI was low, the distribution of county agricultural drought risk in China presented the East–West pattern of differentiation, and high risk mainly lied in the eastern, low risk mainly in the western. On the other hand, when DAI was high, the distribution of county risk appeared a pattern of high in center, and the north areas higher than the south, increased gradually from southwest to northeast. Drought risk presents a clear zonal differentiation that may be result from stepped topography, different precipitation and hazard-affected bodies. Spread of high value area of drought risk in northern may be related to the southeast monsoon and ecological degradation in northern Ecotone.
|
| [8] |
中国城市自然灾害区划编制 [J].https://doi.org/10.3969/j.issn.1004-4574.2005.06.008 URL [本文引用: 1] 摘要
依据灾害系统理论和中国自然灾害数据库,构建了综合城市化水平(Cl)指标和综合自然灾害强度(QC)指标;运用数字地图技术,在模型与图谱互馈过程中,实现了中国城市承灾体与致灾因子的综合定量评价,编制了中国城市自然灾害区划图。将中国区划为3个一级区,即沿海城市灾害区、东部城市灾害区和西部城市灾害区,以及15个二级区和22个三级区,为城市灾害风险管理和中国自然灾害救助区划提供了科学依据。
Compilation of city natural disaster regionalization in China .https://doi.org/10.3969/j.issn.1004-4574.2005.06.008 URL [本文引用: 1] 摘要
依据灾害系统理论和中国自然灾害数据库,构建了综合城市化水平(Cl)指标和综合自然灾害强度(QC)指标;运用数字地图技术,在模型与图谱互馈过程中,实现了中国城市承灾体与致灾因子的综合定量评价,编制了中国城市自然灾害区划图。将中国区划为3个一级区,即沿海城市灾害区、东部城市灾害区和西部城市灾害区,以及15个二级区和22个三级区,为城市灾害风险管理和中国自然灾害救助区划提供了科学依据。
|
| [9] |
Urban risk assessment research of major natural disasters in China [J].https://doi.org/10.1016/S1002-0160(06)60035-0 URL [本文引用: 1] 摘要
According to disaster system theory and the natural disaster database of China,this paperbuilds the urban vulnerability indexon the basis of the integrated urbanization level index(CL) of hazard-affected bodies;and considering the structural damage and the influence on traffic of different naturaldisasters,this paper chooses five major disaster types(including flood,earthquake,debris flow-rockslide,typhoon and dust storm) to build and compute the integrated intensity index of major natural haz-ards(QC).Then through qualitative analysis and semi-quantitative calculation,the integrated urban riskof major natural disasters in china is divided into five grades,namely very high,high,medium,lowandvery lowgrades,and the corresponding assessment map is worked out.At last,some further discussion isdone about the integrated risk assessment of natural disaster chains.
|
| [10] |
中国省级粮食产量的风险区划研究 [J].China grain yield risk division at the level of province . |
| [11] |
基于GIS的洪水灾害风险区划研究 [J].https://doi.org/10.3321/j.issn:0375-5444.2000.01.003 URL [本文引用: 1] 摘要
洪水灾害区划是洪灾评估与管理的重要内容,本文在分析洪灾形成的各主要因子的基础上,提出了基于地理信息系统的洪灾风险区划指标模型,并结合辽河流域具体情况,以降雨、地形和区域社会经济易损为主要指标,得出了辽河流域洪灾风险综合区别。
A GIS-based approach to flood risk zonation .https://doi.org/10.3321/j.issn:0375-5444.2000.01.003 URL [本文引用: 1] 摘要
洪水灾害区划是洪灾评估与管理的重要内容,本文在分析洪灾形成的各主要因子的基础上,提出了基于地理信息系统的洪灾风险区划指标模型,并结合辽河流域具体情况,以降雨、地形和区域社会经济易损为主要指标,得出了辽河流域洪灾风险综合区别。
|
| [12] |
中国洪水灾害危险程度区划 [J].https://doi.org/10.3321/j.issn:0559-9350.2000.03.001 URL [本文引用: 1] 摘要
洪灾的含义包括洪水和灾害两个方面.本文从气象、径流和地形三因素考虑,采用成因分析的方法,制成了洪水危险程度区划图.以耕地和人口为经济因素指标,考虑洪水造成的灾害,制作成洪灾危险程度区划图.本文制作的区划图是客观的,已得到了一些领域专家的认可,可以作为防洪规划等宏观决策的依据
Zoning of Chinese flood hazard risk .https://doi.org/10.3321/j.issn:0559-9350.2000.03.001 URL [本文引用: 1] 摘要
洪灾的含义包括洪水和灾害两个方面.本文从气象、径流和地形三因素考虑,采用成因分析的方法,制成了洪水危险程度区划图.以耕地和人口为经济因素指标,考虑洪水造成的灾害,制作成洪灾危险程度区划图.本文制作的区划图是客观的,已得到了一些领域专家的认可,可以作为防洪规划等宏观决策的依据
|
| [13] |
中国洪水灾害风险区划及其成因分析 [J].Flood risk zoning and causal analysis in China . |
| [14] |
中国洪灾风险区划研究 [J].
考虑气候、地貌和流域水系作为洪水发生的影响因素,分别选取特定频率下的三日降水量、中国气候分区图、坡度图、高程图和河湖缓冲区作为洪水发生的影响因子,并兼顾历史洪水频次数据,采用成因分析法和层次分析法确定各影响因子的权重,在ArcGIS环境下制作了特定频率下的中国洪水风险区划图。分别以人口和GDP作为社会经济指标,分析并制作了中国发生特定频率洪水时的受灾人口分布图和GDP损失分布图。区划图符合历史洪水资料的统计情况,客观反映了中国洪水风险区域的空间分布情况。
Flood risk zoning in China .
考虑气候、地貌和流域水系作为洪水发生的影响因素,分别选取特定频率下的三日降水量、中国气候分区图、坡度图、高程图和河湖缓冲区作为洪水发生的影响因子,并兼顾历史洪水频次数据,采用成因分析法和层次分析法确定各影响因子的权重,在ArcGIS环境下制作了特定频率下的中国洪水风险区划图。分别以人口和GDP作为社会经济指标,分析并制作了中国发生特定频率洪水时的受灾人口分布图和GDP损失分布图。区划图符合历史洪水资料的统计情况,客观反映了中国洪水风险区域的空间分布情况。
|
| [15] |
Climate change risk research: A case study on flood disaster risk in China [J].https://doi.org/10.3724/SP.J.1248.2012.00092 URL [本文引用: 1] 摘要
This paper discusses theories and methods of climate change risk studies for the research expansion in China. Climate change risks consist of three basic components including sensitivity, exposure, and possibility. Uncertainty, future events, damages, and relativity are the major features of climate change risk. Climate change risk research includes two key steps: risk assessment and risk management, the former is the process, and the latter is the ultimate goal which is the basis for actions to address climate change. We present the main framework and methods for climate change risk research. A case study on China floods risk is taken as an example of climate change risk study. Finally, we point out main aspects of climate change risk research, including ensemble-based probabilistic projection, quantitative risk assessment, risk zoning and mapping, and risk management. Wu, S.-H., T. Pan, and S.-F. He, 2012: Climate change risk research: A case study on flood disaster risk in China. Adv. Clim. Change Res., 3(2), doi: 10.3724/SP.J.1248.2012.00092.
|
| [16] |
建立中国综合风险管理体系 [J].Construction of integrated risk management system in China . |
| [17] |
Framework for integrated environmental health impact assessment of systemic risks [J].https://doi.org/10.1186/1476-069X-7-1 URL PMID: 2263033 [本文引用: 1] 摘要
Background It took over two decades to achieve the removal of leaded gasoline in this country. This was despite international evidence and original research conducted in New Zealand on the harm to child cognitive function and behaviour from lead exposure. Objective To identify lessons from the New Zealand experience of removing leaded gasoline that are potentially relevant to the control of other environmental pollutants. Discussion From the available documentation, we suggest a number of reasons for the slow policy response to the leaded gasoline hazard. These include: (1) industry power in the form of successful lobbying by the lead additive supplier, Associated Octel; (2) the absence of the precautionary principle as part of risk management policy; and (3) weak policymaking machinery that included: (a) the poor use of health research evidence (from both NZ and internationally), as well as limited use of expertise in academic and non-governmental organisations; (b) lack of personnel competent in addressing technically complex issues; and (c) diffusion of responsibility among government agencies. Conclusion There is a need for a stronger precautionary approach by policymakers when considering environmental pollutants. Politicians, officials and health workers need to strengthen policymaking processes and effectively counter the industry tactics used to delay regulatory responses.
|
| [18] |
基于GIS的多灾害耦合综合风险评估 [J].Multi-hazard risk assessment using GIS in urban areas . |
| [19] |
Human contribution to more-intense precipitation extremes [J].https://doi.org/10.1038/nature09763 URL PMID: 21331039 [本文引用: 1] 摘要
Abstract Extremes of weather and climate can have devastating effects on human society and the environment. Understanding past changes in the characteristics of such events, including recent increases in the intensity of heavy precipitation events over a large part of the Northern Hemisphere land area, is critical for reliable projections of future changes. Given that atmospheric water-holding capacity is expected to increase roughly exponentially with temperature--and that atmospheric water content is increasing in accord with this theoretical expectation--it has been suggested that human-influenced global warming may be partly responsible for increases in heavy precipitation. Because of the limited availability of daily observations, however, most previous studies have examined only the potential detectability of changes in extreme precipitation through model-model comparisons. Here we show that human-induced increases in greenhouse gases have contributed to the observed intensification of heavy precipitation events found over approximately two-thirds of data-covered parts of Northern Hemisphere land areas. These results are based on a comparison of observed and multi-model simulated changes in extreme precipitation over the latter half of the twentieth century analysed with an optimal fingerprinting technique. Changes in extreme precipitation projected by models, and thus the impacts of future changes in extreme precipitation, may be underestimated because models seem to underestimate the observed increase in heavy precipitation with warming.
|
| [20] |
Hot days induced by precipitation deficits at the global scale [J].https://doi.org/10.1073/pnas.1204330109 URL PMID: 22802672 [本文引用: 1] 摘要
Global warming increases the occurrence probability of hot extremes, and improving the predictability of such events is thus becoming of critical importance. Hot extremes have been shown to be induced by surface moisture deficits in some regions. In this study, we assess whether such a relationship holds at the global scale. We find that wide areas of the world display a strong relationship between the number of hot days in the regions' hottest month and preceding precipitation deficits. The occurrence probability of an above-average number of hot days is over 70% after precipitation deficits in most parts of South America as well as the Iberian Peninsula and Eastern Australia, and over 60% in most of North America and Eastern Europe, while it is below 30-40% after wet conditions in these regions. Using quantile regression analyses, we show that the impact of precipitation deficits on the number of hot days is asymmetric, i.e. extreme high numbers of hot days are most strongly influenced. This relationship also applies to the 2011 extreme event in Texas. These findings suggest that effects of soil moisture-temperature coupling are geographically more widespread than commonly assumed.
|
| [21] |
1998年全球自然灾害评析 [J].Analysis of global natural catastrophes in 1998 . |
| [22] |
|
| [23] |
Spatiotemporal variations of meteorological droughts in China during 1961-2014: An investigation based on multi-threshold identification [J].https://doi.org/10.1007/s13753-016-0083-8 URL [本文引用: 1] 摘要
As a major agricultural country, China suffers from severe meteorological drought almost every year. Previous studies have applied a single threshold to identify the onset of drought events, which may cause problems to adequately characterize long-term patterns of droughts. This study analyzes meteorological droughts in China based on a set of daily gridded (0.5 90.5) precipitation data from 1961 to 2014. By using a multi-threshold run theory approach to evaluate the monthly percentage of precipitation anomalies index (Pa), a drought events sequence was identified at each grid cell. The spatiotem-poral variations of drought in China were further investi-gated based on statistics of the frequency, duration, severity, and intensity of all drought events. Analysis of the results show that China has five distinct meteorological drought-prone regions: the Huang-Huai-Hai Plain, North-east China, Southwest China, South China coastal region, and Northwest China. Seasonal analysis further indicates that there are evident spatial variations in the seasonal contribution to regional drought. But overall, most contri-bution to annual drought events in China come from the winter. Decadal variation analysis suggests that most of China's water resource regions have undergone an increase in drought frequency, especially in the Liaohe, Haihe, and Yellow River basins, although drought duration and severity clearly have decreased after the 1960s.
|
| [24] |
|
| [25] |
A multi-model analysis of change in potential yield of major crops in China under climate change [J].https://doi.org/10.5194/esd-6-45-2015 URL [本文引用: 6] 摘要
Climate change may affect crop growth and yield, which consequently casts a shadow of doubt over China's food self-sufficiency efforts. In this study, we used the projections derived from four global gridded crop models (GGCropMs) to assess the effects of future climate change on the yields of the major crops (i.e., maize, rice, soybean and wheat) in China. The GGCropMs were forced with the bias-corrected climate data from five global climate models (GCMs) under Representative Concentration Pathway (RCP) 8.5, which were made available through the Inter-Sectoral Impact Model Intercomparison Project (ISI-MIP). The results show that the potential yields of the crops would decrease in the 21st century without carbon dioxide (CO2) fertilization effect. With the CO2 effect, the potential yields of rice and soybean would increase, while the potential yields of maize and wheat would decrease. The uncertainty in yields resulting from the GGCropMs is larger than the uncertainty derived from GCMs in the greater part of China. Climate change may benefit rice and soybean yields in high-altitude and cold regions which are not in the current main agricultural area. However, the potential yields of maize, soybean and wheat may decrease in the major food production area. Development of new agronomic management strategies may be useful for coping with climate change in the areas with a high risk of yield reduction.
|
| [26] |
Risk and contributing factors of ecosystem shifts over naturally vegetated land under climate change in China [J].https://doi.org/10.1038/srep20905 URL PMID: 4751438 [本文引用: 7] 摘要
Abstract Identifying the areas at risk of ecosystem transformation and the main contributing factors to the risk is essential to assist ecological adaptation to climate change. We assessed the risk of ecosystem shifts in China using the projections of four global gridded vegetation models (GGVMs) and an aggregate metric. The results show that half of naturally vegetated land surface could be under moderate or severe risk at the end of the 21(st) century under the middle and high emission scenarios. The areas with high risk are the Tibetan Plateau region and an area extended northeastward from the Tibetan Plateau to northeast China. With the three major factors considered, the change in carbon stocks is the main contributing factor to the high risk of ecosystem shifts. The change in carbon fluxes is another important contributing factor under the high emission scenario. The change in water fluxes is a less dominant factor except for the Tibetan Plateau region under the high emission scenario. Although there is considerable uncertainty in the risk assessment, the geographic patterns of the risk are generally consistent across different scenarios. The results could help develop regional strategies for ecosystem conservation to cope with climate change.
|
| [27] |
Risk of severe climate change impact on the terrestrial biosphere [J].https://doi.org/10.1088/1748-9326/6/3/034036 URL [本文引用: 2] 摘要
The functioning of many ecosystems and their associated resilience could become severely compromised by climate change over the 21st century. We present a global risk analysis of terrestrial ecosystem changes based on an aggregate metric of joint changes in macroscopic ecosystem features including vegetation structure as well as carbon and water fluxes and stores. We apply this metric to global ecosystem simulations with a dynamic global vegetation model (LPJmL) under 58 WCRP CMIP3 climate change projections. Given the current knowledge of ecosystem processes and projected climate change patterns, we find that severe ecosystem changes cannot be excluded on any continent. They are likely to occur (in > 90% of the climate projections) in the boreal-temperate ecotone where heat and drought stress might lead to large-scale forest die-back, along boreal and mountainous tree lines where the temperature limitation will be alleviated, and in water-limited ecosystems where elevated atmospheric COconcentration will lead to increased water use efficiency of photosynthesis. Considerable ecosystem changes can be expected above 3 K local temperature change in cold and tropical climates and above 4 K in the temperate zone. Sensitivity to temperature change increases with decreasing precipitation in tropical and temperate ecosystems. In summary, there is a risk of substantial restructuring of the global land biosphere on current trajectories of climate change.
|
| [28] |
Impact of high temperature on the mortality in summer of Wuhan, China [J].https://doi.org/10.1007/s12665-015-4873-x URL [本文引用: 6] 摘要
Water conservation is critical under the current state of climate change and population growth; however, water-conservation programs and research in China have generally focused on technological...
|
| [29] |
|
| [30] |
The national pattern of airborne toxic releases [J].https://doi.org/10.1111/j.0033-0124.1989.00149.x URL [本文引用: 1] 摘要
Incident-specific data reveal the spatial patterns of two major classes of acute toxic airborne releases in the United States (198209000986): rural agricultural and urban industrial. Rural (primarily truck transport) incidents dominate the distribution in the western US, while rail incidents and fixed site incidents dominate in the east. Using a combination of cartographic and statistical analyses, risk and mitigation measures were calculated to identify high-hazard and low-hazard states. Risk factors, primarily numbers of chemical firms and rail miles per state, best predict the frequency of incidents and their resulting spatial pattern.
|
| [31] |
|
| [32] |
Measuring vulnerability to natural hazards: towards disaster resilient societies [J].https://doi.org/10.1111/j.1539-6975.2010.01389.x URL [本文引用: 1] 摘要
No abstract is available for this article.
|
| [33] |
|
| [34] |
Climate change regionalization in China (1961-2010) .https://doi.org/10.1007/s11430-014-4889-1 URL [本文引用: 1] |
| [35] |
Regional crop yield, water consumption and water use efficiency and their responses to climate change in the North China Plain [J].https://doi.org/10.1016/j.agee.2009.05.017 URL [本文引用: 1] 摘要
The North China Plain (NCP) is one of the most important regions for food production in China, with its agricultural system being significantly affected by the undergoing climate change and vulnerable with water stress. In this study, the Vegetation Interface Processes (VIP) model is used to evaluate crop yield, water consumption (ET), and water use efficiency (WUE) of a winter wheat ( Triticum aestivum L.)ummer maize ( Zea mays L.) double cropping system in the NCP from 1951 to 2006. Their responses to future climate scenarios of 21st century projected by the GCM (HadCM3) with Intergovernmental Panel on Climate Change Special Report on Emission Scenario (IPCC SRES) A2 and B1 emissions are investigated. The results show a rapid enhancement of crop yield in the past 56 years, accompanying with slight increment of ET and noticeable improvement of WUE. There exist spatial patterns of crop yield stemmed mainly from soil quality and irrigation facilities. For climate change impacts, it is found that winter wheat yield will significantly increase with the maximum increment in A2 occurring in 2070s with a value of 19%, whereas the maximum in B1 being 13% in 2060s. Its ET is slightly intensified, which is less than 6%, under both A2 and B1 scenarios, giving rise to the improvement of WUE by 10% and 7% under A2 and B1 scenarios, respectively. Comparatively, summer maize yield will gently decline by 15% for A2 and 12% for B1 scenario, respectively. Its ET is obviously increasing since 2050s with over 10% relative change, leading to a lower WUE with more than 25% relative change under both scenarios in 2090s. Therefore, possible adaptation countermeasures should be developed to mitigate the negative effects of climate change for the sustainable development of agro-ecosystems in the NCP.
|
| [36] |
青藏高原冰冻圈变化及其对区域水循环和生态条件的影响 [J].https://doi.org/10.3969/j.issn.0253-9608.2013.03.004 URL Magsci [本文引用: 1] 摘要
<p>以青藏高原为中心的冰川群是中国乃至整个高亚洲冰川的核心,由于全球变暖,青藏高原冰川自20 世纪90<br /> 年代以来呈全面、加速退缩趋势。作为全球最主要的高海拔冻土区,青藏高原近几十年气候变暖是冻土退化的基础<br /> 因素,人为活动在局部加速了冻土退化,推测未来几十年内冻土退化仍会保持或加速。过去50 年,青藏高原积雪<br /> 面积总体呈减少趋势。由于气温升高,青藏高原处于降雪和积雪临界状态的区域大大增加,导致青藏高原积雪期开<br /> 始时间的推迟和结束时间的提前。冰川加速消融退缩,融水在逐年增加,冰川变化引发的水资源时空分布和水循环<br /> 过程的变化,无疑将给青藏高原社会经济发展带来深刻影响。冻土及其孕育的高寒沼泽湿地和高寒草甸生态系统具<br /> 有显著的水源涵养功能,是稳定江河源区水循环与河川径流的重要因素。青藏高原江河源区近几十年来生态退化和<br /> 河流、湖泊、沼泽、湿地等水文环境的显著变化就与冻土退化密切相关。过去十年来由于冻胀和融沉破坏,青藏公<br /> 路已经进行了多次全线性大规模的整修。在未来几十年内多年冻土的主要退化形式为地下冰的消融和低温冻土向高<br /> 温冻土转化,这一过程将引起热融滑塌、热融沉陷等冻土热融灾害。为应对气候变化对青藏高原冰冻圈影响,应加<br /> 强冰川融水对地表水和冰川融水补给河流的水文过程与预测研究,针对未来可能出现的各种灾害,要在科学预测和<br /> 普查的基础上评价灾害风险。</p>
Cryospheric changes and their impacts on regional water cycle and ecological conditions in the Qinghai-Tibetan Plateau .https://doi.org/10.3969/j.issn.0253-9608.2013.03.004 URL Magsci [本文引用: 1] 摘要
<p>以青藏高原为中心的冰川群是中国乃至整个高亚洲冰川的核心,由于全球变暖,青藏高原冰川自20 世纪90<br /> 年代以来呈全面、加速退缩趋势。作为全球最主要的高海拔冻土区,青藏高原近几十年气候变暖是冻土退化的基础<br /> 因素,人为活动在局部加速了冻土退化,推测未来几十年内冻土退化仍会保持或加速。过去50 年,青藏高原积雪<br /> 面积总体呈减少趋势。由于气温升高,青藏高原处于降雪和积雪临界状态的区域大大增加,导致青藏高原积雪期开<br /> 始时间的推迟和结束时间的提前。冰川加速消融退缩,融水在逐年增加,冰川变化引发的水资源时空分布和水循环<br /> 过程的变化,无疑将给青藏高原社会经济发展带来深刻影响。冻土及其孕育的高寒沼泽湿地和高寒草甸生态系统具<br /> 有显著的水源涵养功能,是稳定江河源区水循环与河川径流的重要因素。青藏高原江河源区近几十年来生态退化和<br /> 河流、湖泊、沼泽、湿地等水文环境的显著变化就与冻土退化密切相关。过去十年来由于冻胀和融沉破坏,青藏公<br /> 路已经进行了多次全线性大规模的整修。在未来几十年内多年冻土的主要退化形式为地下冰的消融和低温冻土向高<br /> 温冻土转化,这一过程将引起热融滑塌、热融沉陷等冻土热融灾害。为应对气候变化对青藏高原冰冻圈影响,应加<br /> 强冰川融水对地表水和冰川融水补给河流的水文过程与预测研究,针对未来可能出现的各种灾害,要在科学预测和<br /> 普查的基础上评价灾害风险。</p>
|
| [37] |
Assessing agricultural risks of climate change in the 21st century in a global gridded crop model intercomparison [J].https://doi.org/10.1073/pnas.1222463110 URL PMID: 24344314 [本文引用: 1] 摘要
Abstract Here we present the results from an intercomparison of multiple global gridded crop models (GGCMs) within the framework of the Agricultural Model Intercomparison and Improvement Project and the Inter-Sectoral Impacts Model Intercomparison Project. Results indicate strong negative effects of climate change, especially at higher levels of warming and at low latitudes; models that include explicit nitrogen stress project more severe impacts. Across seven GGCMs, five global climate models, and four representative concentration pathways, model agreement on direction of yield changes is found in many major agricultural regions at both low and high latitudes; however, reducing uncertainty in sign of response in mid-latitude regions remains a challenge. Uncertainties related to the representation of carbon dioxide, nitrogen, and high temperature effects demonstrated here show that further research is urgently needed to better understand effects of climate change on agricultural production and to devise targeted adaptation strategies.
|
| [38] |
New climate and socio-economic scenarios for assessing global human health challenges due to heat risk [J].https://doi.org/10.1007/s10584-015-1372-8 URL [本文引用: 1] 摘要
Motivated by growing heat-related morbidity and mortality in a warming climate, this paper assesses global heat health risk in order to understand the challenges to sustainability in the 21st...
|
| [39] |
Assessments of joint hydrological extreme risks in a warming climate in China [J].https://doi.org/10.1002/joc.4447 URL [本文引用: 1] 摘要
ABSTRACT Understanding how hydrological extremes would respond to global warming and its associated uncertainties is important for better designing mitigation and adaption strategies to cope with global change. Very few works have investigated the changes in future hydrological extremes and, especially, the more devastating joint hydrological extremes over China. In this article, two combinations of joint extremes [i.e. high runoff/high soil moisture (HRHS) and low runoff/low soil moisture (LRLS)] are designed for analysis. To derive the scenarios of hydrological conditions, the bias-corrected daily climate projections from five global circulation models (GCMs) under the historical and Representative Concentration Pathways 8.5 (RCP8.5) emission scenarios are used to drive the calibrated Variable Infiltration Capacity (VIC) model from 1951 to 2099 over China. Results show notable increase of occurrence of HRHS in Northeast China, LRLS in Northwest and South of China under 2 C global warming. The spatial pattern of changes in joint extremes tends to remain stable with global temperature increase up to 3 C. Compared with the individual extreme risk, joint extreme are much more concentrated in Northwest and South China and the magnitude of changes is several times larger. Larger areas experiencing changes are found when using lower standards of extreme definition. Because hydrological regime may change gradually in response to climate change, the threshold derived from present regime may lead to misrepresentation of extreme risk analysis. This was demonstrated by the ten times smaller magnitude of changes when adopting the updated transient threshold representing the changing hydrological regime, thus providing a low-boundary of potential changes in extremes. Our results highlight the importance of considering the changing hydrological regime in addition to choosing various levels of threshold for extreme definition in order to cover the full range of possible extreme changes in a warming climate.
|
| [40] |
Multimodel assessment of water scarcity under climate change [J].https://doi.org/10.1073/pnas.1222460110 URL [本文引用: 1] |
| [41] |
Sensitivity of future U.S. Water shortages to socioeconomic and climate drivers: a case study in Georgia using an integrated human-earth system modeling framework [J].https://doi.org/10.1007/s10584-016-1602-8 URL [本文引用: 1] 摘要
Abstract One of the most important interactions between humans and climate is in the demand and supply of water. Humans withdraw, use, and consume water and return waste water to the environment for a variety of socioeconomic purposes, including domestic, commercial, and industrial use, production of energy resources and cooling thermal-electric power plants, and growing food, fiber, and chemical feed stocks for human consumption. Uncertainties in the future human demand for water interact with future impacts of climatic change on water supplies to impinge on water management decisions at the international, national, regional, and local level, but until recently tools were not available to assess the uncertainties surrounding these decisions. This paper demonstrates the use of a multi-model framework in a structured sensitivity analysis to project and quantify the sensitivity of future deficits in surface water in the context of climate and socioeconomic change for all U.S. states and sub-basins. The framework treats all sources of water demand and supply consistently from the world to local level. The paper illustrates the capabilities of the framework with sample results for a river sub-basin in the U.S. state of Georgia.
|
| [42] |
面向“未来地球”计划的陆地表层格局研究 [J].https://doi.org/10.11820/dlkxjz.2015.01.002 URL Magsci [本文引用: 1] 摘要
未来地球计划是目前国际上关于全球环境变化前沿研究的综合科学计划,集国际科学理事会(ICSU)所领导的四大科学计划为一体,旨在将自然科学与社会科学结合在一起,并加强决策支持和研究交流,寻求地球系统可持续途径,全球环境变化研究与人类学、社会学合作构建综合集成平台,推进科学研究为社会经济可持续发展服务。本文剖析陆地表层格局特点,分析陆地表层格局的国内外关注焦点及其研究理念的转变与应用领域的拓展。分析表明:陆地表层是未来地球计划关注的重点之一,陆地表层要素与过程相互作用并在人类活动驱动下形成的格局,可作为未来地球计划进一步研究的区域基础框架。未来,陆地表层格局研究应力求方法论的突破,为自然地理学综合研究的发展提供支撑。
Land surface pattern study under the framework of Future Earth .https://doi.org/10.11820/dlkxjz.2015.01.002 URL Magsci [本文引用: 1] 摘要
未来地球计划是目前国际上关于全球环境变化前沿研究的综合科学计划,集国际科学理事会(ICSU)所领导的四大科学计划为一体,旨在将自然科学与社会科学结合在一起,并加强决策支持和研究交流,寻求地球系统可持续途径,全球环境变化研究与人类学、社会学合作构建综合集成平台,推进科学研究为社会经济可持续发展服务。本文剖析陆地表层格局特点,分析陆地表层格局的国内外关注焦点及其研究理念的转变与应用领域的拓展。分析表明:陆地表层是未来地球计划关注的重点之一,陆地表层要素与过程相互作用并在人类活动驱动下形成的格局,可作为未来地球计划进一步研究的区域基础框架。未来,陆地表层格局研究应力求方法论的突破,为自然地理学综合研究的发展提供支撑。
|
| [43] |
进入21世纪的气候变化科学—气候变化的事实、影响与对策 [J].https://doi.org/10.3321/j.issn:1000-7857.2004.07.002 URL [本文引用: 1] 摘要
近百年来,地球气候正经历一次以全球变暖为主要特征的显著变化,我国的气候变化趋势与全球气候变化的总趋势基本一致.近50年的气候变暖主要是人类使用化石燃料排放的大量二氧化碳等温室气体的增效应造成的.现有的预测表明,未来50~100年全球和气候将继续向变暖的方向发展.国际上,目前和正在就如何减缓这种气候变暖的趋势和控制温室气候排放进行谈判.本文依据IPCC第三次评估报告与国内外最新的研究成果,说明气个变化的事实与未来的可能变化,阐述冰冻圈对气候变化的响应,进而说明气候变化对生态系统和社会经济的影响,分析气候变化给我国带来的挑战和机遇并提出对策建议.
Climate change sciences into the 21st century: Facts, impact and strategies addressing climate change .https://doi.org/10.3321/j.issn:1000-7857.2004.07.002 URL [本文引用: 1] 摘要
近百年来,地球气候正经历一次以全球变暖为主要特征的显著变化,我国的气候变化趋势与全球气候变化的总趋势基本一致.近50年的气候变暖主要是人类使用化石燃料排放的大量二氧化碳等温室气体的增效应造成的.现有的预测表明,未来50~100年全球和气候将继续向变暖的方向发展.国际上,目前和正在就如何减缓这种气候变暖的趋势和控制温室气候排放进行谈判.本文依据IPCC第三次评估报告与国内外最新的研究成果,说明气个变化的事实与未来的可能变化,阐述冰冻圈对气候变化的响应,进而说明气候变化对生态系统和社会经济的影响,分析气候变化给我国带来的挑战和机遇并提出对策建议.
|

/
| 〈 |
|
〉 |