李屹凯 , 张莉, 叶瑜
Li Yikai, Zhang Li, Ye Yu
中图分类号: P467
文献标识码: A
文章编号: 1000-0690(2018)05-0780-10
通讯作者:
收稿日期: 2017-06-13
修回日期: 2017-09-10
网络出版日期: 2018-05-10
版权声明: 2018 《地理科学》编辑部 本文是开放获取期刊文献,在以下情况下可以自由使用:学术研究、学术交流、科研教学等,但不允许用于商业目的.
基金资助:
作者简介:
作者简介:李屹凯(1991-),男,陕西咸阳人,博士研究生,主要从事过去气候变化影响与应对。E-mail: lyk200909@163.com
展开
摘要
从清代后期西北地区的历史文献中整理出1876~1878年气候信息和农业信息,即少雨或干旱等事件、蝗虫事件、歉收和饥荒事件。资料来源包括清代中央和新疆地方的档案,新疆、甘肃和宁夏的地方志,重要人物的文集等。结果显示1876~1878年西北地区中西部出现干旱及相关事件。将以上事件绘制成图,发现这些事件分布在甘肃、宁夏和新疆东部,最西可达新疆天山北麓中部。整体上,事件以1877年为范围最广、最为严重。在此次干旱事件中,西北地区中西部的经济社会受到的影响有限,只在部分县域出现粮食歉收和饥荒,未发生同期华北地区普遍存在的“奇荒”。
关键词:
Abstract
There were many exceptional climate events all over the world in 1876-1878. Existing researches showed a huge controversy that the drought event in Northwest China based on different proxy data, such as historical documents and tree ring. To understand the spatial distribution of the drought event, this article collected the information of the climate and agriculture of the 1876-1878 from the historical documents in the Midwest Region of Northwest China in the late 19th century. The climatic information includes the event of the less precipitation and the event of the drought, and the agricultural information includes the event of the locust and the event of the poor harvest as well as famine. The historical documents are the central archives of the Qing dynasty and the local archives of the Xinjiang, and the local gazetteer of the Gansu, Ningxia and Xinjiang, and the collected works of the important person. Those events from historical documents were showed in the map. The result showed that event of less precipitation, drought, and locust appeared in the Midwest Region of Northwest China in 1876-1878. The historical documents suggested the spatial distribution of drought event and other related event in Gansu, Ningxia and eastern Xinjiang, and the most western distribution area was the middle of northern foot of Tianshan Mountains. And the most serious year of events was 1877. The drought events had less influence on the agriculture in the all area, and didn't lead to great famine in the Midwest Region of Northwest like North China.
Keywords:
1876~1878年的ENSO(El Niño-Southern Oscillation)暖事件[1]导致南美洲[2]、北美洲[3,4]、北极地区[5]、澳大利亚[6]和南亚地区[7]等全球多地发生气候异常,并在人类历史上扮演了重要角色[8],备受关注。同期,中国也出现了史称“丁戊奇荒”的干旱事件。此次事件是过去千年中国最为严重的极端干旱事件之一[9,10],造成数千万人口死亡,产生了极其恶劣的社会影响[11,12]。
由于在1876~1878年干旱事件中受到的影响最大,华北及其周边地区成为历史学研究者重点关注的区域[11,12]。研究者[13,14,15]选择华北地区作为主要的研究区域,依据历史文献进行识别和研究,并讨论其经济社会影响。然而,研究者关于此次干旱事件是否发生在西北地区却存在争议。一方面,关于全国的研究中,研究者[16,17]认为西北地区没有出现干旱事件。另一方面,利用树木年轮重建的序列,研究者[18,19]却认为西北地区在1876~1878年也相应地出现了干旱事件或极端干旱事件。
已有研究关于1876~1878年干旱事件分布范围的争议在于代用资料的不同。树轮重建序列指示西北地区确实出现干旱事件,但缺乏历史文献重建结果的参照。为了讨论1876~1878年西北地区是否出现干旱事件,本文将挖掘历史文献记载的相关信息。由于历史文献本身分布不均匀,研究主要关注资料相对丰富的甘肃、宁夏,以及新疆的东部和北部。通过搜集更多的历史文献,并进行重建研究,希望增进对1876~1878年干旱事件在全国空间分布范围的认识。
中国西北地区中西部指甘肃省、宁夏回族自治区和新疆维吾尔族自治区,深居欧亚大陆腹地,降水差异较大。总体上,除甘肃东部、伊犁河谷年均降水量超过200 mm之外,研究区域内年均降水量多不足200 mm。河西走廊和新疆以高山和巨大的盆地为主,在山麓地带形成绿洲,是重要的聚落分布区,也是人类主要的经济社会活动区。
研究时段所在的19世纪后期,西北地区中西部的行政区划与现代不同。按照当时的行政区划,本文的研究区域为清代甘肃和清代新疆(伊犁将军辖地)[20]。此外,1876~1878年恰逢左宗棠征战西北、收复新疆期间,是较为特殊的历史时期。受其影响,历史文献在研究区域内的分布更加不均匀。历史文献记载信息主要集中分布于甘肃和宁夏,以及新疆天山北麓、吐哈盆地、伊犁河谷(图1)。
本文使用的研究资料是各类历史文献,包括清代地方和中央保存的部分档案,以及编修的清实录和地方志,部分资料来自资料汇编。从以上历史文献中提取相关信息,重点关注的时间是1876~1878年。
2.1.1 官方档案及实录
官方档案来源有两类。第一类是《清代新疆档案选辑》[21]。虽然名为“清代新疆档案”,但实际上主要是光绪至宣统年间(1875~1911年)吐鲁番厅(厅是清代一种特殊的行政区划)政府的地方档案。该档案共分6部分,真实记载了吐鲁番地区的社会生活。从中可以提取信息,包括灾害预防、灾后救济等。
第二类是中国第一历史档案馆(以下简称“一档馆”)馆藏的雨雪档案。从中检索到1876~1878年甘肃逐月(农历月)的雨雪档案。档案内容以定性描述为主,定量记载较少。虽然雨雪档案不能够直接给出具体的降水量,但其所用词汇足以反映降水量的多少及其差异。例如“得霑雨泽甚微,不及分寸,且多有未得雨者”,说明当月降水较少;“正值秋冬之交,得此渥泽,滋润于农田有裨”或“得霑雨泽自一寸至二三四寸有余不等,民情慰悦”,说明当月降水正常或较多。因而,档案中的“获此膏泽”或“获此沃泽”能够指示降水正常或较多,“雨泽甚微”或“有并未得雨者”等能够指示降水较少。
此外,还查阅了《清实录》[22]中光绪朝部分的相关记载。实录是清代中央政府在光绪皇帝死后根据档案经过整理编撰而成,是了解光绪年间(1875~1908年)各类信息的重要历史文献。
2.1.2 文集
文集部分主要采用《左宗棠全集》[23]中的奏折。左宗棠在1866年被任命为陕甘总督,至1880年离开西北,是清代政府解决西北等问题的关键人物。期间,左宗棠一直是陕西、甘肃和新疆等地区的政府高级官员,需要及时以奏折向中央政府汇报有关其管辖区域的各类信息。《左宗棠全集》中收录的这部分奏折中,包括与干旱事件有关的信息,如救济灾民、捕杀蝗虫(Locusta)等。
2.1.3 地方志
地方志详细记载了地方社会的各类信息,可以从中提取出灾害及救灾信息。本文利用的清代甘肃地方志包括两类,即省志和州县志。现代甘肃和宁夏在清代均隶属于甘肃,故而清代甘肃省志包括现代甘肃和宁夏。甘肃省志是《甘肃全省新通志》[24],成书于1909年,是清代甘肃成为省级区划(1666年)后的第二部全省通志,有助于了解18世纪中期至19世纪后期甘肃各方面信息。州县志来自《中国地方志集成·甘肃府县志辑》[25]和《中国地方志集成·宁夏府县志辑》[26],选择编撰时间为1875年之后,共选择出甘肃地方志35部和宁夏地方志5部。其中,编撰时间在光绪年间(1875~1908年)的有19部,编撰在宣统年间(1909~1911年)的有3部,编撰在中华民国期间(1912~1949年)的有18部。
清代新疆的地方志分为两类,其一是《新疆图志》[27],为新疆建省(1884年)之后第一部全省通志,包括新疆的环境、经济和社会等多方面内容。其二是乡土志,最初多为稿本或刻本,后经整理和点校,汇编为《新疆乡土志稿》[28]。此书汇编了新疆的有效地方志44部,涵盖了新疆的绝大部分行政区划,各部的编撰时间均在1907~1910年。
2.1.4 资料汇编
本文还利用已整理的重要资料汇编作为资料补充,包括两类。其一是档案汇编《清代奏折汇编——农业•环境》[29],是研究者从“一档馆”中拣选出有关农业与环境的部分档案,后经点校及汇编而成。其二是地方志和其他资料汇编,包括袁林主编的《西北灾荒史》[30]和张德二主编的《中国三千年气象记录总集》[31]。
由于中国历史文献的特性,记载气候信息的同时也记载了其他相关信息等[32]。因而,在提取过程中将历史文献的信息分成两类,即气候信息和农业信息。
虽然西北地区中西部降水偏少,但仍有年际变化。历史文献的气候信息仍可以定性地反映真实的降水量变化。其中,甘肃东部的干旱事件与降水密切相关[33];河西走廊和新疆的干旱事件则由多种因素决定,且在年际尺度上河流径流量对气候变化的响应也不显著[34]。因而,在利用历史文献反映降水较少时,甘肃东部记载考虑“少雨”或“干旱”信息,除此之外的县域记载只考虑明确的“少雨”信息。
农业信息需要考虑社会背景,主要是蝗虫信息和农业丰歉信息。首先,以目前的研究来看,甘肃[35]和新疆[36]蝗虫出现与气候背景有关系。并且,已有研究表明历史时期河西走廊出现的蝗虫与干旱关系密切[37],体现了干旱事件。因而,历史文献记载的“蝗虫”的大规模出现也可以用来间接反映气候信息。例如1878年酒泉出现蝗虫,即与上一年冬季雨雪较少,且当年春夏降水推迟有关[23]。
其次,农业丰歉与多方面因素都有关系,本文只关注与气候变化有关的信息。参考Zhang等[14]和Hao等[15]的研究成果,“丰收”和“歉收”等信息在甘肃东部可以作为反映降水的指标。新疆等地农业生产主要依靠引水灌溉,才能确保粮食的产量。“丰收”和“歉收”在新疆和河西走廊则需要参考其他信息。历史文献记载了天山北麓夏季降水缺少时,被迫放弃部分耕地,进而确保灌溉最充分的耕地产量稳定[29]。因而,新疆降水变化也会影响粮食产量的高低,如1762年降水减少导致巴里坤粮食减产[29]。
最后,由于清代后期政府行政能力下降,难以保证全国粮食安全[38]。区域粮食生产安全一旦出现问题,即出现“歉收”,便会进行传递,对经济社会产生影响。当区域的粮食配给和消费安全得不到保障,“歉收”就很有可能导致“饥荒”。
首先,整理历史文献,并按照气候信息和农业信息进行分类。从分类之后的历史文献中提取时间、起点、事件类型、历史文献的原始记载和出处等内容,并建立数据库(举例说明见表1)。在建立数据库过程中,将清代使用的年号、天支等信息全部转化为公历时间。
表1 历史文献记载信息举例
Table 1 Drought, locust, crop failure and bumper harvest from wording used in historical documents
| 年份* | 地点** | 事件类型 | 历史文献的原始记载*** | 出处 |
|---|---|---|---|---|
| 1877 | 天山北麓东部 | 少雨、蝗虫 | 镇迪道具报本年夏间少雨,蝗蝻滋生 | 一档馆 |
| 1877 | 伊犁 | 丰收 | 以伊犁屯田丰收,予锡伯营领队大臣喀尔莽阿等优叙有差 | 清实录[22] |
| 1878 | 酒泉和天山北麓中部 | 蝗虫 | 肃州及古城以西均报蝗蝻生发,较上年为甚 | 左宗棠全集[23] |
| 1878 | 酒泉 | 少雨 | 上冬雪泽既悭,今春及夏雨水迟降 | 左宗棠全集[23] |
| 1878 | 吐鲁番 | 蝗虫 | 窃查吐鲁番夏初生蝗蝻 | 清代新疆档案选辑[21] |
| 1878 | 两当 | 饥荒 | (两当)大饥,斗麦钱七千,民不堪命 | 甘肃全省新通志[24] |
| 1877~1880 | 呼图壁 | 干旱、蝗虫 | (呼图壁)是岁及四、五、六等年,旱蝗频仍 | 新疆乡土志稿[28] |
其次,确定事件的地点信息。历史文献中记载大量地名信息,将结合社会背景分析其具体县域或区域,根据《中国行政区划通史(清代卷)》[20]确定为现代地名。例如“古城以西均报蝗蝻生发”中“古城以西”仅说明天山北麓中部各县域;“南路今岁旱、蝗为灾”中的“南路”并非是整个新疆南部,仅是天山南麓东部,主要是吐鲁番和哈密。
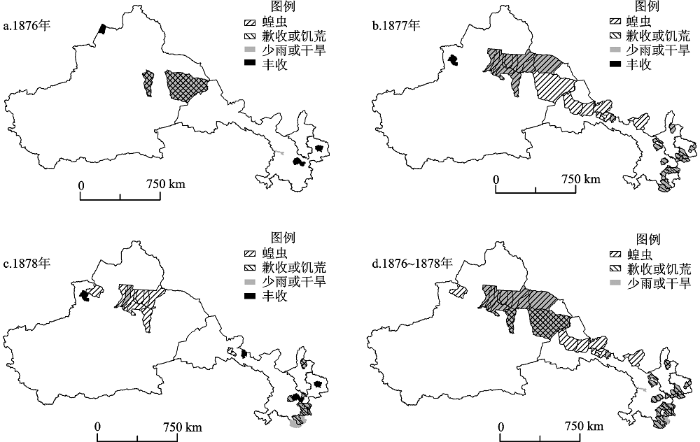
最后,统计结果以县域为单位,经过整理得到有效记载信息的地点105个。将相关信息按照类别绘制于地图,得到1876~1878年西北地区中西部的气候信息和农业信息(图2)。其中,按照时间划分,1876~1878年的分别有11个、58个和36个;按照事件类型划分,“少雨或干旱”、“蝗虫”、“丰收”和“歉收或饥荒”分别有40个、33个、22个和10个。
图2 1876~1878年西北地区中西部的气候信息和农业信息
Fig.2 The information of climate and agriculture in the Midwest Region of Northwest China in 1876-1878
由图2来看,1876年的干旱并不严重,仅在甘肃东部和新疆东部出现了干旱,且分布并不连续。一方面,与气候背景有关,可能1876年并非此次干旱事件最严重的时间,也有可能与现代新疆干旱时空分布格局一致,即东部与西部存在反相位[39]。另一方面,可能与当时的社会背景有关,即尚有广大区域处在战乱之中,未被历史文献所记载或者相关记载没有保留下来。
1877年干旱明显加重,在甘肃东部和天山北麓大面积出现。干旱在各县出现的时间并不一致,如临泽在5月、天水在6月、灵台在7月[25]。参考已有研究[37],也可以将河西走廊出现的蝗虫视为干旱的体现。河西走廊7个县出现蝗虫,占当时区域县域(含分县和厅)的43%。同时,新疆天山北麓10个县出现蝗虫、少雨或干旱,占当时区域县域(含厅)的90.91%。相比之下,1877年的干旱是3 a中范围最大的,而干旱程度也最为严重。
1878年干旱有所减缓。甘肃东部仍持续出现干旱事件,但范围相对减少。干旱出现在秋季,并持续到1879年春季,如甘肃天水“(1878年)秋不雨,至五年四月(1879年5月21日至6月19日)乃雨”[25]。河西走廊和新疆北部出现蝗虫的县域相对减少,新疆东部不再出现蝗虫,但个别县域程度则较为严重,如甘肃的酒泉和新疆的奇台、乌鲁木齐等地[21]。并且,根据记载,新疆的蝗虫在之后1879年和1880年仍有出现[21]。
此外,根据雨雪档案,可知清代甘肃逐月降水的定性变化情况。结果如下,1876年全年降水均无异常;1877年5月(农历四月)之前各月降水也无异常,5月13日至12月4日(农历四月至十月)之间降水异常,部分区域出现明显的减少;1878年11月24日至12月23日(农历十一月)部分县域降水出现异常减少。然而,由于雨雪档案并未记载地名,难以确定具体区域。
根据图2,1876年干旱不明显,只影响了部分县域的农业生产,如新疆东部“收成歉薄”[23]。1877~1878年干旱明显范围扩大,对农业的影响加重,甚至造成饥荒。甘肃东部出现饥荒的原因是干旱,从历史文献的记载中可以明显看出,如天水“五月不雨至年终,秋禾尽枯,麦种不入土,民大饥”,庆阳合水“大旱,夏麦歉、秋歉”[25]。同时,新疆北部的干旱也影响了农业,并迫使政府不得不采取一定的救灾、赈灾措施,如呼图壁“旱蝗频仍,期间驱蝗请账发牛籽,豁免额征”[28]。并且,部分县域也出现了其他灾害,如庆阳同时出现雹灾[25]。因而,可以认为甘肃东部和新疆北部部分县域出现了较为明显的干旱事件,造成粮食减产,并导致了严重的社会影响。
相比干旱,历史文献中记载蝗虫出现更多,特别是河西走廊及其以西。1877~1878年河西走廊和新疆虽然出现了大量的蝗虫,却并没有出现蝗灾。原因在于蝗虫并未危害作物,故没有导致灾害的发生。例如奇台、吐鲁番和民勤等地大规模出现蝗虫只采食自然植被,未影响作物[21]。同时,历史文献也记载了地方政府为预防蝗虫爆发而采取措施,如派遣士兵和农民一起捕捉蝗虫的幼虫[23]。正是基于自然和社会两方面原因,河西走廊、新疆东部、新疆北部的农业受到的影响并不严重,并未出现饥荒。不过,部分县域蝗虫也造成了严重影响,如天山北麓的精河及其附近蝗虫大规模出现,牧民因而“被灾尤重”[28]。
总体而言,1876年甘肃降水正常,且甘肃东部部分区域出现了丰收;新疆东部出现了干旱和饥荒。1877年,甘肃东部夏秋两季降水异常而出现干旱,以及由此导致的饥荒;河西走廊、吐哈盆地和天山北麓则大规模的出现蝗虫、少雨或干旱,并造成了一定的影响,但未出现大范围的饥荒。1878年甘肃东部秋季降水减少出现干旱,并导致饥荒,延续至次年才得以缓解;出现蝗虫的区域比上年减少,且仍未出现大范围的饥荒。此外,新疆西部在1876~1878年均出现了丰收,只是具体县域发生变化。
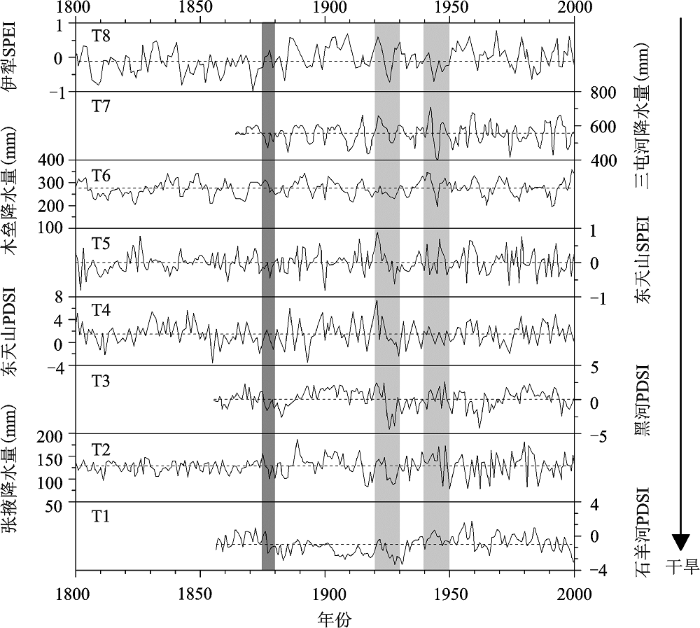
利用历史文献,展示了1876~1878年西北地区中西部的气候、农业信息。为更全面理解干旱事件,将结合已有树轮重建序列进行讨论。选择树轮作为参照,主要是树轮在西北地区分布较广,且分辨率较高,能够和历史文献进行参照。鉴于历史文献除甘肃东部外,主要分布河西走廊和天山北麓,故而选取的树轮序列主要来自邻近的祁连山(T1[40]、T2[41]、T3[42])和天山(T4[43]、T5[44]、T6[45]、T7[46]、T8[47])。原序列的重建时间包含过去200 a或过去150 a,且能够指示夏半年,即植物生长季的湿度变化。选取了8条树轮序列,包括3条降水序列、3条PDSI(Palmer Drought Severity Index)序列和2条SPEI(Standardized Precipitation Evapotranspiration Index)序列。最终,将8条序列改绘为过去200 a西北地区中西部湿度变化(图3)。
图3 过去200 a西北地区中西部湿度变化深灰色阴影表示1875~1879年,浅灰色阴影表示1920s和1940s;细实线表示逐年变化,细虚线表示平均值; T1、T3、T4为PDSI序列,T2、T6、T7为降水序列,T5、T8为SPEI序列
Fig.3 The series of humidity changes in the Midwest Region of Northwest China during 1800-2000
从图可知两方面的信息。一方面,除T8之外,其余7条序列均指示出在过去200 a或过去150 a中,1876~1878年的湿度偏低,但并没有出现特别明显的最低值,只在1877年前后湿度相对较低。并且,祁连山树轮序列指示出的干旱要比天山树轮序列明显。对比西北地区发生过的其他极端干旱事件,如1920s[48]和1945年[49],可知祁连山树轮对1920s极端干旱事件的指示更为明显,天山中西部树轮对1945年极端干旱事件的指示更为明显。因而,1876~1878年西北地区中西部并没有发生极端干旱事件。另一方面,在8条序列中,位于新疆西部的WT比较特殊,指示出1876~1878年湿度正常或稍偏高于平均值。此外,新疆西部赛里木湖流域的树轮序列也指示1876年为极端湿润年[50]。
根据以上的树轮序列,并结合前文从历史文献得到的信息,可知在1875~1879年期间祁连山和天山中东部发生了干旱事件,而天山西部并未发生干旱事件。但这种程度的干旱事件在过去200 a或过去150 a中,并不属于极端干旱事件。正因如此,干旱并未明显影响各条河流的径流量,也没有影响到当时的农业生产,故而就没有被历史文献所重视记载。此次干旱可能是1877~1878年河西走廊和天山北麓等地蝗虫大规模出现的气候背景。
由于水汽输送有着明显的差异,中国东部地区和西北地区的降水变化有着很大不同。不过,两地降水变化的差异主要存在于十年和百年尺度,在年际尺度可能并不存在反相位[51],部分干旱事件存在一致性[48]。因而,将1876~1878年西北地区中西部干旱事件与华北地区极端干旱事件进行对比,可以更好地理解前者。关于1876~1878年华北及其周边地区的极端干旱事件,已有人进行了深入研究[14,15]。
华北地区的干旱在1876年春季开始出现,以河北和山东较为严重;夏季则以山西西部和陕西较为严重;秋冬两季的降水与往年相比,只有河北出现明显减少。与此同时,甘肃东部的干旱也是在局部区域出现。河西走廊并无明显干旱,而在新疆东部出现严重的干旱。总体而言,1876年干旱最为严重的区域是山西。
1877年华北地区的降水减少最明显,故此年干旱最严重。春季干旱出现在陕西;夏秋两季大范围降水异常,干旱面积扩大,仅山东南部未受到影响;冬季干旱集中出现在河北,而其他区域得到缓解。由于临近陕西,甘肃东部也同样出现了严重的干旱。河西走廊虽未出现明显干旱事件,但出现大规模的蝗虫,则可能与同期降水减少有关。
1878年陕西中部在春季出现明显降水,干旱得到暂时缓解。但大范围内,华北地区春夏两季的降水仍异常减少,至秋季才出现足够降水。与华北地区并不一致,甘肃东部在秋季降水出现异常减少,直至次年春季才正常。同样地,相比于上年,西北地区出现蝗虫的范围也减少了。
1876~1878年,在华北地区出现的极端干旱事件和西北地区中西部出现的蝗虫、干旱事件之间,可能存在着一定的联系。首先,从年际变化来看,两者均以1877年最为严重。其次,当黄土高原出现严重干旱时,河西走廊及天山北麓均大规模出现蝗虫或降水减少。当然,两者也存在着差异,主要是西北地区中西部并未引发严重饥荒,即未发生“奇荒”。因而,已有关于干旱事件的研究重点关注了华北地区及其周边,并未注意到西北地区中西部。
华北地区的降水主要来自季风输送,深受ENSO事件的影响。ENSO暖事件会导致华北地区降水减少,冷事件则导致华北地区降水增多[52,53]。1876~1878年典型的ENSO暖事件,特别是1877年强度为很强[1]。因而,1876~1878年华北及其周边地区极端干旱事件主要由ENSO暖事件引起的季风衰退导致[14,15]。
西北地区中部也受到季风的影响,干旱事件的出现与华北地区存在同步[48]。然而,干旱事件在新疆存在明显的差异,即北部干旱/湿润时,南部湿润/干旱;东部干旱/湿润时,西部湿润/干旱[39]。西北地区中西部,特别是西部新疆的降水来源具有区域特征,与西风环流和南亚季风的关系密切。
4.3.1 1876~1878年NAO变化
西北地区中西部降水主要受控于西风环流和NAO(North Atlantic Oscillation)[54],而西风环流也受到了NAO的影响[55,56]。NAO负相位时,有助于西北地区的降水增多;反之,则降水减少[54,57]。在此,将利用已有NAO数据来进行分析。资料来源为University of East Anglia气候中心(http://www.cru.uea.ac.uk/cru/data/nao/),时间长度为1821~2000年。1876~1878年NAO值分别为-0.22、0.05和-0.92,为正常或负相位,即不会引起西北地区的降水减少。
4.3.2 1876~1878年南亚季风、印度降水变化
同时,西北地区西部降水变化也受到了南亚季风的影响[58]。西北地区与印度的降水存在反相位,较强的南亚季风对应于西北地区降水较少,而反之则对应于降水较多[51,57]。通过分析南亚季风的强弱、印度降水的多少,可以了解同期西北地区的降水变化。印度全境平均降水量资料来自ftp://www.tropmet.res.in/pub/data/rain/iitm-regionrf.txt,时间长度为1871~2013年。1871~2013年印度全境降水量平均值为1 086.99 mm,1876年和1877年印度降水量分别偏少15.92%和12.97%,而1878年偏多13.84%。根据南亚季风对印度和西北地区的影响,1876~1877年西北地区降水应当偏多。
4.3.3 1876~1878年干旱事件的可能机制
根据NAO和南亚季风的整体背景来看,1876~1878年西北地区中西部理应降水偏多,或至少维持多年降水平均值。然而,西北地区中西部,特别是甘肃和新疆东部却出现干旱事件。西北地区中部的甘肃受到ENSO暖事件导致季风衰退的影响,进而降水减少出现干旱事件是可以理解的。西北地区西部的新疆东部也同期出现干旱事件,则似乎是受到了ENSO暖事件的影响。
但是,这却与已有认识不一致。关于ENSO事件与西北地区西部降水变化的关系,研究者具有两种观点。一方面,认为ENSO事件会引起中国西北地区和中亚地区的降水变化,如Mariotti[60]认为发生ENSO暖事件时,暖湿气流会深入亚洲内陆,并导致当地降水增多;Tan等[61]认为ENSO暖事件会增加新疆北部的雨季降水,而冷事件则会减少。另一方面,Chen等[62]认为ENSO事件与塔里木盆地降水变化的关系不明显。对此,本文暂时无法给出合理解释,有待后续研究。不过,可以确定的是,即便NAO和南亚季风出现有利于西北地区中西部降水增多的整体背景,仍需要考虑出现区域干旱事件的风险。
通过搜集和整理清代后期新疆和甘肃的档案和地方志,可知以下结论。根据历史文献记载,发现1876~1878年甘肃东部出现干旱,河西走廊和天山北麓大规模出现蝗虫、少雨,尤以1877年最为严重,并导致部分地区出现饥荒。通过对比8条已有研究的祁连山和天山树轮湿度序列,发现同期确有干旱事件,但严重程度却不如1920s和1945年的干旱事件。因而,其并不属于极端干旱事件,产生的社会影响也较小。同时,对比已有华北地区的研究,可知西北地区中西部干旱事件与华北地区极端干旱事件在年际变化上,存在一致;但社会影响存在差异,未发生“奇荒”,人为原因应当与社会防治有关,自然原因则与气候背景有关。
The authors have declared that no competing interests exist.
| [1] |
A history of ENSO events since AD 1525: implications for future climate change [J].https://doi.org/10.1007/s10584-008-9476-z URL [本文引用: 2] 摘要
Reconstructions of past climate are important for providing a historical context for evaluating the nature of 20th century climate change. Here, a number of percentile-based palaeoclimate reconstructions were used to isolate signals of both phases of El Ni09o–Southern Oscillation (ENSO). A total of 92 (82) El Ni09o (La Ni09a) events were reconstructed since A.D. 1525. Significantly, we introduce the most comprehensive La Ni09a event record compiled to date. This annual record of ENSO events can now be used for independent verification of climate model simulations, reconstructions of ENSO indices and as a chronological control for archaeologists/social scientists interested in human responses to past climate events. Although extreme ENSO events are seen throughout the 478-year ENSO reconstruction, approximately 43% of extreme and 28% of all protracted ENSO events (i.e. both El Ni09o and La Ni09a phase) occur in the 20th century. The post-1940 period alone accounts for 30% of extreme ENSO years observed since A.D. 1525. These results suggest that ENSO may operate differently under natural (pre-industrial) and anthropogenic background states. As evidence of stresses on water supply, agriculture and natural ecosystems caused by climate change strengthens, studies into how ENSO will operate under global warming should be a global research priority.
|
| [2] |
The 1877-1878 El Niño episode: associated impacts in South America [J].https://doi.org/10.1007/s10584-008-9470-5 URL [本文引用: 1] 摘要
At times when attention on climate issues is strongly focused on the assessment of potential impacts of future climate change due to the intensification of the planetary greenhouse effect, it is perhaps pertinent to look back and explore the consequences of past climate variability. In this article we examine a large disruption in global climate that occurred during 1877–1878, when human influence was negligible. The mechanisms explaining this global disturbance are not well established, but there is considerable evidence that the major El Ni09o episode that started by the end of 1876 and peaked during the 1877–1878 boreal winter contributed significantly to it. The associated regional climate anomalies were extremely destructive, particularly in the Northern Hemisphere, where starvation due to intense droughts in Asia, South-East Asia and Africa took the lives of more than 20 million people. In South America regional precipitation anomalies were typical of El Ni09o events, with rainfall deficit and droughts in the northern portion of the continent as well as in northeast Brazil and the highlands of the central Andes (Altiplano). In contrast, anomalously intense rainfall and flooding episodes were reported for the coastal areas of southern Ecuador and Northern Perú, as well as along the extratropical West coast of the continent (central Chile, 30° S–40°02S), and in the Paraná basin in the southeast region. By far the most devastating impacts in terms of suffering and loss of life occurred in the semiarid region of northeast Brazil where several hundreds of thousands of people died from starvation and diseases during the drought that started in 1877.
|
| [3] |
An analysis of the 1877-78 ENSO episode and comparison with 1982-83 [J].https://doi.org/10.1175/1520-0493(1986)1142.0.CO;2 URL [本文引用: 1] 摘要
Abstract A comparison of the 1877–78 and 1982–83 El Ni09o/Southern Oscillation (ENSO) events was made using monthly and seasonal values of sea surface temperature (SST) and station pressure in the tropics, sea level pressure (SLP) in North America and the North Atlantic, temperature in North America and precipitation in several key areas around the globe. SST anomalies in the eastern tropical Pacific, heavy rains in coastal Peru and extreme pressure anomalies across the Pacific and Indian Oceans during 1877–78 indicate an ENSO event of comparable magnitude to that during 1982–83. Both events were also associated with drought conditions in the Indonesian region, India, South Africa, northeastern Brazil and Hawaii. Wintertime teleconnections in the midlatitudes of the Northern Hemisphere were similar in terms of SLP from the North Pacific to Europe, resulting in significantly higher than normal temperatures over most of the United States and extreme rains in California.
|
| [4] |
A possible connection between the 1878 yellow fever epidemic in the southern United States and the 1877-78 El Nino episode [J].
Studies the possible connection between the 1878 yellow fever epidemic in the Southern States, and the 1877-1878 El Nino episode. Overview of the epidemic; Extreme climate anomalies documented during the period; Evolution of the anomalies.
|
| [5] |
Natural catastrophes in Arctic populations: the 1878-1880 famine on Saint Lawrence Island, Alaska [J].https://doi.org/10.1016/S0278-4165(03)00003-5 URL [本文引用: 1] 摘要
This study draws on data from recent settlement surveys and new demographic data derived from repatriation-related assessments of human remains in museums to examine the circumstances of the 1878–1880 famine on Saint Lawrence Island, Alaska. The human data consist of a biased sample of individuals dying at these settlements. We compare this sample to an Arctic-specific model of population structure in order to identify and estimate segments of the population missing from the sample. The settlement-specific population estimates from the human remains are combined with population estimates derived from settlement data to give an island-wide population projection. The pre-famine population estimates indicate that the 1878–1880 famine mortality was over 90%. This tragic reduction in human population necessitated adoption of new hunting strategies that changed settlement patterns on the island. Migration of Yup’ik families from the Chukotka Peninsula after the famine is correlated with changes in house designs. This study suggests that cultural change was a significant feature of recovery from the famine and is an important factor in understanding cultural change in the archaeological record in the arctic.
|
| [6] |
|
| [7] |
Famine, epidemics and mortality in South India: A Reappraisal of the Demographic Crisis of 1876-1878 [J].https://doi.org/10.1111/j.1467-7717.1985.tb00952.x URL [本文引用: 1] 摘要
This paper studies, from the demographic point of view, the consequences of the famine of 1876-1878 in South India (Madras Presidency and Mysore State). It tries to answer the question: What was a demographic crisis under the ancient demographic pattern of colonial southern India? For this, the author leans on the methodological experience of the works of French historians of the 17th and 18th centuries, particularly the pioneering works of Jean Meuvret and Pierre Goubert. According to them, the demographic crisis is to be defined bringing to the fore the three fundamental traits that characterise it: a marked rise in the prices of staple foodstuff, a peak of mortality and, at the same period, a fall in conceptions. The second question raised by the author is: how does the demographic regime work after the crisis to allow the population to recover?
|
| [8] |
Late Victorian Holocausts: El Niño famines and the making of the third world [M]. |
| [9] |
Drought variability at the northern fringe of the Asian summer monsoon region over the past millennia [J].https://doi.org/10.1007/s00382-013-1962-y URL Magsci [本文引用: 1] 摘要
中国科学院机构知识库(CAS IR GRID)以发展机构知识能力和知识管理能力为目标,快速实现对本机构知识资产的收集、长期保存、合理传播利用,积极建设对知识内容进行捕获、转化、传播、利用和审计的能力,逐步建设包括知识内容分析、关系分析和能力审计在内的知识服务能力,开展综合知识管理。
|
| [10] |
Recent advances on reconstruction of climate and extreme events in China for the past 2000 years [J].https://doi.org/10.1007/s11442-016-1301-4 URL Magsci [本文引用: 1] 摘要
China is distinguished by a prominent monsoonal climate in the east of the country, a continental arid climate in the northwest and a highland cold climate on the Qinghai-Tibet Plateau. Because of the long history of Chinese civilization, there are abundant and well-dated documentary records for climate variation over the whole of the country as well as many natural archives(e.g., tree-rings, ice cores, stalagmites, varved lake sediments and corals) that enable high-resolution paleoclimatic reconstruction. In this paper, we review recent advances in the reconstruction of climate and extreme events over the last 2000 years in China. In the last 10 years, many new reconstructions, based on multi-proxies with wide spatial coverage, have been published in China. These reconstructions enable us to understand the characteristics of climate change across the country as well as the uncertainties of regional reconstructions. Synthesized reconstructed temperature results show that warm intervals over the last 2000 years occurred in AD 1–200, AD 551–760, AD 951–1320, and after AD 1921, and also show that cold intervals were in AD 201–350, AD 441–530, AD 781–950, and AD 1321–1920. Extreme cold winters, seen between 1500 and 1900, were more frequent than those after 1950. The intensity of regional heat waves, in the context of recent global warming, may not in fact exceed natural climate variability seen over the last 2000 years. In the eastern monsoonal region of China, decadal, multi-decadal and centennial oscillations are seen in rainfall variability. While the ensemble mean for drought/flood spatial patterns across all cold periods shows a meridional distribution, there is a tri-pole pattern with respect to droughts south of 25°N, floods between 25° and 30°N, and droughts north of 30°N for all warm periods. Data show that extreme drought events were most frequent in the periods AD 301–400, AD 751–800, AD 1051–1150, AD 1501–1550, and AD 1601–1650, while extreme flood events were frequent in the periods AD 101–150, AD 251–300, AD 951–1000, AD 1701–1750, AD 1801–1850, and AD 1901–1950. Between AD 1551–1600, extreme droughts and flood events occurred frequently. In arid northwest China, climate was characterized by dry conditions in AD 1000–1350, wet conditions in AD 1500–1850, and has tended to be wet over recent decades. On the northeastern Qinghai-Tibet Plateau, centennial-scale oscillations in precipitation have occurred over the last 1000 years, interrupted by several multidecadal-scale severe drought events. Of these, the most severe were in the 1480 s and 1710 s. In southwest China, extreme droughts as severe as those seen in Sichuan and Chongqing in 2006 are known to have occurred during historical times.
|
| [11] |
|
| [12] |
|
| [13] |
光绪三年北方大旱的气候背景 [J].
光绪三年北方地区的大旱灾是清朝后期社会影响最严重的旱灾。大旱灾形成的原因,在于在全球性的特强ENSO事件影响下,亚洲地区的季风显著减弱。东亚季风的减弱,使季风雨带的推进过程和降水特征发生变异,这是北方大旱灾的气候背景。夏季风雨带北推比常年偏晚,而雨带在进入北方地区后,至少可以分辨出两条雨带,其南面一条出现于六月中旬,北面一条出现于在六月下旬。
Climatic background of the severe drought in 1877 .
光绪三年北方地区的大旱灾是清朝后期社会影响最严重的旱灾。大旱灾形成的原因,在于在全球性的特强ENSO事件影响下,亚洲地区的季风显著减弱。东亚季风的减弱,使季风雨带的推进过程和降水特征发生变异,这是北方大旱灾的气候背景。夏季风雨带北推比常年偏晚,而雨带在进入北方地区后,至少可以分辨出两条雨带,其南面一条出现于六月中旬,北面一条出现于在六月下旬。
|
| [14] |
A long lasting and extensive drought event over China in 1876-1878 [J]. |
| [15] |
1876-1878 severe drought in North China: facts, impacts and climatic background [J].https://doi.org/10.1007/s11434-010-3243-z URL [本文引用: 4] 摘要
Based on the reconstructed precipitation series in North China from historical documents, the 1876-1878 drought was identified as the most severe and extreme one in North China over the past 300 years. Meanwhile, the spatial patterns of seasonal and annual precipitation during 1876-1877 were analyzed and the social and economic impacts related with this drought event were evaluated according to the descriptions in the historical documents. The results indicated that this long-lasting drought started by the spring of 1876 and did not stop until the spring of 1878. Within the three years, the harvest failures brought the rice price increased to 5-10 times than that in the normal year, and the total population in the five provinces over North China decreased by more than 20 million due to a large number of dead people and migrations. In addition, related investigations suggested that the 1876-1878 drought was prevalent worldwide, which has possible link with abnormal high SST in the equatorial central and eastern Pacific, strong El Ni episode and positive AAO anomalies.
|
| [16] |
A gridded reconstruction of warm season precipitation for Asia spanning the past half millennium [J].https://doi.org/10.1175/JCLI-D-12-00099.1 URL Magsci [本文引用: 1] 摘要
The authors reconstructed May-September precipitation over the Asian continent (5 degrees-55 degrees N, 60 degrees-135 degrees E) back to AD 1470 on the basis of tree-ring data, historical documentary records, ice core records, and the few long-term instrumental data series available in the region. They employed the method of Regularized Expectation Maximization (RegEM) and applied it to 44 subregions within the continent. Verification exercises demonstrate that the reconstruction is skillful over most of the study domain, with eastern China, India, and other regions of humid climate displaying the greatest skill. Lower reconstruction skill is observed in semiarid and arid regions, which was attributable at least in part to the scarcity of observations available for calibration/validation. The precipitation reconstructions agree well with previous reconstructions, where they are available. The explanatory value of the reconstruction is illustrated using five historically documented severe droughts in north-central China during the past half millennium. The reconstructions both validate and provide a larger-scale context for understanding these past climate events and their relationship with the Asian summer monsoons.
|
| [17] |
Temporal and spatial variations of drought in China: reconstructed from historical memorials archives during 1689-1911 [J].https://doi.org/10.1371/journal.pone.0148072 URL PMID: 26836807 [本文引用: 1] 摘要
Abstract In China, Zou Zhe (Memorials to the Throne, or Palace Memorials), an official communication to the emperors of China by local officials, offers an opportunity to reconstruct the spatial-temporal distributions of droughts at a high-resolution. A 223-year, 1689-1911, time series of drought events was reconstructed in this study based on 2494 pieces of Zou Zhe. The results show that: 1) on the temporal scale, the drought affected areas, i.e., number of affected counties, showed three peak periods during the last 223 years and nine extreme drought years with more than 300 counties affected have been identified; 2) on the spatial scale, there existed three drought-prone areas in China, i.e., Gansu province and Ningxia Hui Autonomous Region in Northwest China, Shandong, Hebei, and Henan provinces and Tianjin in the North China, and Anhui and Jiangsu provinces in Jianghuai area, respectively; 3) the drought-prone areas have been expanding from North China to South China since the second half of 19th century; 4) on the seasonal scale, summer witnessed the largest number of drought events. Meanwhile, the uncertainties of the results were also discussed, i.e. what caused the spatial-temporal distribution of drought. The results of this study can be used to mitigate the adverse effects of extreme weather events on food increasing and stable production.
|
| [18] |
Asian monsoon failure and megadrought during the last millennium [J].https://doi.org/10.1126/science.1185188 URL PMID: 2041349851012 [本文引用: 1] 摘要
The Asian monsoon system affects more than half of humanity worldwide, yet the dynamical processes that govern its complex spatiotemporal variability are not sufficiently understood to model and predict its behavior, due in part to inadequate long-term climate observations. Here we present the Monsoon Asia Drought Atlas (MADA), a seasonally resolved gridded spatial reconstruction of Asian monsoon drought and pluviais over the past millennium, derived from a network of tree-ring chronologies. MADA provides the spatiotemporal details of known historic monsoon failures and reveals the occurrence, severity, and fingerprint of previously unknown monsoon megadroughts and their close linkages to large-scale patterns of tropical Indo-Pacific sea surface temperatures. MADA thus provides a long-term context for recent monsoon variability that is critically needed for climate modeling, prediction, and attribution.
|
| [19] |
中纬度中国-塔吉克斯坦东西向树轮气候研究[D] .Dendroclimatic research from east to west across middle latitudes areas between China and Tajikistan . |
| [20] |
|
| [21] |
|
| [22] |
清实录 [M].Qingshilu . |
| [23] |
|
| [24] |
|
| [25] |
|
| [26] |
|
| [27] |
|
| [28] |
|
| [29] |
|
| [30] |
|
| [31] |
|
| [32] |
历史文献中的气象记录与气候变化定量重建方法 [J].https://doi.org/10.3969/j.issn.1001-7410.2014.06.07 URL Magsci [本文引用: 1] 摘要
历史文献记载是研究古气候变化的主要代用证据之一,对于定量重建过去数千年的气候变化序列具有独特价值.本文分析了中国历史文献中气象记录的特点及主要内容,重点梳理了利用各类记录定量重建气候变化序列的基本方法,并列举了通过多源记载集成、多时段记录衔接重建过去2000年中国东中部地区温度与干湿变化序列的校准案例;旨在为客观提取气候变化信息、获取高信度的气候变化数据和进一步发展利用文献记载定量重建气候变化序列的方法提供参考依据.主要认识是:1)历史文献中的气象记录主要有4类:天气、气象灾害、物候与区域气候特征及其影响记载;定量重建气候序列的基本方法有:回归分析、物理模型、分等定级、频次统计、类比分析等,但各类记录的来源、格式、连续性、详略与定量化程度不一,导致利用各类记录定量重建气候变化序列的方法也各不相同.2)对根据多源记载或不同方法反演的代用记录进行集成,利用回归分析、方差匹配、记录影响趋势剔除等校准技术,加强多源数据的相互插补方法研究,可解决古代气象记录的漏、缺记问题,是重建连续气候变化序列的主要途径.
Paleoclimatology proxy recorded in historical documents and method for reconstruction on climate change [J].https://doi.org/10.3969/j.issn.1001-7410.2014.06.07 URL Magsci [本文引用: 1] 摘要
历史文献记载是研究古气候变化的主要代用证据之一,对于定量重建过去数千年的气候变化序列具有独特价值.本文分析了中国历史文献中气象记录的特点及主要内容,重点梳理了利用各类记录定量重建气候变化序列的基本方法,并列举了通过多源记载集成、多时段记录衔接重建过去2000年中国东中部地区温度与干湿变化序列的校准案例;旨在为客观提取气候变化信息、获取高信度的气候变化数据和进一步发展利用文献记载定量重建气候变化序列的方法提供参考依据.主要认识是:1)历史文献中的气象记录主要有4类:天气、气象灾害、物候与区域气候特征及其影响记载;定量重建气候序列的基本方法有:回归分析、物理模型、分等定级、频次统计、类比分析等,但各类记录的来源、格式、连续性、详略与定量化程度不一,导致利用各类记录定量重建气候变化序列的方法也各不相同.2)对根据多源记载或不同方法反演的代用记录进行集成,利用回归分析、方差匹配、记录影响趋势剔除等校准技术,加强多源数据的相互插补方法研究,可解决古代气象记录的漏、缺记问题,是重建连续气候变化序列的主要途径.
|
| [33] |
基于SPEI法的陇东地区近50a干旱化时空特征分析 [J].
选取陇东地区近50 a 平均逐月降水和气温数据,采用Mann–Kendall 方法、反距离加权插值(IDW)、功率谱分析、标准化降水蒸散发指数(SPEI)等方法分析了陇东地区近50 a来干旱变化的时空特征。研究显示:近50 a来陇东地区干旱化趋势非常明显,特别是20世纪90年代以来干旱趋势显著。持续干旱事件次数增多,持续干旱累积时间增长,以春夏连旱、伏秋连旱的次数增多为显著特征。发生干旱的周期在不同的时间尺度上表现不一致,随着时间尺度的增长,干旱出现的周期也在变长。干旱发生频率不断加快,尤其是在20世纪90年代以来,极端干旱事件的频率显著上升。近50 a来干旱频率较高的区域在环县西北部和六盘山以西静宁等地,干旱高频区逐步向中南部和东部转移。通过与其他方法对比分析和历史资料比对,证明SPEI在陇东地区有较好的适用性。
Analysis of drought spatial-temporal characteristics based on SPEI in eastern region of Gansu in recent 50 years .
选取陇东地区近50 a 平均逐月降水和气温数据,采用Mann–Kendall 方法、反距离加权插值(IDW)、功率谱分析、标准化降水蒸散发指数(SPEI)等方法分析了陇东地区近50 a来干旱变化的时空特征。研究显示:近50 a来陇东地区干旱化趋势非常明显,特别是20世纪90年代以来干旱趋势显著。持续干旱事件次数增多,持续干旱累积时间增长,以春夏连旱、伏秋连旱的次数增多为显著特征。发生干旱的周期在不同的时间尺度上表现不一致,随着时间尺度的增长,干旱出现的周期也在变长。干旱发生频率不断加快,尤其是在20世纪90年代以来,极端干旱事件的频率显著上升。近50 a来干旱频率较高的区域在环县西北部和六盘山以西静宁等地,干旱高频区逐步向中南部和东部转移。通过与其他方法对比分析和历史资料比对,证明SPEI在陇东地区有较好的适用性。
|
| [34] |
西北干旱区阿克苏河径流对气候波动的多尺度响应 [J].Multi-scale response of runoff to climate change in the Aksu River Basin in arid area of the Northwestern China . |
| [35] |
黑河中上游草原蝗虫生态分布与生境的关系 [J].https://doi.org/10.3321/j.issn:0455-2059.2009.04.008 URL [本文引用: 1] 摘要
以黑河中上游天然草地为例,采用野外调查和定量分析方法,研究了不同草地蝗虫组成、生态种组分布及其与生境的相关关系.结果表明:黑河中上游天然草地的地形、气候条件和土壤、植被组成具有明显异质性;连续4年野外采集蝗虫38种,隶属于3科11属,32个多布种蝗虫在相关性系数0.50处,聚为8个生态种组.蝗虫具有极为广泛的生态适应性,同时草原区的生境决定着蝗虫的地理分布格局,研究区蝗虫主要分布在海拔2 000~3000 m的祁连山地.温度因子是蝗虫种属组成的促进因子,其他因子为抑制因子;温度与降水量是蝗虫密度的促进因子;极端最低温与蝗虫种属组成存在极显著关系,与蝗虫密度存在显著关系.
Relationship between ecological distribution of grasshoppers and their habitats in the middle and upper reaches of Heihe River .https://doi.org/10.3321/j.issn:0455-2059.2009.04.008 URL [本文引用: 1] 摘要
以黑河中上游天然草地为例,采用野外调查和定量分析方法,研究了不同草地蝗虫组成、生态种组分布及其与生境的相关关系.结果表明:黑河中上游天然草地的地形、气候条件和土壤、植被组成具有明显异质性;连续4年野外采集蝗虫38种,隶属于3科11属,32个多布种蝗虫在相关性系数0.50处,聚为8个生态种组.蝗虫具有极为广泛的生态适应性,同时草原区的生境决定着蝗虫的地理分布格局,研究区蝗虫主要分布在海拔2 000~3000 m的祁连山地.温度因子是蝗虫种属组成的促进因子,其他因子为抑制因子;温度与降水量是蝗虫密度的促进因子;极端最低温与蝗虫种属组成存在极显著关系,与蝗虫密度存在显著关系.
|
| [36] |
气象因子对北疆地区蝗虫发生的影响 [J].https://doi.org/10.3969/j.issn.0452-8255.2007.04.012 URL [本文引用: 1] 摘要
选取位于北疆东、西和西北部的3个典型蝗区,即哈密、伊犁和塔城为研究区域,采用合成分析和 距平分析方法,研究温度和降水对3个不同地区蝗虫发生的影响。结果表明:(1)蝗灾发生严重年份与一般年份的月均温度和月降水有显著差异。(2)蝗虫严重 发生的年份,产卵期间(上一年7~8月)的平均气温偏高。(3)塔城和哈密地区,冬季气温较高,孵化期(5~6月)气温偏高、降水偏少有利于蝗灾的发生, 而伊犁地区蝗虫大发生年份与常年比较,冬季和孵化期(5月)的气温偏低。
Effect of meteorological factors on locust occurrence in the North of Mt. Tianshan in Xinjiang .https://doi.org/10.3969/j.issn.0452-8255.2007.04.012 URL [本文引用: 1] 摘要
选取位于北疆东、西和西北部的3个典型蝗区,即哈密、伊犁和塔城为研究区域,采用合成分析和 距平分析方法,研究温度和降水对3个不同地区蝗虫发生的影响。结果表明:(1)蝗灾发生严重年份与一般年份的月均温度和月降水有显著差异。(2)蝗虫严重 发生的年份,产卵期间(上一年7~8月)的平均气温偏高。(3)塔城和哈密地区,冬季气温较高,孵化期(5~6月)气温偏高、降水偏少有利于蝗灾的发生, 而伊犁地区蝗虫大发生年份与常年比较,冬季和孵化期(5月)的气温偏低。
|
| [37] |
河西走廊历史时期气候干湿状况变迁考略 [J].
检索整理了河西走廊史载以来的气候旱涝资料,采用湿润指数公式进行处理分析;探讨了该地区历史上气候干湿状况变迁的概貌
Study on the changes of climate about aridity and humidity in history in Hexi Corridor .
检索整理了河西走廊史载以来的气候旱涝资料,采用湿润指数公式进行处理分析;探讨了该地区历史上气候干湿状况变迁的概貌
|
| [38] |
Multi-stage evolution of social response to flood/drought in the North China Plain during 1644-1911 [J].https://doi.org/10.1007/s10113-013-0516-5 URL Magsci [本文引用: 1] 摘要
How the past human society responded to climatic disasters could provide better understanding on the nature of climate–human–ecosystem interactions and the knowledge of the vulnerability for the society in the context of changing climate. In this paper, the North China Plain in the Qing dynasty (1644–1911) is selected as a typical regional social-ecological system; with historical information kept in official documents, social responsive behavior and measures to flood/drought (e.g., reclamation, disaster relief, migration, revolt) are quantitatively described with proxy indicator time-series. It is found that the dominant responsive strategy altered significantly in different stages: (1) stage of cropland expansion (1644–1720); (2) stage of governmental disaster relief (1721–1780); (3) stage of increasing climate refugees (1781–1860); (4) stage of revolt and emigration (1861–1911). The multi-stage evolution of social response was impacted by various natural and social factors: (1) regional population–food balance and governmental finance were the most important limiting factors; (2) the interaction between the governmental policy and refugees’ behavior in disasters affected the social consequences to a certain extent; (3) decadal-to-multi-decadal climate change would also impact the social response measures, even directly trigger the shift of dominant responsive strategy. This study would be helpful for deeper understanding of social resilience and better responding to climate change and extreme events in the present and future.
|
| [39] |
新疆近半个世纪以来季节性干旱变化特征及其影响研究 [J].
<p>系统分析新疆不同季节的干旱时空分布,讨论干旱对新疆农业生产的影响,研究结果表明:① 新疆四季干旱整体异常均表现为北疆旱(湿润)南疆湿润(旱)或西部干旱(湿润)东部湿润(干旱)2 种基本结构。新疆夏季和冬季有向湿润或涝的趋势发展;② 北疆西部及北疆南部干旱影响范围减小趋势明显;冬季干旱影响范围减小明显;③ 北疆地区的受旱面积增加趋势不显著,南疆地区和东疆地区受旱面积显著增加,干旱除受降水影响外,还受到抗旱灌溉设施、抗旱能力、耕地面积的影响。</p>
Evolution characteristics of seasonal drought in Xinjiang during past 48 years: possible causes and implications .
<p>系统分析新疆不同季节的干旱时空分布,讨论干旱对新疆农业生产的影响,研究结果表明:① 新疆四季干旱整体异常均表现为北疆旱(湿润)南疆湿润(旱)或西部干旱(湿润)东部湿润(干旱)2 种基本结构。新疆夏季和冬季有向湿润或涝的趋势发展;② 北疆西部及北疆南部干旱影响范围减小趋势明显;冬季干旱影响范围减小明显;③ 北疆地区的受旱面积增加趋势不显著,南疆地区和东疆地区受旱面积显著增加,干旱除受降水影响外,还受到抗旱灌溉设施、抗旱能力、耕地面积的影响。</p>
|
| [40] |
Tree-ring based drought reconstruction (AD 1855-2001) for the Qilian Mountains, northwestern China [J].https://doi.org/10.3959/1536-1098-63.1.27 URL [本文引用: 1] 摘要
dendrochronology; drought reconstruction; Qilian Mountains
|
| [41] |
Aridity changes in the eastern Qilian Mountains since AD 1856 reconstructed from tree-rings [J].https://doi.org/10.1016/j.quaint.2012.04.039 URL [本文引用: 1] 摘要
This paper presents a drought reconstruction for the eastern Qilian Mountains based on a tree-ring width chronology developed from three sites of the Qinghai spruce (Picea crassifolia Kom.). The drought reconstruction, spanning the years 1856-2009, was developed by calibrating tree-ring data with the regional averaged Palmer Drought Severity Index (PDSI). The reconstruction explains 49.9% of the actual PDSI variance during the calibration period from 1951 to 2005. The reconstruction shows droughts occurred in the 1900s, the 1920s and early 1930s, and at the turn of the 21st century. Multitaper method spectral analysis indicates the existence of some significant peaks at 2.6, 42 and 56.9 years. Drought variations in the study area are significantly correlated with sea surface temperatures in eastern equatorial Pacific Ocean, northern Indian Ocean, eastern China Sea and the Atlantic Ocean, suggesting a possible connection with the El Nifio-Southern Oscillation, the Asian monsoon and the Westerlies. (C) 2012 Elsevier Ltd and INQUA. All rights reserved.
|
| [42] |
Tree-ring-based annual precipitation reconstruction for the Hexi Corridor, NW China: consequences for climate history on and beyond the mid-latitude Asian continent [J].https://doi.org/10.1111/bor.12017 URL Magsci [本文引用: 1] 摘要
An annual (July to June) precipitation reconstruction for the period AD 1760 2010 was developed from a Picea crassifolia regional tree-ring chronology from two sites in the northern mountainous region of the Hexi Corridor, NW China. This reconstruction explains 52.1% of the actual precipitation variance during the period 1951 to 2010. Spatial correlations with gridded land-surface data reveal that our reconstruction contains a strong regional precipitation signal for the Hexi Corridor and for the southern margin of the Badain Jaran Desert. Significant spectral peaks were identified at 31.9, 11.1, 8.0, 7.0, 3.2, 2.6 and 2.2 years. A large-scale comparison indicates that our reconstruction is more consistent with climate records of a Westerly-dominated Central Asia, and that the Westerlies have a greater impact on the precipitation in this region than the Asian summer monsoon. Our reconstructed precipitation series is significantly correlated with sea-surface temperature (SST) in the tropical Atlantic Ocean (positive), the tropical Indian Ocean (positive), the western tropical Pacific Ocean (positive), and the western North Pacific Ocean (negative). The spatial correlation patterns between our precipitation reconstruction and SSTs of the Atlantic and Pacific Oceans suggest a connection between regional precipitation variations and the high-mid-latitude northern atmospheric circulations (Westerlies and Asian summer monsoon).
|
| [43] |
A 225-year long drought reconstruction for east Xinjiang based on Siberia larch (Larix sibirica) tree-ring widths: Reveals the recent dry trend of the eastern end of Tien Shan [J].https://doi.org/10.1016/j.quaint.2014.11.055 URL [本文引用: 1] 摘要
A tree-ring width chronology developed from a site of Larix sibirica at the eastern end of Tien Shan was employed to study the drought variability of east Xinjiang. The drought reconstruction spanning 1785–2009 was developed by calibrating tree-ring data with standardized precipitation-evapotranspiration index (SPEI), an index indicating regional moisture conditions. The SPEI reconstruction accounted for 45.8% of actual October–August SPEI variance during their common period (1957–2009). Wet periods with SPEI above the 225–year mean occurred around 1785–1799, 1821–1833, 1842–1858, 1864–1873, 1887–1898, 1905–1925, 1937–1948, 1954–1962, 1969–1983 and 1991–1993, while dry periods (SPEI below the mean) occurred in 1800–1820, 1834–1841, 1859–1863, 1874–1886, 1899–1904, 1926–1936, 1949–1953, 1963–1968, 1984–1990 and 1994–2009. There was an aridity aggravation trend since the mid-1980s in east Xinjiang. Our results also suggest that east Xinjiang was influenced by the interactions between the Asian monsoon and the Westerlies circulations.
|
| [44] |
Tree-ring δ18O evidence for the drought history of eastern Tianshan Mountains, northwest China since 1700 AD [J].https://doi.org/10.1002/joc.3911 URL Magsci [本文引用: 1] 摘要
中国科学院寒区旱区环境与工程研究所机构知识库(CASNW OpenIR)以发展机构知识能力和知识管理能力为目标,快速实现对本机构知识资产的收集、长期保存、合理传播利用,积极建设对知识内容进行捕获、转化、传播、利用和审计的能力,逐步建设包括知识内容分析、关系分析和能力审计在内的知识服务能力,开展综合知识管理。
|
| [45] |
利用树轮宽度资料重建东天山木垒地区降水量 [J].https://doi.org/10.11928/j.issn.1001-7410.2015.05.08 URL Magsci [本文引用: 1] 摘要
利用树轮宽度年表重建了东天山木垒地区自公元1727年来上年8月至当年6月降水量,调整自由度后的方差解释量为36%(1962~2007年).过去281年来,木垒地区降水量变化存在5个偏干阶段(1742~1777年、1808~1832年、1853~1876年、1908~1934年和1975~ 1992年)和4个偏湿阶段(1778~ 1807年、1833~ 1852年、1877~1907年和1935~1974年).与代表大范围降水变化的重建序列对比表明,该降水量重建序列与北疆降水变化的3个偏湿期(1778~ 1807年、1833~1852年和1935~1974年)和2个偏干期(1808~1832年、1853~1876年)存在一致.功率谱分析显示该重建序列存在14.3年、10.9年的显著准周期(p<0.05).相关分析结果显示,该重建序列代表了东天山区域局地降水量变化情况,且与邻近的中天山巩乃斯地区降水变化最为相似.随着空间距离的加大,该重建序列与自东北向西南方向上天山不同区域降水变化的相关性逐渐减弱.
Tree Ring Width Based Precipitation for the Mulei Region in the Eastern Tien Shan Mountains .https://doi.org/10.11928/j.issn.1001-7410.2015.05.08 URL Magsci [本文引用: 1] 摘要
利用树轮宽度年表重建了东天山木垒地区自公元1727年来上年8月至当年6月降水量,调整自由度后的方差解释量为36%(1962~2007年).过去281年来,木垒地区降水量变化存在5个偏干阶段(1742~1777年、1808~1832年、1853~1876年、1908~1934年和1975~ 1992年)和4个偏湿阶段(1778~ 1807年、1833~ 1852年、1877~1907年和1935~1974年).与代表大范围降水变化的重建序列对比表明,该降水量重建序列与北疆降水变化的3个偏湿期(1778~ 1807年、1833~1852年和1935~1974年)和2个偏干期(1808~1832年、1853~1876年)存在一致.功率谱分析显示该重建序列存在14.3年、10.9年的显著准周期(p<0.05).相关分析结果显示,该重建序列代表了东天山区域局地降水量变化情况,且与邻近的中天山巩乃斯地区降水变化最为相似.随着空间距离的加大,该重建序列与自东北向西南方向上天山不同区域降水变化的相关性逐渐减弱.
|
| [46] |
天山北坡三屯河流域树轮重建的146a降水变化 [J].https://doi.org/10.3969/j.issn.1002-0799.2014.05.004 URL [本文引用: 1] 摘要
通过对新疆天山北坡三屯河流域2个采点的云杉树轮宽度标准化年表与小渠子和大西沟气象站月降水相关普查分析发现,区域森林中下部林缘年表与小渠子气象站上年7月至当年6月的降水呈显著正相关,其相关系数为0.694(p<0.0001),且具有明确的树木生理学意义。利用区域森林中下部林缘年表序列可较好地重建小渠子气象站146 a来上年7月至当年6月降水量。对天山北坡三屯河流域过去146 a降水变化特征分析表明:天山北坡三屯河流域降水大体经历了6个偏干阶段和6个偏湿阶段,具有2、4、7、14、26 a的变化准周期,1942年和1945年分别是三屯河流域甚至天山山区较大范围内过去146 a的降水最大年份和最小年份,降水的长期变化与天山山区变化趋势有很大的相似性。
Variability of Precipitation over the past 146 years in the Santun River Basin recorded by tree-ring .https://doi.org/10.3969/j.issn.1002-0799.2014.05.004 URL [本文引用: 1] 摘要
通过对新疆天山北坡三屯河流域2个采点的云杉树轮宽度标准化年表与小渠子和大西沟气象站月降水相关普查分析发现,区域森林中下部林缘年表与小渠子气象站上年7月至当年6月的降水呈显著正相关,其相关系数为0.694(p<0.0001),且具有明确的树木生理学意义。利用区域森林中下部林缘年表序列可较好地重建小渠子气象站146 a来上年7月至当年6月降水量。对天山北坡三屯河流域过去146 a降水变化特征分析表明:天山北坡三屯河流域降水大体经历了6个偏干阶段和6个偏湿阶段,具有2、4、7、14、26 a的变化准周期,1942年和1945年分别是三屯河流域甚至天山山区较大范围内过去146 a的降水最大年份和最小年份,降水的长期变化与天山山区变化趋势有很大的相似性。
|
| [47] |
Tree ring δ18O's indication of a shift to a wetter climate since the 1880s in the western Tianshan Mountains of Northwestern China [J].https://doi.org/10.1002/2014JD023027 URL [本文引用: 1] 摘要
Abstract Central Asian droughts have drastically and significantly affected agriculture and water resource management in these arid and semiarid areas. Based on tree ring δ 18O from native, dominant Schrenk spruce ( Picea schrenkiana Fisch. et Mey.), we developed a 30065year (1710–2010) standard precipitation-evaporation index (SPEI) reconstruction from January to August for China's western Tianshan Mountains. The regression model explained 37.6% of the variation in the SPEI reconstruction during the calibration period from 1950 to 2010. Comparison with previous drought reconstructions confirmed the robustness of our reconstruction. The 20th century has been a relatively wet period during the past 30065years. The SPEI showed quasi 2, 5, and 1065year cycles. Several pluvials and droughts with covariability over large areas were revealed clearly in the reconstruction. The two longest pluvials (lasting for 1265years), separated by 5065years, appeared in the 1900s and the 1960s. The most severe drought occurred from 1739 to 1761 and from 1886 to 1911 was the wettest period since 1710. Compared to previous investigations of hydroclimatic changes in the western Tianshan Mountains, our reconstruction revealed more low-frequency variability and indicated that climate in the western Tianshan Mountains shifted from dry to wet in 1886. This regime shift was generally consistent with other moisture reconstructions for the northeastern Tibetan Plateau and northern Pakistan and may have resulted from a strengthened westerly circulation. The opposite hydrological trends in the western Tianshan Mountains and southeastern Tibetan Plateau reveal a substantial influence of strengthened westerlies and weakening of the Indian summer monsoon.
|
| [48] |
The 1920s drought recorded by tree rings and historical documents in the semi-arid and arid areas of Northern China [J]. |
| [49] |
An extreme drought event in the central Tien Shan area in the year 1945 [J].https://doi.org/10.1016/j.jaridenv.2010.03.002 URL [本文引用: 1] 摘要
Moisture sensitive trees from the central Tien Shan area, northwest China show a pattern of extremely low growth in 1945. Evidence from a number of sources indicates that a remarkable drought event, in both spatial and temporal terms, occurred over the central Tien Shan and surrounding areas in that year. Climatological analysis reveals that this significant growth reduction is likely a combined effect of unusually dry and warm conditions. We also show that this extreme drought is associated with a La Ni a or cold phase El Ni o-Southern Oscillation (ENSO) event. Meanwhile, cooler sea surface temperatures (SSTs) in the northern Indian Ocean, particularly in the Arabian Sea, also appear to have contributed to this severe drought episode. Overall, our case study of 1945 extreme drought event in the central Tien Shan area suggests there might be a close link between extreme climate conditions in remote north central Asia and coupled ocean-atmosphere dynamics in the tropics.
|
| [50] |
新疆赛里木湖流域过去373年降水变化的树轮记录 [J].Tree-ring-based precipitation variability over the past 373 years in the Sayram Lake Basin, Tianshan Mountians . |
| [51] |
Definition of the core zone of the “westerlies-dominated climatic regime”, and its controlling factors during the instrumental period [J].https://doi.org/10.1007/s11430-015-5057-y URL [本文引用: 2] 摘要
The term "westerlies-dominated climatic regime" describes the pattern of precipitation/moisture variations between westerliesdominated arid Central Asia(ACA) and mid-latitude monsoon-dominated Asia on decadal to multi-millennial time scales. However, no attempts have been made to define its core region and the possible physical mechanisms responsible during the period of instrumental observations. The present study investigates the spatiotemporal variations of summer and winter precipitation on interannual to decadal time scales over mid-latitudes of the Eurasian continent using Empirical Orthogonal Function(EOF) analysis. Our results suggest the existence of an opposing pattern of summer precipitation variations between ACA and mid-latitude monsoon-dominated Asia and Mediterranean on decadal time scales. Based on these results, the core region influenced by the westerlies is outlined, including arid central Asia and Xinjiang in China(36°–54°N, 50°–90°E). By using monthly NCEP-NCAR reanalysis, the relationship between the "westerlies-dominated climatic regime" and atmospheric circulation were also analyzed. The combination of the zonal climatic teleconnection pattern and anomalous Indian Summer Monsoon Precipitation(ISMP) causes the precipitation characteristics of the "westerlies-dominated climatic regime" precipitation pattern. In addition, the Atlantic Multidecadal Oscillation(AMO) may also have an important effect on the "westerlies-dominated climatic regime".
|
| [52] |
The instability of the East Asian summer monsoon-ENSO relations [J].https://doi.org/10.1007/s00376-002-0029-5 URL Magsci [本文引用: 1] 摘要
The instability in the relation between the East Asian summer monsoon and the ENSO cycle in the long–term variation is found through this research. By instability, we mean that high inter–relation exists in some periods but low inter–relation may appear in some other periods.It is reveals that the interannual variation of the summer atmospheric circulation during the ‘high correlation’ periods (HCP) is significantly different from that during the ‘low correlation’ periods (LCP). Larger interannual variability is found during HCP for trade wind over the tropical eastern Pacific of the Southern Hemisphere, the low—level air temperature over the tropical Pacific, the subtropical high pressure systems in the two hemispheres, and so on. The correlation between summer rainfall over China and ENSO is as well different between HCP and LCP.
|
| [53] |
The variability of the Asian summer monsoon [J].https://doi.org/10.2151/jmsj.85B.21 URL [本文引用: 1] 摘要
Abstract The Asian monsoon is the most significant component of the global climate system. During recent two decades, a more and more efforts have been made to study the Asian monsoon. A substantial achievement has been made in basic physical processes, predictability and prediction since the MONEX of 1978-1979. The major advance in our new understanding of the variability of the Asian summer monsoon has been highlighted in this paper. The present paper is structured with four parts. The first part is the introduction, indicating the new regional division of the Asian monsoon system and significant events of the history of the Asian monsoon research. The second part discusses the annual cycle and seasonal march of the Asian monsoon as the mean state, with a special emphasis on the onset, propagation, active-break cycle and withdrawal of the Asian summer monsoon. The process and mechanism of the earliest onset of the Asian summer monsoon which takes place in the near-equatorial East Indian ocean-central and southern Indochina Peninsula have been well documented. The third part deals with the multiple scale variability of the Asian summer monsoon, including the intraseasonal, interannual and inter-decadal variability. Their dominant modes such as 10-20 day and 30-60 day oscillations for the intraseasonal variability, the Tropospheric Biennial Oscillation (TBO), the Indian Ocean Dippole Mode (IODM) and teleconnection patterns for interannual variability and the 60-year oscillation for the inter-decadal variability, as well as related SST-monsoon relationship and land-monsoon relationship have been discussed in more details. The fourth part is the conclusion, summarizing the major findings and proposing future work.
|
| [54] |
Precipitation and atmospheric circulation patterns at mid-latitudes of Asia [J].https://doi.org/10.1002/joc.626 URL [本文引用: 2] 摘要
Analyses of the coupling between large-scale atmospheric patterns and modifications of regional precipitation regimes at seasonal and annual time scales in different terrain of mid-latitudes in Asia, including western Siberia, Tien Shan and Pamir mountains, and plains of middle Asia and Japanese Islands, were examined based on data from 57 and 88 hydro-climatic stations with 100 and 60 year records, respectively. For the past 100 years, a positive trend in precipitation was revealed in western Siberia, northern regions of Tien Shan and Japanese Islands. North Atlantic Oscillation (NAO) and West Pacific Oscillation (WPO) indices have inverse associations, with average amount of precipitation in western Siberia and in mountains and plains of middle Asia, and positive correlation in central and western regions of Japanese Islands. The Pacific North American (PNA) index is positively correlated with annual precipitation over most of the Japanese Islands. Northern Asian (NA) positive anomalies lead to decrease in winter precipitation in the western and eastern regions of Japanese Islands. We did not find significant impact of PNA or NA on precipitation in middle Asia. We suggest that during the last century, impacts of the western jet stream increased in the northern regions of Tien Shan and Japanese Islands, and weakened in the eastern Japanese Islands. There is a suggestion that conditions are more favourable for precipitation development over continental regions of Asia when the Siberian High is positioned further to the east than further to the west. During dominant development of a zonal atmospheric pattern, the annual and seasonal precipitation decreased over most regions in continental Asia and central Japan.
|
| [55] |
North Atlantic Oscillation/annular mode: two paradigms-one phenomenon [J].https://doi.org/10.1002/qj.49712656402 URL [本文引用: 1] 摘要
The North Atlantic Oscillation (NAO), as defined in the studies of Sir Gilbert Walker ca. 1930, and the zonal-index cycle, as elaborated by investigators at the Massachusetts Institute of Technology some twenty years later, are different interpretations of the same entity, whose time variations are well represented by the leading principal component of the northern hemisphere sea-level pressure field. The NAO paradigm envisions this phenomenon as involving a unique teleconnection pattern in the Atlantic sector that varies on interannual and longer time-scales in association with large-scale atmosphere-ocean interaction. In contrast, the zonal-index-cycle paradigm posits the existence of independent, fundamentally zonally symmetric (or 'annular') modes of variability in the northern and southern hemispheres, both of which fluctuate on intraseasonal as well as interannual time-scales. Spontaneous interactions between the zonally symmetric flow and the eddies are viewed as being largely responsible for the variability of the annular modes at the higher frequencies, and a variety of different mechanisms including, but by no means limited to, atmosphere-ocean interaction are viewed as potentially capable of forcing them at the lower frequencies. The NAO and 'annular mode' paradigms offer contradictory interpretations of the causal linkages that are responsible for the observed correlations between North Atlantic climate variability and variations in a diverse array of zonally averaged quantities. They suggest different research agendas and they evoke quite different images in the popular press. It is argued that the two paradigms cannot be equally valid and that it is in the interests of the community to come to a consensus as to which of them is more appropriate. Rules of evidence are proposed as a basis for making that decision.
|
| [56] |
North Atlantic Oscillation-concepts and studies [J].https://doi.org/10.1023/A:1014217317898 Magsci [本文引用: 1] 摘要
<a name="Abs1"></a>This paper aims to provide a comprehensive review of previous studies and concepts concerning the North Atlantic Oscillation. The North Atlantic Oscillation (NAO) and its recent homologue, the Arctic Oscillation/Northern Hemisphere annular mode (AO/NAM), are the most prominent modes of variability in the Northern Hemisphere winter climate. The NAO teleconnection is characterised by a meridional displacement of atmospheric mass over the North Atlantic area. Its state is usually expressed by the standardised air pressure difference between the Azores High and the Iceland Low. ThisNAO index is a measure of the strength of the westerly flow (positive with strong westerlies, and vice versa). Together with the El Niño/Southern Oscillation (ENSO) phenomenon, the NAO is a major source of seasonal to interdecadal variability in the global atmosphere. On interannual and shorter time scales, the NAO dynamics can be explained as a purely internal mode of variability of the atmospheric circulation. Interdecadal variability maybe influenced, however, by ocean and sea-ice processes.
|
| [57] |
|
| [58] |
On the teleconnection patterns to precipitation in the eastern Tianshan Mountains, China [J].https://doi.org/10.1007/s00382-016-3500-1 URL [本文引用: 1] 摘要
The Tianshan Mountains are known as the02“water tower” in the arid region of Central Asia. Change in precipitation amount and pattern can have a profound impact on regional civilization and life supporting ecosystems. For this study, a systematic analysis of long-term precipitation data for the eastern Tianshan Mountains was conducted to investigate the influence of climate teleconnections on annual and intra-annual precipitation using data collected between 1951 and 2014 from 39 meteorological stations. Annual precipitation has increased during the past six decades at an average rate of 6.702mm/1002years largely due to the increase in precipitation during the intra-annual wet period (May–October). The annual precipitation and its rate of increase were higher in the northwestern region. Annual precipitation was found to be most strongly correlated with index of Indian Summer Monsoon (ISM), and partially correlated with indices of Pacific Decadal Oscillation (PDO), Pacific North American Teleconnection Pattern (PNA), Arctic Oscillation (AO), El Nino–Southern Oscillation (ENSO), and North Atlantic Oscillation (NAO). ISM was positively correlated with the precipitation in almost the entire region during the intra-annual wet period, while it showed positive correlations in the northern slope and the alpine region, and negative correlations in the southern slope during the intra-annual dry period (November to April). PDO had much weaker influence both in spatial scale and strength and primarily affected low elevations on the southern slopes of the middle and western regions. The impacts of PNA and AO on precipitation were weak and localized. ENSO and NAO indices were almost not correlated with annual precipitation observation in the eastern Tianshan Mountains.
|
| [59] |
How ENSO impacts precipitation in southwest central Asia [J].
|
| [60] |
Precipitation trends and teleconnections identified using quantile regressions over Xinjiang, China [J].https://doi.org/10.1002/joc.4794 URL [本文引用: 1] 摘要
Abstract Precipitation in Xinjiang, China, was modelled with covariates, such as time and climate indices, using quantile regressions. Compared to a frequentist quantile regression, a Bayesian quantile regression tended to generate smoother and narrower band confidence intervals of quantile regression coefficients, especially at extremely high and low quantile levels. A full picture of temporal trends at quantile levels from 0.01 to 0.99 indicates that the wet season (May to August) precipitation in Northern Xinjiang and the western regions of Southern Xinjiang showed statistically significant increases with different magnitudes over all quantile levels. However, the wet season precipitation in South-eastern Xinjiang decreased at some quantile levels. The Eastern Atlantic/Western Russia (EAWR) pattern was the most significant large-scale climate pattern that influenced wet season precipitation when compared to other studied patterns, i.e. the El Nio-Southern Oscillation (ENSO), the Atlantic Multidecadal Oscillation (AMO), the Pacific Decadal Oscillation (PDO), the Northern Oscillation (NO), the Arctic Oscillation (AO) and the North Atlantic Oscillation (NAO). The quantile regression coefficients associated with the EAWR index positively increased from low to high quantile levels. The ENSO significantly affected the extremely high wet season precipitation in Xinjiang. El Ni o increased and La Ni a decreased wet season precipitation in Northern Xinjiang, with different magnitudes at different quantile levels. Other climate patterns, i.e. the AMO, PDO, NO, NAO and AO, did not evidently affect the wet season precipitation conditional on the ENSO and EAWR. These findings suggest that the predictability of seasonal precipitation over Xinjiang can be improved by incorporating indices associated with the ENSO and EAWR as model predictors.
|
| [61] |
Fifty-year climate change and its effect on annual runoff in the Tarim River Basin, China [J].https://doi.org/10.1016/j.quaint.2008.11.011 URL [本文引用: 1] 摘要
Based on the hydrologic and meteorological data in the Tarim River basin from 1958 to 2004, the trend, characteristics and spatial variation of climate change in the upper reaches of the Tarim River were examined in the study. The long-term trend of climate change and hydrological variations were determined by using both Mann–Kendall and Mann–Whitney nonparametric tests. The results showed that the temperature and precipitation had significantly increased in the drainage basin in the mid-1980s. The climate was the warmest in 1990s among the recent 50 years. The increase of temperature in the tributaries of the Aksu River and Kaidu-Kongque River is higher than that in the tributaries of the Yarkand River and Hotan River. The streamflow at Aksu River showed a significant increasing monotonic trend. The annual runoff in the Aksu River had increased by 10.9% since 1990. The independence test of temperature and precipitation with χ 2 of the El Nino event reveals that there is no significant effect of the El Nino and La Nina events on the annual temperature and annual precipitation in the drainage basin.
Fifty-year climate change and its effect on annual runoff in the Tarim River Basin, China [J]. |

/
| 〈 |
|
〉 |
