
中国建设用地与区域社会经济发展关系的空间计量研究
作者简介:叶 浩(1981-),男,安徽利辛人,博士,主要研究方向为土地资源管理与评价。E-mail:yeneez@163.com
收稿日期: 2010-12-07
要求修回日期: 2011-03-16
网络出版日期: 2012-02-20
基金资助
国家自然科学基金(40871255)、广东高校优秀青年创新人才培育计划项目(wym09099)联合资助
Spatial Econometrics Study of Relationship Between Regional Socio-economic Development and Construction Land in China
Received date: 2010-12-07
Request revised date: 2011-03-16
Online published: 2012-02-20
Copyright
利用空间计量模型,对中国大陆地区的30个省、市、自治区2008年的建设用地面积与社会经济发展之间的关系进行了研究。研究表明:30个省、直辖市和自治区地区建设用地面积、GDP、总人口和城市化率都有显著的空间相关特征,一个区域社会经济的发展不仅会驱动自身区域建设用地的扩张,而且会带动邻近区域的建设用地的增长。传统上只从时间维度出发的研究思路,忽视空间维度的相关性和异质性,低估了区域社会经济发展对建设用地增长的作用,必须在普通面板线性回归模型中描述的基础上引入空间变量进行修正。计量模型检验表明,城市化水平对建设用地总规模的影响不甚显著。说明中国大部分省份的农村居民点用地的利用效率普遍偏低。因此,农村居民点用地的调整与优化已迫在眉睫,从长远看来,提高城市化水平,打破城乡二元化的土地制度,建立统一的土地市场,是缓解土地资源紧缺、提高土地利用效率的有效途径。
叶浩 , 张鹏 , 濮励杰 . 中国建设用地与区域社会经济发展关系的空间计量研究[J]. 地理科学, 2012 , 32(2) : 149 -155 . DOI: 10.13249/j.cnki.sgs.2012.02.149
In this paper, the relationship between construction land and socio-economic development of 30 provinces, municipalities and autonomous regions of China in 2008 was studied by using spatial econometric models. The results show that: construction land area, GDP, total population and urbanization rate all have the significant space-related features of 30 provinces, municipalities and autonomous regions. A regional socio-economic development will not only drive the expansion of construction land itself, and lead to construction land growth of the ambient areas. The traditional research ideas only focused on the time dimension, but ignored the relevance and heterogeneity of spatial dimensions, underestimated the social and economic development of region in the role of construction land growth. Spatial variables must be introduced to modify the general panel linear regression model. From the general model and the spatial error regression model test results, the spatial error model′s logL and AIC, SC values were significantly improved, and these regression variables are significant. Due to space spillover effects, the sum of three elements′ coefficients of the spatial error regression model is greater than the general model. It indicates that the estimation methods ignoreing spatial factors underestimate the regional socio-economic development′s effect to construction land′s growth. SEM model in the spatial error coefficient of 0.706 is significant at 1% level, indicating a regional socio-economic development will not only drive the expansion of its construction land area, and will lead to the growth of the adjacent areas′ construction land. The spatial error regression model estimation results, compared with the general model, show that the contribution of the total population was significantly greater than the contribution of GDP and urbanization, which means that the urbanization should be speed up, and population growth be strictly controlled. The econometric model tests show that the urbanization level′s coefficient is very small and has minor effect to the total amount of construction land. In general, with the urbanization level′s increase, the rural population will gradually decrease and rural residential land also should be reduced. However, the various regions of China showed that the positive role of the urbanization, and rural residential land was weakened. At present, the total village construction land is 4.6 times more than that of urban construction land. The rural residential land per capita is much larger than the urban construction land per capita. It indicates that the land use efficiency in most provinces′ rural residential is low generally. Therefore, the adjustment and optimization of rural residential land is imminent. In the long run, to improve the level of urbanization, break the urban and rural dualistic land structure and to establish a unified land market are effective ways to ease the shortage of land resources and improve the land use efficiency.
Table 1 Spatial autocorrelation of model variable and residual表1 模型变量与残差的空间自相关性 |
| 变量 | lnG | lnC | lnP | URB | RES |
|---|---|---|---|---|---|
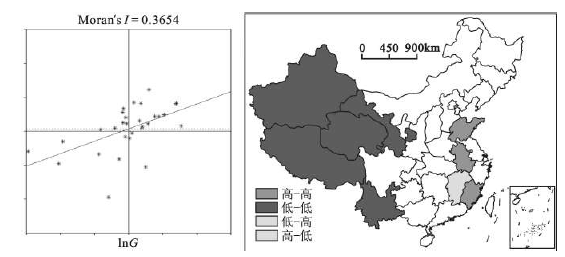
| Moran I | 0.3654 | 0.0762 | 0.2467 | 0.4080 | 0.3640 |
Fig.1 Moran significance level of GDP图1 GDP 的Moran显著性水平 |
Fig.2 Moran significance level of total population图2 总人口的Moran显著性水平 |
Fig.3 Moran significance level of URB图3 城市化率的Moran显著性水平 |
Table 2 Model parameters of general model表2 一般模型的估计结果 |
| 模型变量 | 系数 | 标准差 | T统计量 | 小概率P |
|---|---|---|---|---|
| CONSTANT | 7.2467 | 0.7610 | 9.5224 | 0.0000 |
| lnG | 0.3066 | 0.3415 | 0.8978 | 0.3775 |
| lnP | 0.5289 | 0.3595 | 134713 | 0.1531 |
| URB | -0.0125 | 0.0115 | -1.0938 | 0.2841 |
| 统计检验 | R-squared | log L | AIC | SC |
| 统计值 | 0.8112 | -10.7499 | 29.4998 | 35.1046 |
Table 3 Model parameters of spatial error model表3 SEM的ML估计结果 |
| 模型变量 | 系数 | 标准差 | Z值 | 小概率P |
|---|---|---|---|---|
| CONSTANT | 6.0352 | 0.6456 | 9.3484 | 0.0000 |
| lnG | 0.3546 | 0.2584 | 1.3725 | 0.1699 |
| lnP | 0.6157 | 0.2756 | 2.2344 | 0.0255 |
| URB | -0.0115 | 0.0082 | -1.4082 | 0.1591 |
| λ | 0.7060 | 0.1338 | 5.2781 | 0.0000 |
| 统计检验 | R-squared | log L | AIC | SC |
| 统计值 | 0.8852 | -5.5943 | 19.1887 | 24.7934 |
The authors have declared that no competing interests exist.
| [1] |
|
| [2] |
|
| [3] |
|
| [4] |
IIASA. Modeling land-use and land-cover changes in Europe and Northern Asia[R]. Research plan, 1999:14-21.
|
| [5] |
|
| [6] |
|
| [7] |
|
| [8] |
|
| [9] |
|
| [10] |
|
| [11] |
|
| [12] |
|
| [13] |
|
| [14] |
|
| [15] |
|
| [16] |
国家统计局.中国统计年鉴[M]北京:中国统计出版社,2009.
|
| [17] |
|
| [18] |
|
| [19] |
|
| [20] |
|
| [21] |
国土资源部.中国国土资源统计年鉴[M]北京:地质出版社,2006,2010.
|
/
| 〈 |
|
〉 |

