
1982~2010年广州市人口增长与空间分布演变研究
作者简介:周春山(1964-),男,河南信阳人,教授,博士生导师,主要从事区域发展与城乡规划、城市地理学研究。E-mail:zhoucs@mail.sysu.edu.cn
收稿日期: 2013-04-16
要求修回日期: 2013-10-15
网络出版日期: 2014-09-10
基金资助
国家自然科学基金(41271182)资助
The Growth and Distribution of Population in Guangzhou City in 1982-2000
Received date: 2013-04-16
Request revised date: 2013-10-15
Online published: 2014-09-10
Copyright
基于第三、四、五和六次人口普查资料,利用数学模型对1982~2010年广州市近30 a来的人口增长与空间分布规律深入探讨。得出以下结论:① 近30 a来广州市人口保持稳定增长,人口分布总体上趋于分散,人口变化趋于缓和,尤其是近10 a来广州中心城区人口密度缓慢降低,近郊区人口密度较快增长,远郊区人口密度逐步增加的特征更加明显;② 人口空间分布由“峰值单中心+外围小中心”结构演变为“扁平化多中心+外围小中心”;③ 广州市人口发展已进入成熟晚期阶段向老年阶段的过渡时期,但中心城区人口缺口尚未出现;④ 广州市人口郊区化始于20世纪90年代末,2000年以来郊区化明显加快,属于市中心发展型郊区化。
周春山 , 边艳 . 1982~2010年广州市人口增长与空间分布演变研究[J]. 地理科学, 2014 , 34(9) : 1085 -1092 . DOI: 10.13249/j.cnki.sgs.2014.09.1085
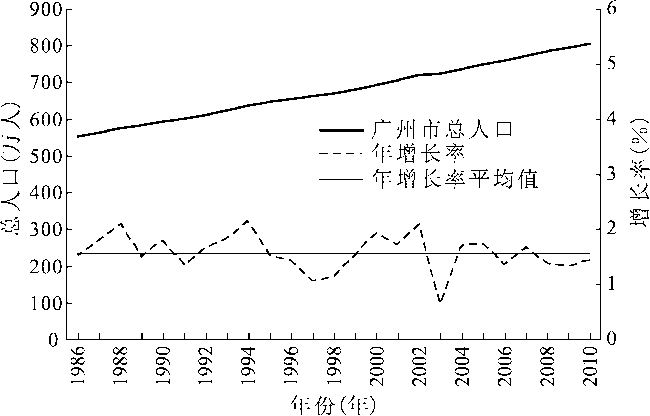
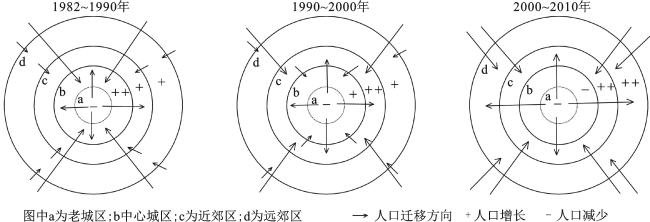
The growth and change of population are closely related to the urban development. The regularity of urban population changes provides supports for the policy-making concerned urban development. As the frontier region of reform and opening up, Guangzhou has experienced a rapid economic, social development, and the population change in the metropolitans is earlier than others in China. Using the data of the third, the fourth, the fifth and the sixth censuses at a Neighborhood (Jie Dao in Chinese) and Town (the NT) level by the mathematic methods of density analysis, concentration index, trend surface analysis and regression analysis model, article reveals the characteristics and law of the population growth and distribution in Guangzhou. The main conclusions are as follows: 1) the population growth of Guangzhou can be divided into three stages: the rapid growth stage, from 1986 to 1994, with annual growth rate of 1.74 %; the fluctuation growth stage, from 1995 to 2003, with that of 1.59%; and the slow growth stage, from 2004 to 2010, with that of 1.47 %. The total population has a stable increase in 1986-2010. 2) There is an obvious spatial difference for population growth at the NT level. The number of the NT with the population reduction was increase, while the NT which has rapid population growth has spred from central district to the near suburb and the outer suburb. The distribution of population in Guangzhou maintained a de-centralized regular pattern. Especially last 10 years, it become more and more obvious than the population density in central city is decreased slowly, rapid increase in near suburbs, and stable increase in outer suburbs; 3) The population distribution of Guangzhou presented to be decentralization and equalization. Population concentration index decreased gradually and the trend of population gravity migration moved eastward significantly. The spatial distribution of population has a significant change, which presents a typical “peak value single center + small centers outside” space structure before 2000. Since 2000, the population density in central district expands eastward and northward, the population density in near suburb has a rapid increase, a new population density peak was formed and then spatial distribution presents an obvious “flatten main centers + small centers outside” space structure in recent 10 years. 4) The population growth of Guangzhou was at growing stage before 1990s, was at a mature stage in 2000, and now is in the transition phase from the stage of mature late to the stage of old age, but the population gap in center city has not appeared until now; 5) the suburbanization in Guangzhou, the type of a central district development, had appeared since 1990s, and became obvious since 2000s in Guangzhou. 6) There was an obvious difference in population growth and spatial distribution between metropolitan of China and the developed countries. The population growth in most metropolitan of China is in the earlier stage of urbanization, while most of the developed countries have already moved to the stage of re-urbanization.
Key words: population growth; population distribution; suburbanization; Guangzhou
Fig.1 The population growth in Guangzhou, 1986-2010图1 1986~2010年广州市总人口增长 |
Table 1 Comparison of population growth in neighborhoods and towns in Guangzhou, 1982-2010表1 1982~2010年广州市街镇人口增长类型划分 |
| 类型 | 年均递增率(%) | 1982~1990年 | 1990~2000年 | 2000~2010年 | |||
|---|---|---|---|---|---|---|---|
| 街镇数(个) | 比重(%) | 街镇数(个) | 比重(%) | 街镇数(个) | 比重(%) | ||
| 快速增长[>(+s)] | 5.38~38.45 | 28 | 22.58 | 60 | 48.39 | 17 | 11.89 |
| 较快增长(,+s) | 2.83~5.38 | 20 | 16.13 | 18 | 14.52 | 22 | 15.38 |
| 缓慢增长(0,) | 0~2.83 | 52 | 41.94 | 28 | 22.58 | 55 | 38.46 |
| 缓慢减少(-,0) | -2.83~0 | 19 | 15.32 | 10 | 8.06 | 34 | 23.78 |
| 较快减少(<-) | -16.81~-2.83 | 5 | 4.03 | 8 | 6.45 | 15 | 10.49 |
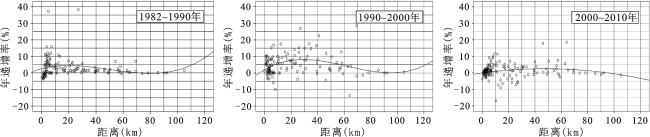
Fig.2 The spatial distribution of population annual growth rate in neighborhoods and towns in Guangzhou,1982-2010图2 1982~2010年广州市街镇人口年递增率空间分布 |
Fig.3 The pattern for the change of population distribution in Guangzhou, 1982-2010图3 1982~2010年广州市人口变化空间模式 |
Fig.4 Three dimensional model on population density in Guangzhou in 1982-2010 (Unit:×104 persons/km2)图4 1982~2010年广州市人口密度三维模型图(单位:万人/km2) |
Table 2 R2 on tendency panel of population in Guangzhou in 1982-2010表2 1982~2010年广州市人口趋势面分析R2值 |
| 模式 | R2 | |
|---|---|---|
| 1982年 | lndx = ln13723.22-0.118x | 0.885 |
| 1990年 | lndx = ln16727.18-0.120x | 0.868 |
| 2000年 | lndx = ln25903.53-0.078x2 | 0.874 |
| 2010年 | lndx = ln46203.87-3481.67x+72.07x2-0.428x3 | 0.758 |
Table 3 Mathematical module on population in Guangzhou in 1982-2010表3 1982~2010年广州市人口密度数学模拟 |
| 趋势面次数 | ||||
|---|---|---|---|---|
| 1 | 2 | 3 | 4 | |
| 1982年 | 0.262 | 0.279 | 0.313 | 0.335 |
| 1990年 | 0.266 | 0.318 | 0.351 | 0.363 |
| 2000年 | 0.311 | 0.358 | 0.369 | 0.381 |
| 2010年 | 0.412 | 0.479 | 0.512 | 0.535 |
The authors have declared that no competing interests exist.
| [1] |
|
| [2] |
|
| [3] |
|
| [4] |
|
| [5] |
|
| [6] |
|
| [7] |
|
| [8] |
|
| [9] |
|
| [10] |
|
| [11] |
|
| [12] |
|
| [13] |
|
| [14] |
|
| [15] |
|
| [16] |
|
| [17] |
|
| [18] |
|
| [19] |
|
| [20] |
|
| [21] |
|
| [22] |
|
| [23] |
|
| [24] |
|
| [25] |
|
| [26] |
|
| [27] |
|
| [28] |
|
| [29] |
|
| [30] |
|
| [31] |
|
| [32] |
|
| [33] |
|
/
| 〈 |
|
〉 |
