
特大城市空间形态差异对交通网络效率的影响
|
曹小曙(1970-), 男, 甘肃灵台人, 教授, 博导, 主要从事地理与规划研究。E-mail: caoxsh@mail.sysu.edu.cn |
收稿日期: 2018-01-31
要求修回日期: 2018-05-06
网络出版日期: 2019-01-10
基金资助
国家自然科学基金项目(41671160)
国家自然科学基金项目(41171139)
广西高校中青年教师科研基础能力提升项目资助(2019KY0373)
版权
Influence of Different Spatial Forms for Metropolitans on Transportation Network Efficiency
Received date: 2018-01-31
Request revised date: 2018-05-06
Online published: 2019-01-10
Supported by
National Natural Science Foundation of China(41671160)
National Natural Science Foundation of China(41171139)
The Scientific Research Basic Ability Promotion Foundation of Guangxi Universities' Young and Middle-aged Teachers(2019KY0373)
Copyright
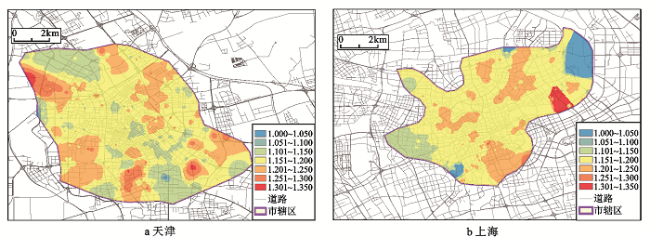
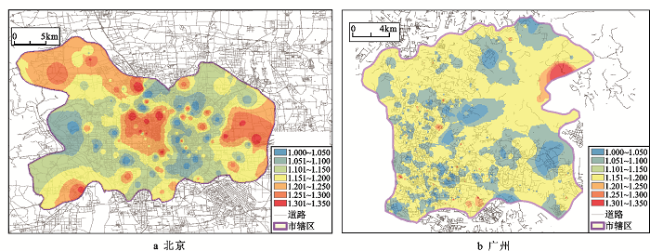
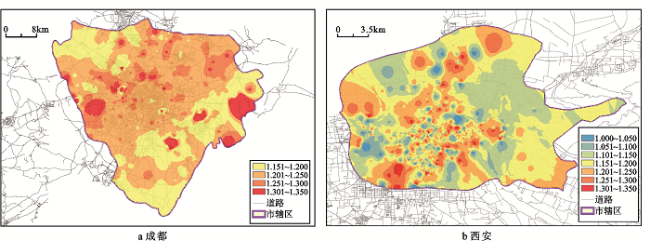
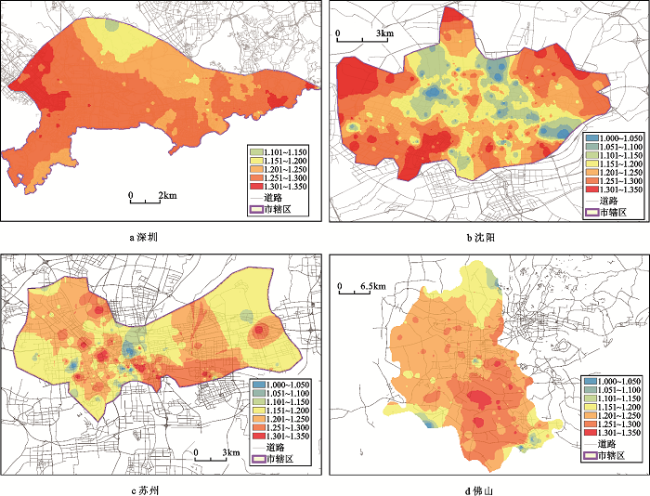
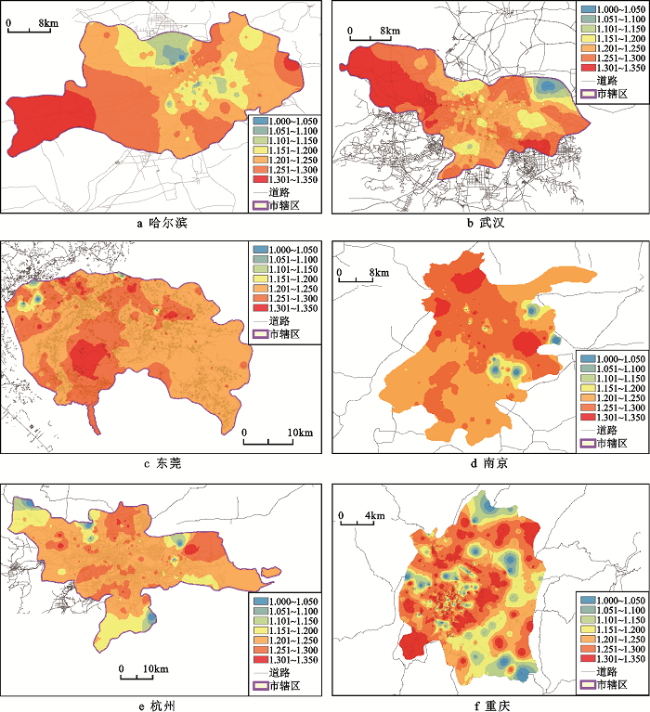
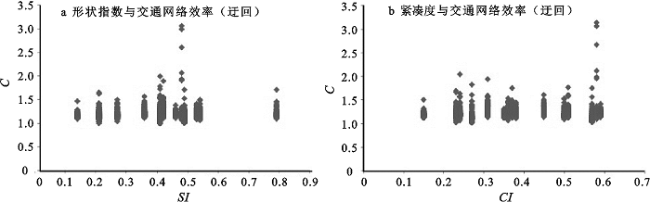
以交通网络出行迂回作为交通网络效率分析的切入点,选取形状指数、紧凑度作为空间形态分析指标,对特大城市空间形态布局进行类型划分,并挖掘各城市交通网络效率空间分布差异特征,基于多元回归模型剖析中国各特大城市空间形态布局与交通网络效率之间的影响关系。研究表明:① 5种类型城市交通效率高低分布差异明显,紧凑圆形城市边缘区交通网络效率较低,而非紧凑带形交通效率低的区域多分布于城市核心区,紧凑方形城市交通网络效率高地区分布较为集中,而非紧凑方形交通效率低的地区分布较为分散,紧凑带形城市面积越小则交通效率越高。② 就城市空间布局与交通网络效率影响关系而言,随着城市形状指数的增大,城市交通迂回值未进一步增大,说明城市形态布局接近圆形均匀分布时,其城市交通网络效率较高;随着城市紧凑度值的增加,城市交通迂回程度值亦不断增加,说明城市形态布局程度越紧密,反而其交通网络效率越低,当城市形态布局紧密程度适中时,交通网络效率水平较高。
曹小曙 , 梁斐雯 , 陈慧灵 . 特大城市空间形态差异对交通网络效率的影响[J]. 地理科学, 2019 , 39(1) : 41 -51 . DOI: 10.13249/j.cnki.sgs.2019.01.005
With the rapid urbanized for Chinese metropolitans, the expansions of urban space are influenced by the efficiency of transport network, which means the different of megalopolises have been plagued by different degrees of travel congestion. By taking transportation network travel circuity as the entry point of transportation network efficiency analysis, the shape index and compactness are selected as indices of spatial morphological analysis in this paper. Then the spatial morphological layout of metropolitans is divided into types, which means spatial form layout of metropolitans is classified by urban form index. At the same time, it also tries to excavate the spatial distribution difference characteristics of urban transportation network efficiency. Finally, based on the multivariate regression model, the relationship between the spatial morphological layout of China's metropolitans and the efficiency of transportation network is analyzed. The result shows that the distributions of transport efficiency in five types form of metropolitans are obviously different. Low efficiency of transportation network for compact circular cities are in urban fringe areas and low efficiency of transportation network for non-compact belt cities are mostly distributed in the urban core areas. High network efficiency area distribution of compact square cities is more concentrated. The low network efficiency area distribution of non-compact squares cities is more dispersed. The smaller the size of the compact belt cities, the higher the transport network efficiency. It can be found out that with the increase of urban shape index, the urban transport circuity has not been further increased, which means that when the urban form layout is close to the circular uniform distribution, the urban transport network efficiency is higher; with the increase of urban compactness, the value of urban transport circuity is increasing, which shows that when the urban form layout is more compact, but the efficiency of transport network is lower. It means that the efficiency level of transport network is higher when the urban form layout is loose. What are the differences in urban traffic efficiency layout caused by the difference of spatial form in metropolitans? What is the relationship between the spatial form of metropolitans and the impact on transportation network efficiency? Under the influence of the rapid development of the construction environment of metropolitans, these two key issues have become the focus of this study. This article studies the transport network efficiency under the difference of spatial form layout, which can help to analyze and improve the travel efficiency of metropolitans.
表1 16大城市基本信息Table 1 Information of the 16 metropolitans |
| 序号 | 城市名称 | 常住人口 (万人) | 市辖区面积(km2) | 中心区面积(km2) | 序号 | 城市名称 | 常住人口(万人) | 市辖区面积(km2) | 中心区面积(km2) |
|---|---|---|---|---|---|---|---|---|---|
| 1 | 重庆 | 1908.45 | 34 505 | 1329 | 9 | 苏州 | 802.24 | 4653 | 458 |
| 2 | 北京 | 1879.60 | 16410.54 | 1401 | 10 | 东莞 | 736.42 | 2460 | 929 |
| 3 | 天津 | 1295.47 | 11946.88 | 870 | 11 | 佛山 | 708.58 | 3798 | 373 |
| 4 | 上海 | 1239.60 | 6340 | 1499.83 | 12 | 杭州 | 700.13 | 4876 | 506 |
| 5 | 广州 | 1208.58 | 7434.4 | 1237 | 13 | 南京 | 678.14 | 6587 | 755 |
| 6 | 成都 | 1123.81 | 3240 | 616 | 14 | 西安 | 648.54 | 3874 | 501 |
| 7 | 深圳 | 924.96 | 1997.3 | 900 | 15 | 沈阳 | 586.50 | 3471 | 465 |
| 8 | 武汉 | 858.82 | 1738 | 455 | 16 | 哈尔滨 | 551.10 | 10198 | 428 |
表 2 16个特大城市空间形态布局指标值Table 2 Spatial morphological layout index of the 16 metropolitans |
| 序号 | 城市名称 | 城市形状 | 形状指数 | 紧凑度 | 序号 | 城市名称 | 城市形状 | 形状指数 | 紧凑度 |
|---|---|---|---|---|---|---|---|---|---|
| 1 | 天津 | 圆形 | 0.793 | 0.374 | 9 | 佛山 | 带形 | 0.414 | 0.507 |
| 2 | 上海 | 圆形 | 0.762 | 0.583 | 10 | 哈尔滨 | 带形 | 0.414 | 0.241 |
| 3 | 成都 | 方形 | 0.542 | 0.501 | 11 | 武汉 | 带形 | 0.406 | 0.268 |
| 4 | 西安 | 方形 | 0.535 | 0.383 | 12 | 东莞 | 带形 | 0.357 | 0.450 |
| 5 | 广州 | 方形 | 0.492 | 0.566 | 13 | 南京 | 带形 | 0.271 | 0.358 |
| 6 | 北京 | 方形 | 0.460 | 0.587 | 14 | 杭州 | 带形 | 0.207 | 0.232 |
| 7 | 沈阳 | 带形 | 0.427 | 0.348 | 15 | 深圳 | 带形 | 0.136 | 0.152 |
| 8 | 苏州 | 带形 | 0.417 | 0.305 | 16 | 重庆 | 带形 | 0.104 | 0.137 |
表 3 16个特大城市交通网络效率(迂回值)等级占比(%)Table 3 Circuity value ratio level of the 16 metropolitans(%) |
| 序号 | 城市名称 | 1~1.050 | 1.051~1.100 | 1.101~1.150 | 1.151~1.200 | 1.201~1.250 | 1.251~1.300 | ≥1.301 |
|---|---|---|---|---|---|---|---|---|
| 1 | 天津 | 0.24 | 0.00 | 1.20 | 48.26 | 40.70 | 7.08 | 2.52 |
| 2 | 上海 | 0.35 | 0.12 | 9.11 | 63.44 | 24.57 | 1.15 | 1.27 |
| 3 | 成都 | 0.46 | 0.00 | 17.73 | 68.02 | 9.72 | 2.17 | 1.90 |
| 4 | 西安 | 0.00 | 0.00 | 2.01 | 12.34 | 58.22 | 24.09 | 3.35 |
| 5 | 广州 | 7.79 | 30.45 | 36.15 | 17.46 | 5.41 | 2.09 | 0.65 |
| 6 | 北京 | 0.13 | 0.00 | 0.67 | 22.72 | 69.76 | 5.78 | 0.94 |
| 7 | 沈阳 | 0.00 | 0.00 | 8.06 | 65.35 | 23.27 | 2.94 | 0.38 |
| 8 | 苏州 | 3.19 | 0.00 | 1.77 | 26.37 | 42.30 | 12.04 | 14.34 |
| 9 | 佛山 | 1.02 | 0.00 | 2.49 | 16.23 | 54.39 | 17.40 | 8.48 |
| 10 | 哈尔滨 | 0.00 | 0.47 | 2.95 | 53.33 | 29.46 | 7.60 | 6.20 |
| 11 | 武汉 | 4.78 | 49.24 | 38.59 | 5.12 | 1.17 | 0.25 | 0.84 |
| 12 | 东莞 | 0.71 | 0.00 | 0.11 | 42.83 | 41.95 | 11.28 | 3.12 |
| 13 | 南京 | 1.01 | 0.13 | 8.69 | 49.12 | 32.62 | 5.92 | 2.52 |
| 14 | 杭州 | 0.79 | 0.40 | 10.65 | 71.38 | 13.12 | 2.23 | 1.43 |
| 15 | 深圳 | 0.00 | 0.00 | 13.51 | 62.74 | 20.08 | 2.90 | 0.77 |
| 16 | 重庆 | 0.62 | 0.15 | 10.60 | 34.13 | 32.97 | 13.08 | 8.44 |
| [1] |
|
| [2] |
|
| [3] |
周春山, 叶昌东 . 中国特大城市空间增长特征及其原因分析[J]. 地理学报, 2013,68(6):728-738.
[
|
| [4] |
王慧芳, 周恺 . 2003-2013 年中国城市形态研究评述[J]. 地理科学进展, 2014,33(5):689-701.
[
|
| [5] |
房艳刚, 刘鸽, 刘继生 . 城市空间结构的复杂性研究进展[J]. 地理科学, 2005,25(6):754-761.
[
|
| [6] |
陈群元, 尹长林, 陈光辉 . 长沙城市形态与用地类型的时空演化特征[J]. 地理科学, 2007,27(2):273-280.
[
|
| [7] |
刘登娥, 陈爽 . 近30年来苏锡常城市增长形态过程与聚散规律[J]. 地理科学, 2012,32(1):47-54.
[
|
| [8] |
陆张维, 徐丽华, 吴次芳 . 基于凸壳原理的杭州城市扩展形态演化分析[J]. 地理科学, 2015,35(12):1533-1541.
[
|
| [9] |
谌丽, 张文忠, 李业锦 , 等. 北京城市居住空间形态对居民通勤方式的影响[J]. 地理科学, 2016,36(5):697-704.
[
|
| [10] |
|
| [11] |
|
| [12] |
|
| [13] |
|
| [14] |
|
| [15] |
周素红, 闫小培 . 广州城市空间结构与交通需求关系[J]. 地理学报, 2006,60(1):131-142.
[
|
| [16] |
闫小培, 毛蒋兴 . 高密度开发城市的交通与土地利用互动关系——以广州为例[J]. 地理学报, 2004,59(5):643-652.
[
|
| [17] |
|
| [18] |
|
| [19] |
曹小曙, 林强 . 基于结构方程模型的广州城市社区居民出行行为[J]. 地理学报, 2011,66(2):167-177.
[
|
| [20] |
|
| [21] |
|
| [22] |
|
| [23] |
|
| [24] |
|
| [25] |
|
| [26] |
|
| [27] |
|
| [28] |
|
| [29] |
|
| [30] |
|
| [31] |
何晓群 . 应用回归分析[M]. 北京: 人民大学出版社, 2015.
[
|
| [32] |
史海运 . 河北省中心城市空间形态比较研究[D]. 邯郸:河北工程大学, 2008.
[
|
| [33] |
王新生, 刘纪远, 庄大方 , 等. 中国特大城市空间形态变化的时空特征[J]. 地理学报, 2005,60(3):392-400.
[
|
| [34] |
毛广雄, 丁金宏, 曹蕾 . 城市紧凑度的综合测度及驱动力分析——以江苏省为例[J]. 地理科学, 2009,29(5):627-633.
[
|
| [35] |
中华人民共和国国家统计局. 2010年第六次全国人口普查主要数据 [M]. 北京: 中国统计出版社, 2011.
[
|
| [36] |
中华人民共和国国家统计局. 2016年国民经济和社会发展统计公报[J/OL]. , 2017-02-28.
[
|
| [37] |
中华人民共和国国家统计局. 中国城市统计年鉴-2017[M]. 北京: 中国统计出版社, 2017.
[
|
/
| 〈 |
|
〉 |