张延伟 , 葛全胜, 姜逢清
Zhang Yanwei, Ge Quansheng, Jiang Fengqing
中图分类号: P426.6
文献标识码: A
文章编号: 1000-0690(2016)02-0296-07
通讯作者:
收稿日期: 2015-07-2
修回日期: 2015-10-21
网络出版日期: 2016-02-20
版权声明: 2016 《地理科学》编辑部 本文是开放获取期刊文献,在以下情况下可以自由使用:学术研究、学术交流、科研教学等,但不允许用于商业目的.
基金资助:
作者简介:
作者简介:张延伟(1985-),男,山东枣庄人,讲师,从事极端气候事件诊断与预测研究。E-mail:zhangyanwei208@mails.ucas.ac.cn
展开
摘要
根据1961~2010年北疆地区34个气象台站逐日平均气温、最高气温和最低气温资料,定义高温和低温的阈值、频率及其强度,并采用线性趋势、EOF等方法对其研究分析。研究表明:① 北疆地区的高温阈值研究发现空间分布变化特征基本呈现从东南向西北规律变化趋势。时间变化趋势分析发现该地区高温阈值呈现上升趋势。其中,夏季上升幅度最小,冬季上升幅度最大。频数分析发现天山山区极端高温频数变化要高于其他地区变化频数。② 北疆地区的低温阈值研究发现空间分布变化特征基本也呈现从东南向西北规律变化趋势。频数分析发现夏季频数总体呈现下降趋势。③ 通过线性趋势和EOF分析表明北疆地区高温和低温事件强度、频数呈现增加的趋势。由于北疆属于干旱与半干旱地区,生态环境较为脆弱。极端气温趋势的增加会影响到该地区的水文、工业和农业管理。
关键词:
Abstract
The high and low temperature events were analyzed based on the daily temperature observation data from 34 meteorological stations in North Xinjiang during 1961-2010 by using the methods of linear regression analysis and Empirical Orthogonal Function (EOF) analysis. The results show that: 1) The spatial distribution of the extreme highest temperature in North Xinjiang presents low value in the southeast part, and high value in the northwest part. And threshold value of the extreme highest temperature are a consistent upward trend, amount increases obviously in winter. The number of the extreme highest temperature processes increase linearly, while in Mid-Tianshan Mountains, there is an opposite trend. 2) The spatial distribution of the extreme low temperature in North Xinjiang presents low value in the east part, and high value in the west part. And threshold value of the extreme low temperature are a consistent downward trend in east and a consistent upward in west.The number of the extreme low temperature processes increase linearly, while in summer, there is a decrease trend. 3) As North of Xinjiang is an arid, semiarid-region, it means that the increase of extreme climate events should not be helpful for hydrologists, agriculturalists, emergency managers, industrialists.
Keywords:
随着气温的上升,极端气温事件也在不断增多[1-5]。在过去的50 a里气温变化的幅度几乎是过去百年变化的2倍[(0.13 ± 0.03)℃/10a vs (0.07 ± 0.02)℃ /10a)]。同时,全球很多地区冷夜日数减少(非常低的最低气温),暖夜日数(非常高的最低气温)不断增加。最近研究显示,南部非洲地区的暖夜日数不断上升,冷夜日数在下降[6]。欧洲地区大约一半的站点霜冻日数显著减少,1/3的站点夏日数显著增加,个别的站点情况相反[7]。总体上1946~1999年,冷夜、冷日数都减少,暖夜、暖日数都增多,气温日较差减少。加拿大地区在1950~2005年,冷日、冷夜数都显著减少,暖日、暖夜数显著增加,南部气温日较差减少。东南亚及南太平洋地区,也发现暖日、暖夜数增加,冷日、冷夜数减少的趋势[8-11]。近40 a来,中国气温极端冷指数整体呈下降趋势,极端暖指数整体呈上升趋势,表现为气温变暖,与全球变暖一致。北方地区极端气温指数变化最大。中国与全球气温的相关系数在0.3~0.4之间。西南地区的极端最高气温事件强度未来处于较大上升期,西部相对较小;而极端低温事件强度降幅最大的区域位于东北和西北部地区,华中及西南地区处于相对平稳期事件的强度特征[12-21]。自20世纪50年代以来,新疆的气温持续升高,并且升温和降水增加主要发生在冬季,而春季偏冷[22]。
本文研究选取以新疆天山山脊为界的天山北部区域为研究区即北疆地区(包括有寒温带和温带2个气候带,其中寒温带气候带包括阿尔泰山气候区,温带气候带包括塔城气候区和布克赛尔气候区,额尔齐斯乌伦古气候区,准噶尔盆地气候区和天山北坡气候区,如图1所示)。北疆地区是新疆社会经济比较发达,气候环境条件较好的区域。但是,北疆地区属于干旱半干旱地区,生态环境较为脆弱。如何保证该区域的能够适应气候变化的影响?需要我们加强对该区域的气候变化响应的研究。因此,本文通过采用线性趋势、EOF等方法可以揭示全球变暖对北疆地区极端气温的影响及其变化趋势,为全面认识气温变化规律提供了科学的依据。
本文采用数据由新疆信息中心提供1961~2010年北疆地区37个气象台站逐日最高气温、最低气温及平均气温资料。除去观测时间较短,缺测漏测超过30 d的数据,采用其中34个气象站点作为研究对象。定义方法极端气温阈值、频率、强度见文献[23],该方法的优点是过滤掉了阈值季节变化的波动,使之呈现出光滑而连续的变化。
通过极端高温阈值分布研究发现:自南向北,高温阈值呈现出南高北低的空间分布特征。其中,准格尔盆地为一个冷中心,且阈值向四周均匀递增。同时,在海拔较高的山区的高温阈值小于海拔较低的地区。本文选取冬季和夏季作为研究对象分析极端高温阈值的变化的趋势、频数及其强度变化的特征。
通过图2发现极端高温的变化有如下特征:夏季青河地区极端高温呈上升趋势较快(0.45℃/10a),其中,温泉地区呈现下降趋势(0.25℃/10a);总体极端高温呈现上升趋势,但是幅度较小(图2a)。冬季极端高温在北疆地区呈上升趋势,且在北疆北部地区上升趋势显著,大于0.6℃/10a(图2b)。同时,研究发现极端高温的频数变化有如下特征: 夏季频数变化趋势较小(图2c),大部分在1~2次。其中,在东南部地区频数变化趋势最小,在东部富蕴和青河地区变化幅度较其他地区要快一些。在冬季变化频数空间分布比夏季幅度高(图2d),在天山山区极端高温频数变化要高于其他地区变化频数。极端高温的强度变化趋势有如下特征:夏季极端高温总体呈现从南至北递增的趋势。夏季极端高温事件在北疆北部地区高于南部天山山区增温幅度(图2e)。北疆地区冬季这种呈现降温趋势,大部分都是-0.6~-0.3℃/10a (图2f)。
图2 1961~2010 年北疆地区高温及其频数与强度变化趋势的空间分布(注:a.夏季趋势, b.冬季趋势, c.夏季频率, d.冬季频率, e.夏季强度, f.冬季强度。)
Fig.2 Spatial distribution of extreme high temperature variation intensity in Northern Xinjiang in 1961-2010
通过EOF分解的方法,计算出极端高温的频数和强度的EOF值。研究发现,夏季(图3a),北疆大部分地区第一特征向量的各个分量都大于 0,说明北疆大部分地区夏季极端高温发生的频数变化趋势具有不一致的特征,高值中心集中在东部地区,其荷载值达0.3以上。图3b为第二特征向量的空间分布,它主要反映了北疆地区夏季极端高温频数的区域差异,北疆地区极端高温夏季频数地区无差异,其荷载值都在0以上。冬季(图3c),北疆大部分地区第一特征向量的各个分量都小于0,说明北疆大部分地区冬季极端高温发生的频数变化趋势具有基本一致的特征,高值中心集中在天山山区的乌鲁木齐、大西沟和小渠子。这些地方的频数变化也较大。其中,图3d为第二特征向量的空间分布,它主要反映了北疆地区冬季极端高温频数的区域差异,北疆地区极端高温冬季频数地区无差异,其荷载值都在0以下。
图3 1961~2010年北疆极端高温频数的EOF分析(注:a.夏季EOF 1, b.夏季EOF 2, c.冬季EOF 1, d.冬季EOF 2。)
Fig.3 Spatial distribution of EOF analysis on extreme high temperature variation frequency of Northern Xinjiang in 1961-2010
研究极端高温强度发现,夏季(图4a)可以看出,北疆地区夏季极端高温的强度变化趋势不一致的特征。图4b显示,北疆大部分地区夏季极端高温强度的变化趋势无差异。冬季(图4c)可以看出,北疆大部分地区冬季极端高温的强度变化趋势具有基本一致的特征,其载荷在0以上。图4d显示,北疆大部分地区冬季极端高温强度的变化趋势一致。这表明冬季北疆大部分地区极端高温强度变化都呈下降趋势。
图4 1961~2010年北疆极端高温强度的EOF分析(注:a.夏季EOF 1, b. 夏季EOF 2, c.冬季EOF 1, d.冬季EOF 2。)
Fig.4 Spatial distribution of EOF analysis on extreme high temperature variation intensity of Northern Xinjiang in 1961-2010
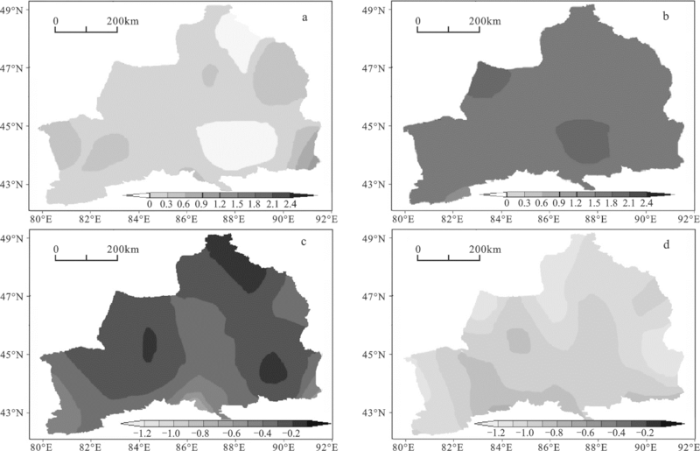
从4个季节极端低温阈值的空间分布研究发现:自南向北,低温阈值呈现出南高北低的空间分布特征。本文选取冬季和夏季作为研究对象分析极端低温阈值的变化的趋势、频数及其强度变化的特征。但是,在南部山区也出现低温较小值的区域。通过图 5分析,可以发现极端低温的变化有如下特征:夏季大部分地区总体极端高温呈现上升趋势0.2~0.4℃/10a,仍然北部地区上升趋势明显较高(图5a)。冬季低温上升趋势较高,远远大于其他3个季节的上升幅度,上升趋势在北疆北部地区大于0.8℃/10a(图5b)。极端低温的频数变化有如下特征: 在夏季和冬季变化频数空间分布较为相似(图5c和5d),频次变化幅度较大。总体分析低温的频数变化幅度高于高温的频数变化。极端低温的强度变化趋势有如下特征:夏季极端低温总体呈现从南至北递增的趋势。表明夏季极端低温事件在北疆北部地区高于南部地区增温幅度(图5e)。北疆地区冬季东北地区出现下降趋势,南方大部分地区仍然是增温趋势(图5f)。
图5 1961~2010 年北疆地区低温、及其频数与强度变化趋势的空间分布(注:a.夏季趋势, b.冬季趋势, c.夏季频率, d.冬季频率,e.夏季强度, f.冬季强度。)
Fig.5 Spatial distribution of extreme low temperature and variation of intensity in Northern Xinjiang in 1961-2010
通过EOF分解的方法,计算出极端低温的频数和强度的EOF值(图略)。研究极端低温频数发现:夏季北疆地区第一特征向量的各个分量都大于 0,说明北疆地区夏季极端低温发生的频数变化趋势具有不一致的特征,高值中心集中在南部地区。第二特征向量的空间分布,它主要反映了北疆地区夏季极端低温频数的区域差异,北疆地区极端低气温夏季频数地区无差异,其荷载值都在0以上。冬季北疆大部分地区第一特征向量的各个分量都大于 0,说明北疆大部分地区冬季极端低温发生的频数变化趋势具有不一致的特征。第二特征向量的空间分布,它主要反映了北疆地区冬季极端低温频数的区域差异,北疆地区极端低温冬季频数地区具有差异,其荷载值都在0以上。
研究极端低温强度发现,夏季北疆北部地区夏季极端低温的强度变化趋势不一致的特征;南部地区强度变化趋势一致。北疆大部分地区夏季极端低温强度的变化趋势无差异。可以看出,北疆大部分地区冬季极端低温的强度变化趋势具有基本一致的特征,其载荷在0以上。北疆大部分地区冬季极端低温强度的变化趋势具有差异,其荷载值都在0以上。
北疆作为新疆地区一个特殊单元,降水较为丰沛,经济较为发达。通过分析表明,该地区极端气温事件在全球变暖的背景下出现了明显上升趋势。北疆地区适应气候变化能较差,极端气温变化会引起生态环境相应的响应。本文基于北疆地区的极端气温阈值特征分析,得到以下结论:
1) 北疆地区极端气温阈值空间分布特征。高温阈值呈现出南高北低的空间分布特征。其中,准格尔盆地为一个冷中心,且阈值向四周均匀递增。并且,在海拔较高的山区的高温阈值小于海拔较低的地区。低温阈值也呈现出南高北低的空间分布特征。
2) 北疆地区极端气温频数变化特征。极端高温的频数特征: 夏季频数变化趋势,大部分在1~2次。冬季变化频数空间分布在天山山区极端高温频数高于其他地区。极端低温的频数特征: 冬季高于夏季频次变化幅度较大。总体分析低温的频数变化幅度高于高温的频数变化。
3) 北疆地区极端气温强度变化特征。极端高温的强度变化趋势特征:夏季极端高温总体呈现从南至北递增的趋势。冬季这种呈现降温趋势,大部分都是-0.6~-0.3℃/10a。极端低温的强度变化趋势有如下特征:夏季极端低温总体呈现从南至北递增的趋势。冬季东北地区出现下降趋势,南方大部分地区仍然是增温趋势。
The authors have declared that no competing interests exist.
| [1] |
A closer look at United States and global surface temperature change [J].https://doi.org/10.1007/s002210000563 URL [本文引用: 1] 摘要
We compare the United States and global surface air temperature changes of the past century using the current Goddard Institute for Space Studies (GISS) analysis and the U.S. Historical Climatology Network (USHCN) record [Karl et al., 1990]. Changes in the GISS analysis subsequent to the documentation by Hansen et al. [1999] are as follows: (1) incorporation of corrections for time-of-observation bias and station history adjustments in the United States based on Easterling et al. [1996a], (2) reclassification of rural, small-town, and urban stations in the United States, southern Canada, and northern Mexico based on satellite measurements of night light intensity [Imhoff et al., 1997], and (3) a more flexible urban adjustment than that employed by Hansen et al. [1999], including reliance on only unlit stations in the United States and rural stations in the rest of the world for determining long-term trends. We find evidence of local human effects ("urban warming") even in suburban and small-town surface air temperature records, but the effect is modest in magnitude and conceivably could be an artifact of inhomogeneities in the station records. We suggest further studies, including more complete satellite night light analyses, which may clarify the potential urban effect. There are inherent uncertainties in the long-term temperature change at least of the order of 0.1℃ for both the U.S. mean and the global mean. Nevertheless, it is clear that the post-1930s cooling was much larger in the United States than in the global mean. The U.S. mean temperature has now reached a level comparable to that of the 1930s, while the global temperature is now far above the levels earlier in the century. The successive periods of global warming (1900-1940), cooling (1940-1965), and warming (1965-2000) in the 20th century show distinctive patterns of temperature change suggestive of roles for both climate forcings and dynamical variability. The U.S. was warm in 2000 but cooler than the warmest years in the 1930s and 1990s. Global temperature was moderately high in 2000 despite a lingering La Ni a in the Pacific Ocean.
|
| [2] |
Uncertainty estimates in regional and global observed temperature changes: a new dataset from 1850 [J]. |
| [3] |
Large-scale changes in observed daily maximum and minimum temperatures: Creation and analysis of a new gridded data set [J].https://doi.org/10.1029/2005JD006280 URL 摘要
ABSTRACT 1] A gridded land-only data set representing near-surface observations of daily maximum and minimum temperatures (HadGHCND) has been created to allow analysis of recent changes in climate extremes and for the evaluation of climate model simulations. Using a global data set of quality-controlled station observations compiled by the U.S. National Climatic Data Center (NCDC), daily anomalies were created relative to the 1961–1990 reference period for each contributing station. An angular distance weighting technique was used to interpolate these observed anomalies onto a 2.5° latitude by 3.75° longitude grid over the period from January 1946 to December 2000. We have used the data set to examine regional trends in time-varying percentiles. Data over consecutive 5 year periods were used to calculate percentiles which allow us to see how the distributions of daily maximum and minimum temperature have changed over time. Changes during the winter and spring periods are larger than in the other seasons, particularly with respect to increasing temperatures at the lower end of the maximum and minimum temperature distributions. Regional differences suggest that it is not possible to infer distributional changes from changes in the mean alone. Citation: Caesar, J., L. Alexander, and R. Vose (2006), Large-scale changes in observed daily maximum and minimum temperatures: Creation and analysis of a new gridded data set, J. Geophys. Res., 111, D05101, doi:10.1029/2005JD006280.
|
| [4] |
Monthly surface air temperature time series area-averaged over the 30-degree latitudinal belts of the globe,1881-2004 [M] .
|
| [5] |
A global merged land-air-sea surface temperature Reconstruction based on historical observations (1880-1997) [J]. |
| [6] |
Temperature trends in South Africa: 1960-2003 [J]. |
| [7] |
S. LeDuc. Recent frost date trends in the northeastern United States [J]. |
| [8] |
Possible impacts of climate change on extreme weather events at local scale in South-central Canada [J]. |
| [9] |
Climatic variability and change over southern Africa: a reflection on underlying processes [J].https://doi.org/10.1177/030913339702100103 URL 摘要
Abstract Fifty-eight cell lines in the National Cancer Institute drug screen were analyzed for their ability to efflux the fluorescent dye rhodamine 123 as a functional assay for P-glycoprotein (Pgp). Using flow cytometry, the rhodamine fluorescence was measured for each cell line under four incubation conditions, i.e., after accumulation in the presence or absence of the Pgp antagonist cyclosporin A and after efflux in rhodamine-free medium in the presence or absence of cyclosporin A. The results in some cell lines were compatible with Pgp-mediated efflux. There was a significant correlation between mdr-1 expression and rhodamine efflux in the 58 cell lines (r = 0.788, p = 0.0001). Using the rhodamine efflux data as a seed for COMPARE analysis with the cytotoxicity data on > 30,000 compounds in the National Cancer Institute drug screen database, hundreds of compounds with high correlation coefficients were identified. Selected compounds were tested for reversal of cross-resistance in a multidrug-resistant cell line. A high degree of reversibility, up to 10,000-fold, for some of the compounds was noted in the presence of the Pgp antagonist PSC 833. This finding suggested that compounds with predominately Pgp-mediated resistance were being identified. Using these compounds as seeds for COMPARE analysis against a more restricted database of 187 standard agents, a series of standard compounds were repeatedly identified as having high correlation coefficients with the newly identified Pgp substrates. These standard agents, including phyllanthoside, bisantrene, and homoharringtonine, constitute an mdr-1 profile. New agents identified as being highly correlated with these compounds may benefit from clinical trials with Pgp antagonists.
|
| [10] |
Trends in extreme weather and climate events: Issues related to modeling extremes in projections of future climate change [J]. |
| [11] |
Evolution of extreme temperatures over Portugal: recent changes and future scenarios [J].https://doi.org/10.3354/cr00934 URL [本文引用: 1] 摘要
ABSTRACT Evolution of extreme temperatures over Portugal: recent changes and future scenarios Alexandre M. Ramos1,2,*, Ricardo M. Trigo2,3, Fátima E. Santo4 1Environmental Physics Laboratory, Universidad de Vigo, Facultad de Ciencias de Ourense, Campus As Lagoas, 32004 Ourense, Spain 2CGUL, IDL, Faculdade de Ciências, Universidade de Lisboa, 1700 Lisboa, Portugal 3Departamento de Engenharias, Universidade Lusófona, 1749 Lisboa, Portugal 4Instituto de Meteorologia, 1749 Lisboa, Portugal ABSTRACT: Changes in surface air temperature extremes over mainland Portugal since the early 1940s were investigated on the basis of daily maximum and minimum temperatures available from time series from 23 weather stations. The maximum (minimum) temperature decreased by 0.17°C decade–1 (0.19°C decade–1) for 1941–1975 followed by an increase of 0.49°C decade–1 (0.54°C decade–1) for 1976–2006, significantly higher than similar trends computed at the global and European scales. A large set of climatic indices was analysed to detect the presence of trends and quantify the variations of different indices for different periods. In the 1976–2006 period, many stations revealed statistically significant positive trends in the annual number of tropical nights, summer days, warm spells, warm nights and warm days. At the seasonal level, we detected statistically significant increments of extreme heat events for spring and summer, and a decrease of cold extremes in winter. We then used the HadRM3 output to study changes in the maximum and minimum temperature distributions and associated changes in the likelihood of extreme events in the future (2071–2100) under 2 change scenarios. Changes obtained for the future are consistent with those found since the mid-1970s in Portugal with an increase in maximum temperature of 3.2°C (4.7°C) for the B2 (A2) scenario in summer and ~3.4°C in both scenarios for spring. For minimum temperature, the results were similar, with increases for summer (spring) ranging from 2.7°C (2.5°C) in the B2 scenario to 4.1°C (2.9°C) in the A2 scenario. KEY WORDS: Extremes · Temperature · Portugal · Climate change · Regional Climate Model · RCM
|
| [12] |
中国近四十年最高最低温度变化 [J].https://doi.org/10.11676/qxxb1997.042 URL [本文引用: 1] 摘要
利用中国1951-1990年 的实测资料,在剔除测站迁移和城市化热岛效应对气候变化趋势的可能影响之后,研究了中国最高温度、最低温度的时空变化趋势特点。结果表明,最高温度在 95°E以西及黄河以北地区普遍呈增温趋势,而在东部黄河以南却呈降温趋势;最低温度在全国普遍呈增温趋势,在高纬度地区增暖最明显。这种变化使得日较差 表现出明显的减少趋势。虽然最高、最低温度变化的准周期性规律是一致的,但它们的线性变化趋势却呈现出明显的不对称性。最低温度的显著升高反映了近40a 中温室效应持续加强的迹象。进一步的分析表明,最高最低温度变化是与日照条件及大气水分条件相关联的
On change of China's maximum and minmum temperatures in the recent 40 years .https://doi.org/10.11676/qxxb1997.042 URL [本文引用: 1] 摘要
利用中国1951-1990年 的实测资料,在剔除测站迁移和城市化热岛效应对气候变化趋势的可能影响之后,研究了中国最高温度、最低温度的时空变化趋势特点。结果表明,最高温度在 95°E以西及黄河以北地区普遍呈增温趋势,而在东部黄河以南却呈降温趋势;最低温度在全国普遍呈增温趋势,在高纬度地区增暖最明显。这种变化使得日较差 表现出明显的减少趋势。虽然最高、最低温度变化的准周期性规律是一致的,但它们的线性变化趋势却呈现出明显的不对称性。最低温度的显著升高反映了近40a 中温室效应持续加强的迹象。进一步的分析表明,最高最低温度变化是与日照条件及大气水分条件相关联的
|
| [13] |
近几十年中国极端气候变化格局 [J].https://doi.org/10.3969/j.issn.1006-9585.2000.03.005 URL 摘要
以1951~1997年间61站的逐日气象观测为基础,揭示了中 国区域气候要素极值的变化格局.北方极端最低温普遍上升5~l0℃,是冬季寒潮减弱的数值化标志;极端最高温在很多地区都有所降低,但在高原却普遍上升, 原因待考;引人注目的北方干旱化问题主要反映在微量降水事件的显著减少,而在降水量上并无显著反映;极端风速普遍减弱1~3m/s,反映了剧烈天气活动 (如寒潮、台风)强度的减弱.在很多情形下,极端气候变化可达平均气候变化的5~10倍,而另一些情形下,极端气候完全逆平均气候而变化,说明了极端气候 独特的研究价值.
Geographic patterns of extreme climate change in China during 1951-1997 .https://doi.org/10.3969/j.issn.1006-9585.2000.03.005 URL 摘要
以1951~1997年间61站的逐日气象观测为基础,揭示了中 国区域气候要素极值的变化格局.北方极端最低温普遍上升5~l0℃,是冬季寒潮减弱的数值化标志;极端最高温在很多地区都有所降低,但在高原却普遍上升, 原因待考;引人注目的北方干旱化问题主要反映在微量降水事件的显著减少,而在降水量上并无显著反映;极端风速普遍减弱1~3m/s,反映了剧烈天气活动 (如寒潮、台风)强度的减弱.在很多情形下,极端气候变化可达平均气候变化的5~10倍,而另一些情形下,极端气候完全逆平均气候而变化,说明了极端气候 独特的研究价值.
|
| [14] |
1955—2005年中国极端气温的变化 [J].Change of extreme temperatures in China duri . |
| [15] |
Changes in annual maximum number of consecutive dry and wet days during 1961-2008 in Xinjiang, China [J]. |
| [16] |
中国近40年极端气温和降水的分布特征及年代际差异 [J].https://doi.org/10.3969/j.issn.1004-4965.2006.06.015 URL 摘要
利用全国119(154)站1961-2000年逐日平均气温 (降水)资料,采用世界气象组织(WMO)最近公布的极端气候指数,分析了中国近40 a来极端气温和降水的分布及变化特征.结果表明:40 a气温极端冷指数整体呈下降趋势,极端暖指数整体呈上升趋势,表现为气温变暖,与全球变暖一致,北方地区极端气温指数变化最大;比较了1961-1975 年和1976-2000年2个子时段各极端气温指数的变化趋势,第一时段表现为气温变冷趋势,第二时段为气温变暖趋势.全国年降水量、中等雨日指数 (R75%)、强降水日指数(R95%)和强降水比率指数(R95%tot)的整体线性变化为上升趋势,前2个指数地理差异明显,后2个指数地理差异不明 显.在上述2个时段中,第二时段较第一时段的年雨日数减少,但强降水日数和平均降水强度增大,且极端降水正线性变化趋势范围比第一时段也增大.
Distributings characteristics and interdecadal difference of daily temperature and precipitation extremes in China for latest 40 years .https://doi.org/10.3969/j.issn.1004-4965.2006.06.015 URL 摘要
利用全国119(154)站1961-2000年逐日平均气温 (降水)资料,采用世界气象组织(WMO)最近公布的极端气候指数,分析了中国近40 a来极端气温和降水的分布及变化特征.结果表明:40 a气温极端冷指数整体呈下降趋势,极端暖指数整体呈上升趋势,表现为气温变暖,与全球变暖一致,北方地区极端气温指数变化最大;比较了1961-1975 年和1976-2000年2个子时段各极端气温指数的变化趋势,第一时段表现为气温变冷趋势,第二时段为气温变暖趋势.全国年降水量、中等雨日指数 (R75%)、强降水日指数(R95%)和强降水比率指数(R95%tot)的整体线性变化为上升趋势,前2个指数地理差异明显,后2个指数地理差异不明 显.在上述2个时段中,第二时段较第一时段的年雨日数减少,但强降水日数和平均降水强度增大,且极端降水正线性变化趋势范围比第一时段也增大.
|
| [17] |
中国极端气候变化观测研究回顾与展望 [J].https://doi.org/10.3878/j.issn.1006-9585.2010.04.01 URL 摘要
评述、总结了近年有关中国极端气候变化的观测研究成果,讨论了尚未解决的科学问题和今后应重点加强的工作方向。已有研究表明,1951年以来中国大陆地区极端气候事件频率和强度发生了一定变化,但不同类型和不同区域极端气候变化存在明显差异。从全国范围看,与异常偏冷相关的极端事件如寒潮、冷夜和冷昼天数、霜冻日数等,显著减少减弱,偏冷的气候极值减轻;与异常偏暖相关的暖夜、暖昼日数明显增多,暖夜日数增多尤其明显,但高温事件频数和偏热的气候极值未见显著长期趋势;全国平均暴雨和极端强降水事件频率和强度有所增长,特别是长江中下游和东南地区、西部特别是西北地区有较明显增长,而华北、东北中南部和西南部分地区减少减弱;多数地区小雨频数明显下降,偏轻和偏强降水的强度似有增加;全国遭受气象干旱的范围呈较明显增加趋势,其中华北和东北地区增加更为显著;登陆和影响我国的热带气旋、台风频数有所下降,其造成的降水总量有较明显减少;北方地区的沙尘暴事件从总体上看有显著减少减弱趋势;我国东部部分地区夏季雷暴发生频率也存在较明显下降趋势。现有工作表明,在涉及极端气候变化研究的资料处理和分析方法方面还有改进余地。观测资料的非均一性,以及观测环境改变和城市化对地面气候要素变化趋势的影响偏差,需要进行深入评价和客观订正。此外,目前对于区域极端气候变化的综合分析还较薄弱,在极端气候变化机理的研究方面有待加强。
Progresses in observation studies of climate extremes and changes in mainland China .https://doi.org/10.3878/j.issn.1006-9585.2010.04.01 URL 摘要
评述、总结了近年有关中国极端气候变化的观测研究成果,讨论了尚未解决的科学问题和今后应重点加强的工作方向。已有研究表明,1951年以来中国大陆地区极端气候事件频率和强度发生了一定变化,但不同类型和不同区域极端气候变化存在明显差异。从全国范围看,与异常偏冷相关的极端事件如寒潮、冷夜和冷昼天数、霜冻日数等,显著减少减弱,偏冷的气候极值减轻;与异常偏暖相关的暖夜、暖昼日数明显增多,暖夜日数增多尤其明显,但高温事件频数和偏热的气候极值未见显著长期趋势;全国平均暴雨和极端强降水事件频率和强度有所增长,特别是长江中下游和东南地区、西部特别是西北地区有较明显增长,而华北、东北中南部和西南部分地区减少减弱;多数地区小雨频数明显下降,偏轻和偏强降水的强度似有增加;全国遭受气象干旱的范围呈较明显增加趋势,其中华北和东北地区增加更为显著;登陆和影响我国的热带气旋、台风频数有所下降,其造成的降水总量有较明显减少;北方地区的沙尘暴事件从总体上看有显著减少减弱趋势;我国东部部分地区夏季雷暴发生频率也存在较明显下降趋势。现有工作表明,在涉及极端气候变化研究的资料处理和分析方法方面还有改进余地。观测资料的非均一性,以及观测环境改变和城市化对地面气候要素变化趋势的影响偏差,需要进行深入评价和客观订正。此外,目前对于区域极端气候变化的综合分析还较薄弱,在极端气候变化机理的研究方面有待加强。
|
| [18] |
近40年中国平均气候与极值气候变化的概述 [J].Magsci 摘要
<p>随着中国气象局对近50年来逐日气象观测资料的释放,人们从不同的角度对中国平均气候和极端气候的分布特征有了更多的了解。从目前研究的结果来看,这些认识需要有一个集成,即需要有一个总体的归纳和解释。通过中国近40年来的温度极值和降水极值事件的分析认识到全球增暖和区域环流异常决定着气候极值事件的分布格局。与全球增暖相联系的是:我国微量降水在空间上表现为一致的减少趋势,我国北方寒潮事件显著减少,冷夜和冷日的减少与暖夜和暖日的增多并存,以及极端强降水有增多的趋势。与东亚季风气流和西风带气流异常对应的我国有效降水在区域分布上发生了显著变化,东部季风区中的“北涝南旱”从1970年代末转型为“南涝北旱”,与华南的偏干一起形成了东部季风区降水从华南、长江到华北的“-、+、-”异常分布型,但华南在1991年出现了转湿的突变;东北和西北先后从1983年和1987年前后转为暖湿气候。极端温度和极端降水趋势的空间分布与平均温度和平均降水趋势的空间分布一致。</p>
Changes in mean climate and extreme climate in China during the last 40 year .Magsci 摘要
<p>随着中国气象局对近50年来逐日气象观测资料的释放,人们从不同的角度对中国平均气候和极端气候的分布特征有了更多的了解。从目前研究的结果来看,这些认识需要有一个集成,即需要有一个总体的归纳和解释。通过中国近40年来的温度极值和降水极值事件的分析认识到全球增暖和区域环流异常决定着气候极值事件的分布格局。与全球增暖相联系的是:我国微量降水在空间上表现为一致的减少趋势,我国北方寒潮事件显著减少,冷夜和冷日的减少与暖夜和暖日的增多并存,以及极端强降水有增多的趋势。与东亚季风气流和西风带气流异常对应的我国有效降水在区域分布上发生了显著变化,东部季风区中的“北涝南旱”从1970年代末转型为“南涝北旱”,与华南的偏干一起形成了东部季风区降水从华南、长江到华北的“-、+、-”异常分布型,但华南在1991年出现了转湿的突变;东北和西北先后从1983年和1987年前后转为暖湿气候。极端温度和极端降水趋势的空间分布与平均温度和平均降水趋势的空间分布一致。</p>
|
| [19] |
中国地区极端气温变化的模拟评估及其未来情景预估 [D].
Projection and evaluation of the extreme temperature events simulation over China .
|
| [20] |
近百年气候变化与变率的诊断研究 [J].https://doi.org/10.11676/qxxb1994.035 Magsci 摘要
总结了近百年来气候变化与变率的诊断研究结果,包括全球平均气温及降水量、中国平均气温及降水量,以及ENSO及QBO.指出全球有变暖趋势,1980年代是最暖的10年。但中国的情况有所不同,1920年代及1940年代最暖,而1980年代接近常年。全球降水量有增加趋势,但气温与降水的10年尺度变化并不完全一致。1950年代及1970年代为多雨期,1980年代降水反而减少。中国夏季降水变化的主要特征是冷湿、暖干。1920年代及1940年代是近百年最干的时期。1871-1993年共发生厄尼诺事件28次,拉尼娜21次。气候变暖时厄尼诺强,气候较冷时拉尼娜频率高。1951-1993年赤道平流层纬向风准两年振荡的平均长度为28.7个月,比1950年代末的估计(26.3个月)要长。1951年以前的周期长度可能在29个月左右。未发现QBO与气候变化有明显关系。
Diagnostic studies on the climate change and variability for the period of 1880-1990 [J].https://doi.org/10.11676/qxxb1994.035 Magsci 摘要
总结了近百年来气候变化与变率的诊断研究结果,包括全球平均气温及降水量、中国平均气温及降水量,以及ENSO及QBO.指出全球有变暖趋势,1980年代是最暖的10年。但中国的情况有所不同,1920年代及1940年代最暖,而1980年代接近常年。全球降水量有增加趋势,但气温与降水的10年尺度变化并不完全一致。1950年代及1970年代为多雨期,1980年代降水反而减少。中国夏季降水变化的主要特征是冷湿、暖干。1920年代及1940年代是近百年最干的时期。1871-1993年共发生厄尼诺事件28次,拉尼娜21次。气候变暖时厄尼诺强,气候较冷时拉尼娜频率高。1951-1993年赤道平流层纬向风准两年振荡的平均长度为28.7个月,比1950年代末的估计(26.3个月)要长。1951年以前的周期长度可能在29个月左右。未发现QBO与气候变化有明显关系。
|
| [21] |
温度破纪录事件预测理论研究 [J].https://doi.org/10.11676/qxxb2009.007 Magsci [本文引用: 1] 摘要
分析中国740个常规观测站1960—2005年日最高、最低温度器测资料,揭示了46年来中国日最高、最低温度破纪录事件的强度特征。利用历史观测资料验证了日温度极值服从高斯分布,并将历史资料中已知的高、低温破纪录事件作为初始条件,经冗长的理论推导得到破纪录温度的期望值,与用纯极值理论进行迭代获得的结果相比,前者更符合观测事实,预测效果更好。在此基础上对中国未来可能发生的高、低温破纪录事件进行了预测评估,给出了各地区高、低温破纪录事件强度理论上所能达到的最大、最小值分布。结果表明中国各地区极端温度变化幅度差异明显,具有明显的区域特征,西南地区的极端高温事件强度未来处于较大上升期,西部相对较小;而极端低温事件强度降幅最大的区域位于东北和西北部地区,华中及西南地区处于相对平稳期。
On the prediction of record-breaking daily temperature events .https://doi.org/10.11676/qxxb2009.007 Magsci [本文引用: 1] 摘要
分析中国740个常规观测站1960—2005年日最高、最低温度器测资料,揭示了46年来中国日最高、最低温度破纪录事件的强度特征。利用历史观测资料验证了日温度极值服从高斯分布,并将历史资料中已知的高、低温破纪录事件作为初始条件,经冗长的理论推导得到破纪录温度的期望值,与用纯极值理论进行迭代获得的结果相比,前者更符合观测事实,预测效果更好。在此基础上对中国未来可能发生的高、低温破纪录事件进行了预测评估,给出了各地区高、低温破纪录事件强度理论上所能达到的最大、最小值分布。结果表明中国各地区极端温度变化幅度差异明显,具有明显的区域特征,西南地区的极端高温事件强度未来处于较大上升期,西部相对较小;而极端低温事件强度降幅最大的区域位于东北和西北部地区,华中及西南地区处于相对平稳期。
|
| [22] |
天山西部中山带积雪变化趋势与气温和降水的关系 [J].
根据位于巩乃斯河谷的天山积雪雪崩研究站近30年来的年最大雪深、月平均气温、月降水量观测记录,用平均差值法、最小二乘法、自回归滑动平均法检验了天山西部中山带积雪、冷季降水、冷季平均气温的变化趋势,结果表明,天山西部中山带积雪呈增加趋势,近30年来年平均增加1.43%,与青藏高原、南极大陆及格陵兰冰盖表面积雪积累增加相一致.天山西部中山带冷季气温和降水的变化趋势也是增加的,其中冷季降水平年平均增加0.12%,而冷季气温升高了0.8℃,积雪与冷季气温之间存在着弱的负相关关系,而与冷季降水呈显著的正相关关系.积雪的增加主要是因为气候变暖引起的冷季降水的增加对积雪增加的贡献大于由于冷季气温升高而造成积雪减少的贡献的结果.
Variation trends of snowcover in the middle mountains of western tianshan Mts.and their relations to temperature and precipitation .
根据位于巩乃斯河谷的天山积雪雪崩研究站近30年来的年最大雪深、月平均气温、月降水量观测记录,用平均差值法、最小二乘法、自回归滑动平均法检验了天山西部中山带积雪、冷季降水、冷季平均气温的变化趋势,结果表明,天山西部中山带积雪呈增加趋势,近30年来年平均增加1.43%,与青藏高原、南极大陆及格陵兰冰盖表面积雪积累增加相一致.天山西部中山带冷季气温和降水的变化趋势也是增加的,其中冷季降水平年平均增加0.12%,而冷季气温升高了0.8℃,积雪与冷季气温之间存在着弱的负相关关系,而与冷季降水呈显著的正相关关系.积雪的增加主要是因为气候变暖引起的冷季降水的增加对积雪增加的贡献大于由于冷季气温升高而造成积雪减少的贡献的结果.
|
| [23] |
Trends of extreme temperatures in Europe and China based on daily observations [J].https://doi.org/10.1007/978-94-010-0371-1_13 URL 摘要
Ten of the longest daily temperature series presently available in Europe and China are analysed, focusing on changes in extremes since pre-industrial times. We consider extremes in both a relative (with respect to the time of year) and an absolute sense. To distinguish changes in extremes from changes affecting the main part of the temperature distribution, a percentile smaller than 10 (and/or larger than 90) is recommended for defining an extreme. Three periods of changes in temperature extremes are identified: decreasing warm extremes before the late 19th century; decreasing cold extremes since then and increasing warm extremes since the 1960s. The early decreases and recent increases of warm extremes dominate in summer, while the decrease of cold extremes for winter persists throughout the whole period. There were more frequent combined (warm plus cold) extremes during the 18th century and the recent warming period since 1961 at most of the ten stations, especially for summer. Since 1961, the annual frequency of cold extremes has decreased by about 7% per century with warm extremes increasing by more than 10% per century but with large spatial variability. Compared with recent annual mean warming of about 2-3 ° C/century, the coldest winter temperatures have increased at three times this rate, causing a reduced within-season range and therefore less variable winters. Changes in the warmest summer temperatures since 1961 exhibit large spatial variability, with rates of change ranging from slightly negative to 6 - C/century. More extensive station observations since 1961 indicate that the single site results are representative of larger regions, implying also that the extremes studied are the result of large-scale changes. Recent circulation changes in daily gridded pressure data, used as an indicator of wind speed changes, support the results by explaining some of the trends.
|

/
| 〈 |
|
〉 |


