刘承良 , 管明明
, 管明明
Liu Chengliang, Guan Mingming
中图分类号: F129.9
文献标识码: A
文章编号: 1000-0690(2017)12-1805-10
收稿日期: 2016-12-16
修回日期: 2017-03-20
网络出版日期: 2017-12-20
版权声明: 2017 《地理科学》编辑部 本文是开放获取期刊文献,在以下情况下可以自由使用:学术研究、学术交流、科研教学等,但不允许用于商业目的.
基金资助:
作者简介:
作者简介:刘承良(1979-),男,副教授,博士,硕士生导师,主要从事经济地理复杂性研究。E-mail:clliu@re.ecnu.edu.cn
展开
摘要
以交通运输、仓储和邮政业表征物流业,引入SBM-Undesirable模型,考虑低碳约束下的物流效率,对中国(除港澳台和西藏)的30个省(市、自治区)2003~2014年物流业效率进行测度,基于格局-过程-机理框架系统揭示了低碳约束下物流业效率的空间演化特征及其影响因素:① 低碳约束下物流业效率总体偏低,空间分异呈现出东部>中部>西部的地带性分异态势。② 空间分布具有一定地方依赖性,效率高值区集中于东部沿海,呈现由“大集中、小分散”向“条带状集聚”变化的特征,而低值区高度锁定于西北和西南半壁。③ 空间集聚性较弱,不断趋于收敛,高效率集聚区表现出“北扩西移”的演化趋势。④ 物流业高效率区与高产值区呈现显著的空间同配性。⑤ 物流业效率的空间演化受多种因素综合作用,经济发展、市场环境、产业集聚、信息化水平、政府调控对物流业效率具有显著的正向影响,能源强度则具有负向影响,而对外开放程度、环境规制对物流业效率的提升作用不明显,研究结果可为区域物流协调发展、提高物流业效率提供参考。
关键词:
Abstract
This paper selects transportation, storage and postal industries to represent logistics, taking the carbon dioxide emissions as unexpected outputs, introducing the SBM-Undesirable model to measure the logistics industry efficiency of 30 provinces which are restricted by the low carbon (province-level municipality or autonomous regions) in mainland China in 2003-2014. Based on the pattern- process- mechanism framework system, this paper reveals the spatial evolution characteristics of logistics efficiency and its influencing factors: ① Under low carbon constraints, Chinese logistics industry efficiency in general is low, and the spatial distribution varies from zone to zone, characterized as the trend of the East > Central > West. ② Spatial distribution has some path dependency as those with high efficiency concentrate in the eastern coastal areas, which is represented by the evolution from "large agglomeration, small dispersion" to "banded cluster ", While the low efficiency areas focus on the northwest and southwest. ③ The space agglomeration of efficiency is comparatively low, tending to be equilibrium, while the high-efficiency zones are likely to move west and north. ④ There presents a significant spatial matching between the high-efficiency logistics industry and high-output industry. ⑤ The spatial evolution of logistics efficiency is affected by various factors, among which, the economic development, market environment, industrial agglomeration, informationization level and governmental regulation have a significant positive impact on logistics efficiency, while energy intensity has negative influence. By contrast, the level of opening-up and environmental regulation show no obvious effect on increasing the efficiency of logistics industry. All of these can provide reference for regional logistics coordinated development and improve logistics efficiency.
Keywords:
物流业是融合运输、仓储、搬运装卸、包装加工、配送、信息处理等产业的综合性生产服务业,被誉为经济发展的“加速器”和“第三利润源泉” [1]。近年来,中国物流业发展迅速,但其发展仍属于要素投入型,存在着高投入、高能耗、高排放、低效率的问题[2]。随着中国面临的资源环境约束日益严重,传统粗放的物流发展方式难以为继。考虑低碳约束下的物流效率评价,推动物流业由要素投入驱动型转向效率导向型发展既是时代赋予物流发展的新要求,也是实现物流可持续发展的必由之路。
在国内外研究中,物流业效率的研究集中于物流产业效率评价指标体系的选取、模型构建、影响因素分析、物流效率提升等方面。指标体系上,基本遵循经济学投入-产出分析框架,以资本、劳动力等作为投入要素,以物流业的产值为产出。在评价方法上,主要包括随机前沿法[3]和数据包络分析[4],其中有超效率DEA模型[5]、三阶段DEA模型[6]、DEA–Malmquist函数[7]、基于松弛测度的SBM模型[8]等。影响因素上,产业经济学认为需求增长、所有制结构、信息技术等[9,10]对物流效率至关重要,企业经济学则关注经营战略、管理制度对物流业的影响[11]。实证研究中,聚焦于区域物流业效率和企业物流效率视角。区域层面,以省际[12]、城市群[13,14]和城市[15]为主,展开了对区域物流效率的评价。企业层面,认为合理的企业空间布局[16]、组织经营[17]有利于提升物流业效率。
随着全球气候变暖愈演愈烈,低碳发展成为当今时代主题。在此背景下,低碳物流受到广泛关注,相关研究主要集中在低碳物流概念[18,19]、物流低碳发展路径[20,21]、物流碳排放测度[22,23],物流业能源效率[24]。虽然国内外学术界尚未形成统一关于低碳物流的定义,但是低碳物流的核心仍然是“高效”和“低碳”,不仅强调物流业带来的经济效益,更加注重发展中的能耗和碳排放。因此,本文在考虑传统的产出基础上,将物流业发展中的CO2排放纳为SBM-Undesirable模型中的非期望产出以此界定低碳约束下的物流效率。低碳约束因素可以更客观、全面地反映区域物流业的效率,对于政府实行物流产业的节能减排与环境规制以及提高物流效率具有理论和现实意义。
综上,现有研究仍有些许不足:首先,指标体系上,仅仅关注经济产出,忽视了其环境效应,难以科学全面的评价物流业效率。其次,物流的运行在空间上具有流动性,区域之间的关联性较强,亟需从地理学格局-过程-机理视角来揭示物流业效率的空间格局(空间的异质性、集聚性和配置性)和动态演化。最后,探究低碳约束下物流业效率的影响因素,仅仅依靠要素投入产出的分析难以全面厘清物流效率发展的影响机理,致使相关的对策缺乏针对性,需要从综合的视角审视。鉴于此,本文引入非期望产出的SBM-Undesirable模型,考虑物流业发展中的环境效应,进一步揭示低碳约束下物流业效率的空间演化规律及其影响因素,并通过空间匹配性来识别区域物流业发展类型。以期为优化中国物流空间布局、推进区域物流协调发展、提高物流业效率提供决策参考。
基于投入-产出视角,物流业效率定义为在物流生产活动中经济要素的投入与实际产出之间的比率。作为一个新兴产业,中国缺乏专门的物流统计,因此本研究参照大多数学者以交通运输、仓储和邮政业来界定物流业,并选择统计资料中出现专门的“交通运输、仓储和邮政业”统计的2003年作为起始年份。基于数据的科学性、统一性和可获取性,构建低碳约束物流业投入–产出评价指标体系。
投入指标:资本投入使用交通运输、仓储和邮政业固定资产投资表示,并结合张军等[25]的计算方法估算资本存量。劳动力投入运用交通运输、仓储和邮政业从业人员反映。基础设施的投入,选取铁路营业里程、公路里程、内河通航里程表示。能源的投入则选取原煤、原油、汽油、煤油、柴油、燃料油、液化石油、天然气这8种物流业中主要消耗的燃料,并参照《中国能源统计年鉴》[26]中能源参考热值及折标准煤系数的标准将各种燃料折算成标准煤(表1)。
期望产出指标:主要是物流发展中的经济产出、社会服务产出,分别使用交通运输、仓储和邮政业产值、社会货物周转量来表示。
非期望产出指标:主要是考量物流发展中的二氧化碳排放,其中,二氧化碳排放的测算参考IPCC(2006)[27]关于CO2的估算:
式中,代表燃料种类,
表1 主要燃料折煤系数、发热量、碳含量及CO2排放系数
Table 1 Main fuel coal folding coefficient, calorific value, carbon content and CO2 emission coefficient
| 原煤 | 原油 | 汽油 | 煤油 | 柴油 | 燃料油 | 液化石油 | 天然气 | |
|---|---|---|---|---|---|---|---|---|
| 折算系数(kg标准煤/kg) | 0.7143 | 1.4286 | 1.4714 | 1.4714 | 1.4571 | 1.4286 | 1.7143 | 1.215 |
| 平均低位发热量(CF)(kJ/kg) | 20908 | 41816 | 43070 | 43070 | 42652 | 41816 | 50719 | 35585 |
| 碳含量(CC)(kg/GJ) | 26.8 | 20 | 18.9 | 19.5 | 20.2 | 21.1 | 17.2 | 15.3 |
| 氧化碳因子(COF) | 1 | 1 | 1 | 1 | 1 | 1 | 1 | 1 |
| 有效CO2碳排放因子(kg/TJ) | 98300 | 73300 | 69300 | 71 500 | 74100 | 77400 | 63100 | 56100 |
| CO2排放系数(kg/kg) | 2.0553 | 3.0651 | 2.9848 | 3.0795 | 3.1605 | 3.2366 | 3.1663 | 1.9963 |
注:依据《2006年IPCC国家温室气体清单指南》[27]第2卷“能源”部分、《中国能源统计年鉴》[26]中“附录4:各种能源折标准煤参考系数”,由于附录中天然气的平均低位发热量3228~38931 kJ/m3,本文采用中间值。
其中,港澳台和西藏的数据缺失,所以不考虑在评价区域内,部分缺失的数据使用插值法补充,数据主要来源于《中国统计年鉴》[28]、《中国能源统计年鉴》[26]。
针对数据包络分析(Data Envelopment Analysis)存在的投入要素“拥挤”或“松驰”问题,并考虑环境效应产出,这里引入SBM-Undesirable模型[29]:
式中,
为了反映物流业效率值在整体上的空间相关性及局部的集聚性,识别其中簇集的热点和冷点区,全局Moran’s I系数和局部Getis-Ord G*指数被引入,其公式如下[30]:
全局Moran’s I系数:
局部Getis-Ord G*指数:
式中表示研究区域单元的个数。
SBM-Undesirable模型主要测度内部投入–产出要素对物流业效率的影响,未考虑区际空间关联及外部效应影响。“地理学第一定律”认为任何事物都存在空间相关,距离越近的事物空间相关性越大[31],这种空间相关性的存在打破了大多数经典计量分析中的一些基本假设。因此本文使用空间计量分析,从经济地理学区位理论出发,综合已有研究成果,从区域经济环境、物流产业环境、物流政策环境、环境规制4个层面探究物流业效率空间格局演变的综合驱动因素(公式5)。各变量的含义及测算见表2,部分缺失的数据使用插值法补充,数据来源于《中国统计年鉴》[28]、《中国环境统计年鉴》[32]。
回归方程:
式中,表示物流效率,为常数项,代表空间自回归系数,
表2 主要变量及其测度
Table 2 Main variables and their measures
| 层面 | 变量 | 测算方法 |
|---|---|---|
| 区域经济环境 | 经济发展水平 | 使用各省的人均GDP表示。 |
| 对外开放程度 | 使用各省的实际利用外商投资额表示。 | |
| 市场环境 | 使用樊纲等人的中国区域市场化指数表示。 | |
| 物流产业环境 | 物流产业集聚 | 使用空间基尼系数反映产业集聚程度①。 |
| 信息化水平 | 采用互联网和电话普及率,分别用0.22和0.17的权重,计算综合指数。 | |
| 物流能源强度 | 使用各省物流能源消耗占物流产值的比重。 | |
| 物流政策环境 | 政府物流调控 | 使用各省财政支出中交通运输支出占总支出的比重。 |
| 环境规制 | 总体环境规制力度 | 使用各省环境治理投资占GDP的比重表示。 |
| 大气环境规制力度 | 采用大气污染治理费用占总污染治理投资比重表示。 |
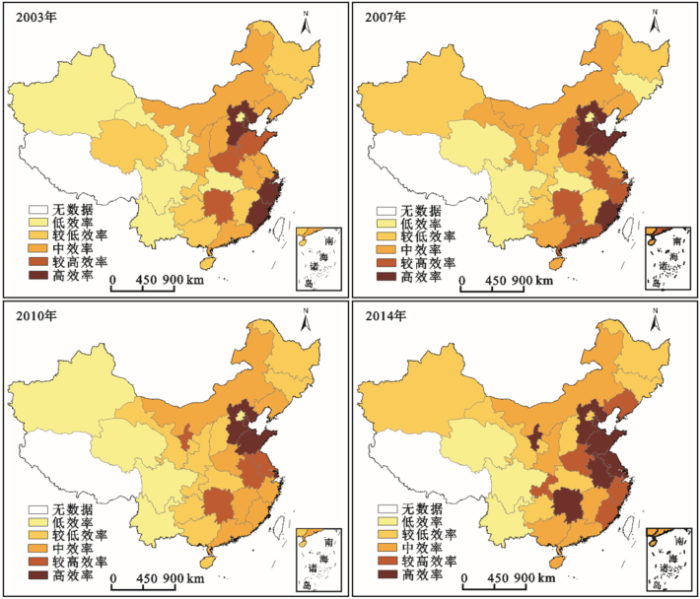
选择2003年、2007年、2010年、2014年4个年份作为研究截面,结合公式(2)利用MAXDEA软件测算得到物流业效率,并利用ArcGIS10.2软件的自然断裂法将效率值划分5个等级:高效率水平(0.583~1)、较高效率水平(0.381~0.583)、中效率水平(0.235~0.381)、较低效率水平(0.172~0.235)、低效率水平(0.121~0.172),借助ArcGIS10.2生成物流业效率的空间分布图(图1)。分析图1发现:
1) 物流业效率全局上呈现“东高西低”的带状梯度递减格局。研究年限内全国的平均效率为0.477,其中东、中、西的均值分别为0.703、0.368、0.338。总体布局上,物流业效率呈地带性分异,呈东部>中部>西部的梯度递减态势。其中,高效率和较高效率省区基本集中于东部沿海,以河北、天津、山东、江苏、上海、浙江和福建省为主;而低效率和较低效率省区则普遍位于西北和西南半壁,整体呈现“东高西低”的梯度递减格局。
图1 中国物流业效率的空间分布
Fig. 1 Spatial distribution of logistics efficiency in China form 2003 to 2014
2) 物流业低效率区连片展布,高效率区集中镶嵌于东部并呈带状分布。研究期间,低效率和较低效率区集中连片分布于西北(新疆、宁夏、甘肃和青海)、西南(重庆、四川、贵州和云南等)和东北(黑龙江和吉林)3大区域。而高效率和较高效率区则呈块状镶嵌,相对集中于东部沿海发达省份,形成环渤海(河北、天津和山东)、长三角(上海、江苏和浙江)2大组团。近年来,辽宁、江苏、安徽和福建物流业效率迅速提升,高效率区块状格局逐渐连成一体,呈连续带状伸展。
3) 物流业效率极值分布兼具稳定和变化,具有一定的空间惰性和相变性。一方面,物流业效率的峰值和谷值(高值和低值)区间基本不变,具有初值依赖性。低效率区基本锁定于青海、四川和云南3省,与初期格局基本一致;而高效率区也具有地方依赖性,高度集中于河北、天津、上海和江苏。另一方面,极值范围变化明显,仍然存在一定的相变性。具体而言,相较初始相,低效率区范围在收缩,由期初的西北和西南地区及湖北逐渐收敛到云南和四川;高效率区范围基本在扩大,由期初的河北、天津、上海、浙江和福建5省扩展到期末的河北、天津、山东、江苏、安徽、上海、宁夏和湖南8省、市、自治区。
1) 物流业效率全局分布呈现弱集聚性,在非均衡的发展中趋于收敛。利用ArcGIS10.2的空间统计工具计算得出整体的全局Moran’s I指数(见表3)。在2003~2014年间,物流业效率的全局Moran’s I指数均为正,基本介于0.2~0.5间,表明物流业效率分布总体上呈现弱集聚状态。期间,Mo ran’s I指数呈现增长–下降–增长–下降的波动变化过程,整体呈下降态势,说明物流业效率在不均衡发展中趋于收敛。
表3 2003~2014年物流业效率分布的全局Moran’s I指数
Table 3 Global Moran’s I indices of logistics efficiency distribution from 2003 to 2014
| 年份 | 2003 | 2004 | 2005 | 2006 | 2007 | 2008 | 2009 | 2010 | 2011 | 2012 | 2013 | 2014 |
|---|---|---|---|---|---|---|---|---|---|---|---|---|
| Moran’s I | 0.285 | 0.288 | 0.462 | 0.515 | 0.202 | 0.375 | 0.324 | 0.200 | 0.079 | 0.282 | 0.343 | 0.292 |
| z 得分 | 2.651 | 2.644 | 4.034 | 4.517 | 1.968 | 3.366 | 2.946 | 1.966 | 0.932 | 2.587 | 3.078 | 2.645 |
| p 值 | 0.008 | 0.008 | 0.000 | 0.000 | 0.049 | 0.001 | 0.003 | 0.049 | 0.351 | 0.010 | 0.002 | 0.008 |
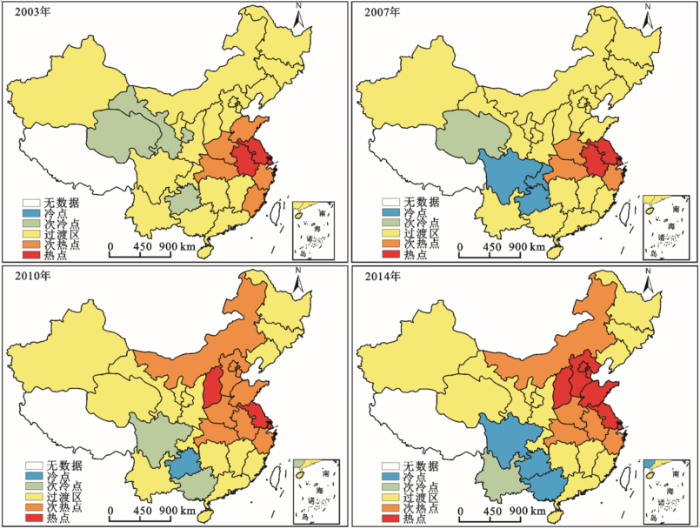
2) 物流业效率冷热点结构变化不一,高效率区持续北扩,低效率区退缩西南。从数量结构来看,热点和次热点区域数量上升幅度较大,比重由2003年的13.3%上升到2014年的30%;冷点和次冷点区域数量增长不明显,比重由2003年的10%缓慢增加到2014年的13.3%,表明物流业效率呈现由非均衡到均衡的发展态势。从冷热点空间分布来看,热点区集中于华北和长三角地区,而冷点区固守于西南;与此同时,热点和次热点区域呈现“西扩北扩”的态势,热点区由长三角地区向华北地区拓展,次热点区也由华中的河南和湖北及华东的山东和浙江向北扩展至内蒙古,表明华北地区和华中地区的空间联动性在加强。冷点和次冷点区范围变化不大,呈现由西北的甘肃和青海向西南的广西、云南和贵州变迁(图2),说明西北地区在转变经济发展方式、推进物流业结构调整发展方面已经初具成效,而西南地区因交通和区位劣势成为物流业效率的低值区。广东、福建等物流业效率较高的省份,并没有成为热点集聚区和形成规模效应,其物流业的发展对周边地区的带动作用不强。
图2 中国物流业效率的空间集聚性演化
Fig.2 Spatial cluster variations of logistics efficiency in Chinese mainland from 2003 to 2014
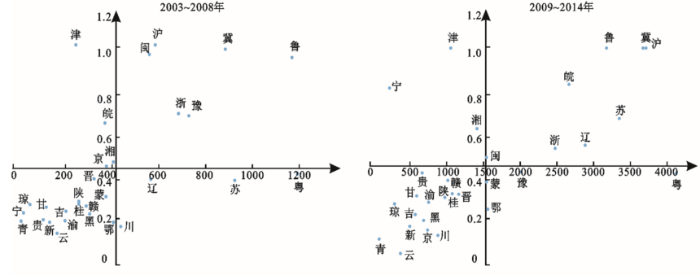
为了更清晰展现物流业效率(“质”)与物流业产值(“量”)之间的空间配置关系,以物流业产值为横轴、效率值为纵轴(以其平均值作为临界值),通过散点图将30个省(市、自治区)物流业的质和量配置性划分为4类,即高产值–高效率、低产值–高效率、低产值–低效率、高产值–低效率(图3),分析发现:
1) 物流业的效率与其产值具有高度的同配性。从省份象限分布来看,70%以上的省份集中在高产值–高效率、低产值–低效率2个象限,超过一半落于低产值–低效率区间,严格位于高–低区间的省份数量仅5个。其中,高产值–高效率的省份主要集中于上海、江苏、浙江、山东、河北等区域,其物流业具规模大、效率高等特点,成为物流业发展质量高的地区。低产值–低效率省份占据主导,比重超过50%,连片高度集聚于西北(新疆、青海、甘肃、陕西等)、西南(重庆、贵州、云南、广西等)、东北(黑龙江、吉林、内蒙古等)地区及中部部分省区(山西、湖北),这些地区物流业发展处于初级水平,既存在效率低下问题,又面临着高能耗、高污染等环境问题。低产值–高效率省份锁定于天津、湖南,物流业产值相对较低,发展潜力较大。高产值–低效率省份以广东为典型,物流业产值高,但效率低下,存在投入过多、能耗过大、污染较重等问题。
2) 物流业效率–产值的整体空间配置格局变化不大,但个别省份变动明显。宁夏由原来的低产值–低效率类型迅猛跃迁至高效率–高产值区,主要归因于能源结构优化与低碳物流业快速发展。江苏和辽宁由高产值–低效率类型进入高产值–高效率的“双高”行列,表明其物流业的要素配置趋于合理。而低产值–高效率区间中只有安徽成功实现转型迈入“双高”阵列,主要归功于长三角(上海、浙江、江苏)物流业高效率区的关联带动效应。北京则滑落到低产值–低效率象限,尽管拥有区位和交通优势,但因投入过大、产出不足、环境污染严重等问题,导致其物流业发展滞后。
图3 中国物流业效率与规模的散点匹配
Fig. 3 Allocation between logistics efficiency and its productivity in China
依据回归方程(5),借助Matlab2012a软件平台运用2003~2014年的面板数据采用最大似然法对空间滞后和空间误差模型进行估计。其中,空间权重矩阵采用各个省会城市距离衰减函数表征;根据豪斯曼检验(Hausman)结果(检验值为31.454,P值为0)采用固定效应模型;依据拉格朗日检验(LR-test)结果(检验值显示空间固定效应和时间固定效应均显著),选择双固定效应结果;通过稳健的拉格朗日检验(Robust LM)结果(空间滞后模型P值为0,在1%的显著性水平上拒绝原假设)选择空间滞后模型(表4),最终的模型解释为空间滞后双固定效应模型。
1) 经济发展水平:相关系数显著为正,区域经济的发展从供给和需求推动了物流效率的提高,在需求方面,经济发展水平高的区域,其内部本身经济活动的生产、流通和消费过程越频繁,同时也与周边地区具有大量货物、商品的来往,极大的促进了物流需求,从而扩大物流产业规模物。在供给方面,强大的经济基础可以为物流业发展提供丰厚的物质条件,有利于支持物流体系的建设、完善交通基础设施,从而降低物流运行成本,提高物流效率。
表4 模型估计结果
Table 4 Model estimation results
| 变量名称 | 空间误差模型 | 空间滞后模型 | ||||
|---|---|---|---|---|---|---|
| 空间固定效应 | 时间固定效应 | 双固定效应 | 空间固定效应 | 时间固定效应 | 双固定效应 | |
| 经济发展水平 | 0.129*(0.071) | 0.434***(0.000) | 0.288***(0.008) | 0.092(0.185) | 0.402***(0.000) | 0.276**(0.011) |
| 对外开放程度 | -0.004(0.8285) | -0.024(0.231) | -0.014(0.4794) | -0.006(0.765) | -0.023(0.257) | -0.014(0.492) |
| 市场环境 | 0.036(0.112) | 0.048***(0.001) | 0.068***(0.008) | 0.030(0.170) | 0.046***(0.005) | 0.067***(0.009) |
| 物流产业集聚 | 0.250***(0.001) | 0.229***(0.007) | 0.221**(0.004) | 0.260***(0.001) | 0.228***(0.008) | 0.224***(0.003) |
| 信息化水平 | 0.075***(0.000) | 0.129***(0.000) | 0.091***(0.000) | 0.063***(0.0001) | 0.133***(0.000) | 0.093***(0.000) |
| 物流能源强度 | -0.110***(0.006) | 0.046(0.127) | -0.091**(0.016) | -0.110***(0.006) | 0.040(0.202) | -0.093**(0.016) |
| 政府物流调控 | 0.437(0.187) | -0.821***(0.004) | 0.476(0.167) | 0.425(0.190) | -0.768***(0.009) | 0.453**(0.019) |
| 总环境规制 | 0.483(0.806) | -0.279(0.319) | 0.463(0.815) | 0.886(0.656) | -0.409(0.143) | 0.415(0.834) |
| 大气环境规制 | -0.0006(0.584) | 0.0004(0.822) | -0.0003 (0.771) | -0.0009(0.455) | 0.0006(0.757) | -0.0003(0.777) |
| R2/样本量 | 0.811/360 | 0.374/360 | 0.839/360 | 0.818/360 | 0.379/360 | 0.837/360 |
| 空间固定效应/时间固定效应似然比检验60.841(0.000) ***/23.984(0.000) *** | ||||||
| 拉格朗日乘数滞后检验/拉格朗日乘数误差检验49.651(0.000) ***/42.383(0.000)*** | ||||||
| 稳健拉格朗日乘数滞后检验/稳健拉格朗日乘数误差检验 19.761(0.000)***/4.539(0.073)* | ||||||
2) 对外开放程度:外商投资对物流业效率的提高不显著,这与国外Grossman等人[33]的研究结论不一致,主要是中国现阶段物流业发展所依托的公路、铁路、水运、航空等仍以国有为主,外资占比小;而且中国物流业的发展仍然处于较低的水平,难以与外资企业中以供应链整合、信息化服务等为标志的高端物流业形成有效竞争。因此,外商直接投资带来的资本效应、技术溢出对物流业的效率提高作用不明显。
3) 市场环境:市场化水平对提升物流业效率具有显著的正向溢出效应,市场化指数较高的省份,往往具有良好的市场竞争环境和管理秩序,一方面公平、开放的市场环境能够吸引更多物流企业的进入,在技术水平、生产服务、创新能力等多个方面对企业产生激励作用,激发整个物流产业的活力,另一方面先进的管理秩序,可以系统协调运输的组织方式、优化资源配置,实现物流业的集中经营。
4) 产业集聚程度:物流产业集聚对物流业效率的影响系数达到0.224,且通过1%的显著性水平检验,表明区域物流产业的集聚可以有效的提高物流业效率。物流产业的集聚可以增进物流企业的信息交流、共同利用物流基础设施和劳动力市场,便于节约生产成本,降低能源消耗。同时集聚的建立可以有效实现物流的集约化、专业化和区域化发展,促进物流的专业化和协作化生产,加快技术创新、提高物流资源利用率 ,产生规模经济效益。
5) 信息化水平:对物流效率的显著的正效应,相关系数为0.0925。随着信息通信技术的不断发展,物流信息化是现代物流发展的重要保障。信息化技术的应用在实现运输、仓储、包装、配送等一体化方面发挥着巨大作用,良好的信息化环境,利于物流产业上下游、区域之间的协调运作,极大地避免了信息不对称导致的重复运输,资源浪费等问题。同时,较高的信息化水平利于物流运作方式的创新和专业化发展,延伸传统的物流功能。
6) 物流能源强度:相关性系数为-0.093,且通过1%的显著性水平检验,说明物流能源强度对物流效率的提升具有显著的负向效应,区域物流业的能源强度越大,其物流业发展对能源的依赖性越强、能源消耗越大,同时物流业中的交通运输环节能源消耗主要以汽油、煤油、柴油等碳排放因子较大的能源为主,而清洁能源比重小。不合理的能源消费结构和过高的能源强度,导致物流能耗大、效率低下,这也从侧面验证了高能耗,高碳排是制约物流发展的瓶颈。
7) 政府物流调控:相关性系数为0.4525,且通过5%的显著性水平检验。现阶段政府的调控对物流业效率具有积极正向的影响。首先,物流业发展中存在着市场化不足、产业信息不对称等问题。政府调控在规范市场秩序、协调行业运作上可以发挥积极作用。其次,现代物流发展依托的交通基础设施、物流园区等多属于公共产品,其建设资金大、周期长、收益低,一般的营利性组织较少参与投资。政府财政投入可以完善物流基础设施,改善运行条件,从而有效地降低物流成本,提高物流效率。
8) 物流环境规制:计量结果显示,各省总体环境规制力度与大气环境规制力度对区域物流效率的提升作用均不显著。一方面是由于环境规制对产业效率的促进存在明显的滞后效应,其对效率的提升是一个中长期过程[34],物流业的发展尚未达到高级阶段,初期的环境规制会增加企业成本,减少企业盈利,从而降低企业的生产效率。另一方面中国的环境规制绩效低下,现有的环境规制忽视产业差异,规制僵化现象严重。目前,中国还没有形成专门物流环境规制法案,这也是致使环境规制对于激发企业技术创新,提高物流生产效率失灵的重要原因。
本文考量低碳约束因素,运用非期望产出的SBM-undesirable模型测度了2003~2014年30个省(市、自治区)的物流业发展效率,基于格局–过程–机理视角分析了低碳约束下物流业发展效率的空间演化特征及其影响因素:① 物流业效率空间异质性较强,呈现东部>中部>西部的梯度分异。高效率和较高效率的区域由“大集中、小分散”格局渐变成集中于东部沿海的“条带状”分布,基本位于长三角和华北地区,而低效率区则长期锁定于西北和西南半壁。② 省际物流效率呈先弱集聚性和空间联动性。全局上,Moran’s I指数值较小,空间集聚性不强;热点和次热点区域主要连片集中于长三角和华北地区,其物流业效率较高,物流空间联动效应明显,而西部、东北和中部省区的空间关联性较低。③ 物流业效率与其产值规模在空间上具有良好的同配性。70%以上的省份集中在高产值–高效率、低产值–低效率区间,尤以低产值–低效率类型为主。空间配置变化幅度不大,基本保持空间稳定性,个别省份呈现明显的类型跃迁。④ 低碳约束下物流效率的空间演化与区域宏观经济发展、物流产业环境、政策环境、环境规制等多种因素相关。区域经济发展水平、市场环境、物流产业集聚、信息化水平、政府物流调控对物流业效率具有显著的正向影响,能源强度则具有负向影响,而对外开放程度、环境规制对物流业效率的提升作用不明显。
综上,本文对于优化中国物流业布局和提高物流业效率的政策启示主要有:① 空间布局上:优化物流空间布局,实现区域联动发展。应重点支持以上海、浙江、江苏为主的长三角地区和以北京、天津、河北为主的华北地区的物流业发展,同时加大建设湖北、湖南、宁夏、福建、辽宁、广东等物流业效率潜力大的省份,逐步形成“南北互动,东西联通”的高效率物流业发展格局。② 经济环境上:构建开放型物流经济,优化物流业外商投资的制度和市场环境,加大物流领域利用外资力度。③ 环境规制上:实行物流业环境规制,推进物流节能减排。依据物流产业发展的现状,制定专门的物流环境规制法案;着重加强物流运输环节的节能减排,从源头上减少能耗与碳排放。
The authors have declared that no competing interests exist.
| [1] |
物流地理学研究进展与展望 [J].https://doi.org/10.11820/dlkxjz.2012.02.012 Magsci [本文引用: 1] 摘要
以国内地理学视角物流活动研究为基础,梳理了中国物流地理学的发展脉络和理论进展。通过文献研究方法,分析了国内物流地理学的研究背景,对主要研究领域进行了综述,进一步理清了地理学研究与物流学研究的边缘学术衔接点,映射了20 年来中国学术背景下的物流地理学的研究进展和规律,列举出了各研究板块的代表性文献,对国内物流地理学研究的深化开辟了新的理论途径。研究表明,中国学术界物流地理研究宏观属性相对明显,地理学视角研究极大地丰富了物流活动研究的理论基础和方法论体系,已形成了物流运输地理研究、区域物流地理研究、港口场站物流地理研究、物流地理信息系统研究和物流地理综合性方法论研究等主要研究板块。最后,依托国内物流地理学研究的基本态势和现实经济社会发展的需求,探讨了未来中国物流地理学研究的基本趋向。
Research progress of Logistics Geography in China .https://doi.org/10.11820/dlkxjz.2012.02.012 Magsci [本文引用: 1] 摘要
以国内地理学视角物流活动研究为基础,梳理了中国物流地理学的发展脉络和理论进展。通过文献研究方法,分析了国内物流地理学的研究背景,对主要研究领域进行了综述,进一步理清了地理学研究与物流学研究的边缘学术衔接点,映射了20 年来中国学术背景下的物流地理学的研究进展和规律,列举出了各研究板块的代表性文献,对国内物流地理学研究的深化开辟了新的理论途径。研究表明,中国学术界物流地理研究宏观属性相对明显,地理学视角研究极大地丰富了物流活动研究的理论基础和方法论体系,已形成了物流运输地理研究、区域物流地理研究、港口场站物流地理研究、物流地理信息系统研究和物流地理综合性方法论研究等主要研究板块。最后,依托国内物流地理学研究的基本态势和现实经济社会发展的需求,探讨了未来中国物流地理学研究的基本趋向。
|
| [2] |
中国碳强度对行业发展、能源效率及中间投入系数的弹性研究 [J].
运用基于投入产出表的碳强度弹性计算模型,本文测算了碳强度对行业发展、能源效率及中间投入系数的弹性。测算结果揭示了29个行业的发展对全国碳强度的影响,并区分了为实现碳强度目标而应当控制发展的8个行业和鼓励发展的21个行业;量化了各行业提高能源效率对全国碳强度的影响,并辨识出需要提高能源效率的3个关键行业;刻画了发挥行业间相互关联的经济效率对全国碳强度的影响,并寻找出需要提高能源技术水平和管理水平的5个重点行业。
Elasticities of China’s carbon intensity with respect to industrial development energy efficiency and intermediate input coefficients .
运用基于投入产出表的碳强度弹性计算模型,本文测算了碳强度对行业发展、能源效率及中间投入系数的弹性。测算结果揭示了29个行业的发展对全国碳强度的影响,并区分了为实现碳强度目标而应当控制发展的8个行业和鼓励发展的21个行业;量化了各行业提高能源效率对全国碳强度的影响,并辨识出需要提高能源效率的3个关键行业;刻画了发挥行业间相互关联的经济效率对全国碳强度的影响,并寻找出需要提高能源技术水平和管理水平的5个重点行业。
|
| [3] |
Evaluating the comparative efficiency of Chinese third-party logistics providers using data envelopment analysis [J].https://doi.org/10.1108/09600030810875373 URL [本文引用: 1] 摘要
Abstract Purpose – The purpose of this paper is to develop a benchmark of performance standards for Chinese third-party logistics providers (3PLs) in the emerging market. It also intends to identify various factors that significantly affect the operational efficiency of the Chinese 3PLs and propose ways to improve the competitiveness of 3PLs. Design/methodology/approach – This paper proposes data envelopment analysis (DEA) to measure the operational efficiency of ten leading 3PLs in China, relative to prior periods and their key competitors. In particular, this paper develops both the Charnes, Cooper and Rhodes model and the Banker, Charnes and Cooper model that are designed to derive weights without being fixed in advance. It also uses step-wise regression analysis to identify factors influencing the performances of Chinese 3PLs. Findings – First, the declining efficiency within some Chinese 3PLs coincides with a steep decline in domestic transportation activities due to the SARS outbreak and the slow adaptation of state-owned enterprise into a more market-based economy. Second, the sales opportunity and the level of technical expertise are directly correlated with the operational efficiency of 3PLs, whereas the size of 3PLs has no direct bearing on the 3PL's performance. Third, in contrast with the 3PL industry in the USA, the Chinese 3PLs tend to focus on traditional service offerings such as port management, transportation, and warehousing rather than playing the role as the integrator or the lead service provider. Originality/value – This paper is the first attempt to utilize DEA to develop performance benchmarks for 3PLs in the emerging foreign market. The proposed DEA can be easily modified or extended to similar settings in other Asian countries such as India and East European countries.
|
| [4] |
中国区域综合运输效率的测度及其时空演化 [J].
以中国31个省(市、自治区)为研究单元,采用DEA模型对1988~2011年中国省域综合运输效率时空演化特征进行了分析,结果发现:中国省域综合运输效率总体水平较低,呈现出东部高而中西部低的空间格局;从分解效率来看,中国省域综合运输技术效率水平较低,规模效率普遍较高,技术效率是影响综合运输效率时空格局变化的主要因素.3/4省份完成了由规模收益递增阶段向规模收益递减阶段的过渡,运输资源要素的投入冗余阻碍了综合运输效率水平提高,调控和优化现有运输资源结构,提高技术效率成为提高综合运输效率的主要途径.
Comprehensive measurement and evolution of regional integrated transport efficiency in China .
以中国31个省(市、自治区)为研究单元,采用DEA模型对1988~2011年中国省域综合运输效率时空演化特征进行了分析,结果发现:中国省域综合运输效率总体水平较低,呈现出东部高而中西部低的空间格局;从分解效率来看,中国省域综合运输技术效率水平较低,规模效率普遍较高,技术效率是影响综合运输效率时空格局变化的主要因素.3/4省份完成了由规模收益递增阶段向规模收益递减阶段的过渡,运输资源要素的投入冗余阻碍了综合运输效率水平提高,调控和优化现有运输资源结构,提高技术效率成为提高综合运输效率的主要途径.
|
| [5] |
Assessing the logistics efficiency of European countries by using the DEA-PC methodology [J].https://doi.org/10.3846/16484142.2014.928787 URL [本文引用: 1] |
| [6] |
物流产业效率评价及与FDI质量相关性分析——基于2002-2011年数据的实证 [J].Evaluation of the efficiency of the logistics industry and correlation analysis of FDI quality:Based on 2002-2011 empirical data . |
| [7] |
Assessing the logistics efficiency of European countries by using the DEA-PC methodology [J].https://doi.org/10.3846/16484142.2014.928787 URL [本文引用: 1] |
| [8] |
Evaluating economic and environmental efficiency of global airlines: A SBM-DEA approach [J].https://doi.org/10.1016/j.trd.2013.12.013 URL [本文引用: 1] 摘要
This study examined the economic and environmental efficiency of 27 global airlines in 2010. An extended environmental slacks-based measure data envelopment analysis model with the weak disposability assumption was developed to assess the efficiency of the airlines. Asia-based airlines are generally more efficient, followed by European and American airlines. The poor fuel consumption is a major cause of inefficient airlines both in economic and environmental aspects.
|
| [9] |
Vasiliauskas. Analysis of factors impacting development of transport and logistics services [J].
1. A well-functioning freight transportation system is an essential element in any successful economy. Therefore freight transportation system will face challenges that will require the development of new paradigms of operations and planning. 2. Key issues and challenges that will affect freight transport market and logistics in the future include: demands for freight transportation and logistics services, the ability of the physical infrastructure, the role of road pricing, the impact of information technology and latest developments in logistics management. 3. New freight-transport systems must be responsive to user needs and expectations. Consumers will demand more control of the nature of the service they receive. This trend will be accentuated by the availability of information systems and technologies that enable users to specify the kinds of service they require and to integrate their operations effectively with the freight transportation system. 4. The article presents an insight of the key issues and challenges that will affect freight transport market and logistics in the future, including analysis of those challenges and description on possible effects of their impacts to the effectiveness of transport system performance. Keywords: transport and logistics services.
|
| [10] |
中国物流业技术效率差异及其影响因素研究——基于省级面板数据的实证分析 [J].
以1991~2(D7年中国大陆29个省级地区面板数据为基础, 采用外生性影响因素与随机前沿生产函数模型联合估计的方法(SFA一步法),测算了中国各地区物流业技术效率,考察了人力资本、制度、政府干预、开放程度 及产业结构等环境因素对物流业技术效率的影响。主要发现有:考察期间中国物流业技术效率仍处于较低水平,地区间存在差异,且在扩大;政府干预、国有率阻碍 技术效率提升,但负面影响在减小;人力资本、开放程度促进技术效率提升,但由于二者存在交互影响使得它们对物流效率的作用在中、西部地区明显弱于东部地 区;“西部大开发”战略的实施,使得产业结构调整对该地区物流效率的促进作用变为显著;就物流发展环境而言,中部地区存在“塌陷”现象;改善物流环境对促 进地区协调发展有重要意义。
Logistics technical efficiency disparity and affecting factors: Based on cross-province panel data using a single-stage estimation of the stochastic frontier analysis .
以1991~2(D7年中国大陆29个省级地区面板数据为基础, 采用外生性影响因素与随机前沿生产函数模型联合估计的方法(SFA一步法),测算了中国各地区物流业技术效率,考察了人力资本、制度、政府干预、开放程度 及产业结构等环境因素对物流业技术效率的影响。主要发现有:考察期间中国物流业技术效率仍处于较低水平,地区间存在差异,且在扩大;政府干预、国有率阻碍 技术效率提升,但负面影响在减小;人力资本、开放程度促进技术效率提升,但由于二者存在交互影响使得它们对物流效率的作用在中、西部地区明显弱于东部地 区;“西部大开发”战略的实施,使得产业结构调整对该地区物流效率的促进作用变为显著;就物流发展环境而言,中部地区存在“塌陷”现象;改善物流环境对促 进地区协调发展有重要意义。
|
| [11] |
Managing reverse logistics to enhance sustainability of industrial marketing [J].https://doi.org/10.1016/j.indmarman.2012.04.006 URL [本文引用: 1] 摘要
In this paper, a sustainable industrial marketing framework of latest requirement of green and sustainable operation is proposed. When literatures in strategy, marketing and operation have provided insight about the efficiency of reverse logistics and business value for the customer, the interrelationship is still under explored. This raises the question whether manufacturers could determine ecological friendly strategies to address their customer's environmental conscious needs and design the suitable solution to strike the balance between ecology and economics. Based on the case study of a medical product manufacturer, this study addresses this question by investigating how manufacturers identify the problem of reverse logistics; design and develop of sustainable product and service by enhancing the efficiency of operations, and market competencies that add value to their customers' business processes. Within the strategy for designing for effective reverse logistics, these findings contribute to understand the use of information system and technology for reverse logistics to enhance the customer's business process and provide value-added process for customer retention.
|
| [12] |
我国物流业地区间效率差异及其影响因素实证研究——基于数据包络分析模型及托宾模型的分析 [J].https://doi.org/10.3969/j.issn.1007-8266.2010.09.005 URL [本文引用: 1] 摘要
文章采用数据包络分析模型和托宾模型,利用省际面板数据对我国物流业地区间效率及其影响因素进行分析。研究结果表明,我国区域物流综合技术效率不高;区域物流效率差异正在逐步缩小;东部地区物流效率较中西部地区略高;物流资源利用率、区域市场化程度以及港口物流在区域物流中的重要性是影响区域物流效率的重要因素。为提高我国物流产业效率,应着力强化各省、市、自治区物流市场化程度,建设全方位、开放、统一的市场和流通体系;提升区域物流技术投入与应用效率,提高物流信息技术应用水平;提高物流资源利用率,合理布局物流产业,防止地区条块分割,促使物流业由粗放型向集约型投资转变,强调区域物流的有序竞争;加快港口物流发展。
An empirical analysis on the regional disparity of efficiency and factor in China’s Logistics: Based on DEA and Tobit Model .https://doi.org/10.3969/j.issn.1007-8266.2010.09.005 URL [本文引用: 1] 摘要
文章采用数据包络分析模型和托宾模型,利用省际面板数据对我国物流业地区间效率及其影响因素进行分析。研究结果表明,我国区域物流综合技术效率不高;区域物流效率差异正在逐步缩小;东部地区物流效率较中西部地区略高;物流资源利用率、区域市场化程度以及港口物流在区域物流中的重要性是影响区域物流效率的重要因素。为提高我国物流产业效率,应着力强化各省、市、自治区物流市场化程度,建设全方位、开放、统一的市场和流通体系;提升区域物流技术投入与应用效率,提高物流信息技术应用水平;提高物流资源利用率,合理布局物流产业,防止地区条块分割,促使物流业由粗放型向集约型投资转变,强调区域物流的有序竞争;加快港口物流发展。
|
| [13] |
长三角城市物流发展效率的时空格局演化特征与机制 [J].
基于城市物流的投入产出指标,借助数据包络分析和探索性数据分析 方法,分析了2002-2011年长三角城市物流发展效率的总体演化趋势、结构和空间格局的演化过程以及演化机制.分析表明:①2002-2011年间长 三角城市物流发展总体效率不断上升,但生产要素存在着较大的挖掘空间,物流业投入仍处于规模不经济状态.②各个城市物流发展效率表现出差异化特征,城市物 流发展的效率高低与城市经济发展的水平未能一致.③长三角城市物流发展效率空间异质性增强,但沿海港口城市和综合交通枢纽城市均呈现出较高的物流发展效 率.研究认为:区位优势、经济政策、产业结构调整与转型升级、基础设施投资、技术的进步共同促进城市物流发展效率空间格局的转变.
The spatio-temporal evolution characteristics and mechanism of yangtze river delta city logistics development efficiency .
基于城市物流的投入产出指标,借助数据包络分析和探索性数据分析 方法,分析了2002-2011年长三角城市物流发展效率的总体演化趋势、结构和空间格局的演化过程以及演化机制.分析表明:①2002-2011年间长 三角城市物流发展总体效率不断上升,但生产要素存在着较大的挖掘空间,物流业投入仍处于规模不经济状态.②各个城市物流发展效率表现出差异化特征,城市物 流发展的效率高低与城市经济发展的水平未能一致.③长三角城市物流发展效率空间异质性增强,但沿海港口城市和综合交通枢纽城市均呈现出较高的物流发展效 率.研究认为:区位优势、经济政策、产业结构调整与转型升级、基础设施投资、技术的进步共同促进城市物流发展效率空间格局的转变.
|
| [14] |
Improving the efficiency of metropolitan area transit by joint analysis of its multiple providers [J].https://doi.org/10.1016/j.tre.2011.04.006 URL [本文引用: 1] 摘要
Public transportation in a metropolitan area often is supplied by multiple types of transit. This paper develops and illustrates a DEA-based procedure for estimating: overall efficiency of an area’s public transportation; technical efficiencies of the individual transit types; effect of each type on overall efficiency; and efficiency of the allocation of resources among types and an algorithm for improving it. The paper concludes that the overall efficiency of an urban area’s public transportation can be validly estimated only if the technical efficiency of each major transport type and the efficiency in allocating resources among them are taken into consideration.Highlights? Synthesis of transit agency efficiency requires analysis of each mode employed. ? We estimate efficiency of total agency and each mode, and impact of each mode on total. ? We estimate agency’s allocation efficiency, and input reallocations to improve it.
|
| [15] |
Levers of logistics service providers’ efficiency in urban distribution [J].https://doi.org/10.1007/s12063-017-0125-4 URL [本文引用: 1] 摘要
This paper identifies the most important factors that influence the productivity of the urban fleet of a Logistics Service Provider (LSP). Through a regression analysis on a dataset from distribution warehouses of a single LSP, three main levers are shown to have significant impacts on productivity, namely the network design, the vehicle loading strategy, and the business environment wherein the operations are carried out. This paper contributes to bridge the gap about the lack of works addressing the efficiency of LSPs operating in urban areas, by performing a detailed empirical analysis instead of taking an aggregated company perspective.
|
| [16] |
In-plant logistics efficiency valuation using discrete event simulation [J].https://doi.org/10.2507/IJSIMM14(1)6.289 URL [本文引用: 1] 摘要
Abstract The purpose of this paper is to present an applicable approach for the valuation of in-plant logistics efficiency. Therefore, we developed a time-based efficiency concept that considers all relevant time losses when executing production logistics processes. The occurring delays are captured in real-time using modern auto-ID-technologies. For the valuation and improvement of in-plant logistics efficiency, we propose to use simulation modelling to investigate the cause-effect relations in the production system in advance. Thus, a discrete event simulation model has been constructed to model the workflow of a production system with discrete manufacturing processes and its in-plant logistics processes. The aim of the provided simulation study is to prove the functionality and to verify the applicability of the current approach in business practice.
|
| [17] |
Improvement of efficiency of enterprises operating in the services sector on the basis of logistics concepts [J].https://doi.org/10.21003/ea.V156-0023 URL [本文引用: 1] 摘要
At the modern stage of worldwide economic progress, there appears to be an advanced sphere of services related to social and economic life of industrially developed countries. On the basis of statistical data analysis, it emerges that despite the difficult situation in the sphere of finance and economics in the country, the Ukrainian services sector has shown positive growth trends over the past five years. Choosing a logistics concept to improve the efficiency of enterprises operating in the services sector is relevant because such an approach provides maximum control over the costs and market sensitivity of enterprises with regard to consumer needs. It has been found out that the main criteria of economic efficiency in the services sector are cost minimisation and enhanced quality of services. The article offers some recommendations related to the improvement of the efficiency of enterprises operating in the services sector, which, according to their influence on business activity of enterprises, are classified as those that cause minor, tangible or major changes and reduce enterprises- expenditures. The proposed recommendations will help enterprises meet consumer needs, enhance the quality of services and significantly reduce expenditures.
|
| [18] |
Combinatorial optimization and Green Logistics [J].https://doi.org/10.1007/s10479-009-0651-z URL [本文引用: 1] 摘要
The purpose of this paper is to introduce the area of Green Logistics and to describe some of the problems that arise in this subject which can be formulated as combinatorial optimization problems. The paper particularly considers the topics of reverse logistics, waste management and vehicle routing and scheduling.
|
| [19] |
From a literature review to a conceptual framework for sustainable supply chain management [J].https://doi.org/10.1016/j.jclepro.2008.04.020 URL [本文引用: 1] 摘要
Both practitioners in companies and academics might find the review useful, as it outlines major lines of research in the field. Further, it discusses specific features of sustainable supply chains as well as limitations of existing research; this should stimulate further research.
|
| [20] |
Operations research for green logistics:An overview of aspects, issues, contributions and challenges [J].https://doi.org/10.1016/j.ejor.2011.11.010 URL [本文引用: 1] 摘要
The worldwide economic growth of the last century has given rise to a vast consumption of goods while globalization has led to large streams of goods all over the world. The production, transportation, storage and consumption of all these goods, however, have created large environmental problems. Today, global warming, created by large scale emissions of greenhouse gasses, is a top environmental concern. Governments, action groups and companies are asking for measures to counter this threat. Operations Research has a long tradition in improving operations and especially in reducing costs. In this paper, we present a review that highlights the contribution of Operations Research to green logistics, which involves the integration of environmental aspects in logistics. We give a sketch of the present and possible developments, focussing on design, planning and control in a supply chain for transportation, inventory of products and facility decisions. While doing this, we also indicate several areas where environmental aspects could be included in OR models for logistics.
|
| [21] |
物流高级化的低碳物流运作理论与策略研究 [J].Research into the theory and strategy of low-carbon-Logistics base on logistics-advancing . |
| [22] |
Estimation of the contribution of road traffic emissions to particulate matter concentrations from field measurements: a review [J].https://doi.org/10.1016/j.atmosenv.2013.04.028 URL [本文引用: 1] 摘要
Road traffic is one of the main sources of particulate matter in the atmosphere. Despite its importance, there are significant challenges in quantitative evaluation of its contribution to airborne concentrations. This article first reviews the nature of the particle emissions from road vehicles including both exhaust and non-exhaust (abrasion and re-suspension sources). It then briefly reviews the various methods available for quantification of the road traffic contribution. This includes tunnel/roadway measurements, twin site studies, use of vehicle-specific tracers and other methods. Finally, the application of receptor modelling methods is briefly described. Based on the review, it can be concluded that while traffic emissions continue to contribute substantially to primary PM emissions in urban areas, quantitative knowledge of the contribution, especially of non-exhaust emissions to PM concentrations remain inadequate. (C) 2013 Elsevier Ltd. All rights reserved.
|
| [23] |
中国交通CO2排放时空格局演变及其影响因素——基于2000-2012年30个省(市)面板数据的分析 [J].https://doi.org/10.13249/j.cnki.sgs.2016.04.002 Magsci [本文引用: 1] 摘要
通过构建交通CO2排放模型对2000~2012年中国30个省(市)的交通CO2排放时空演变特征进行了分析。并采取“由大到小”逐步回归的建模方式,在传统的固定效应模型(面板数据模型)基础上引入时间固定效应,构建了双向固定效应模型对中国交通CO2排放的社会经济、城市形态、交通发展等方面的影响因素进行研究。结果表明:2000~2012年期间,中国交通CO2排放总量和人均交通CO2排放量分别以9.29%和8.69%的年均增速增长,前者的区域差异呈先增后减趋势,后者的区域差异则首先呈周期性波动,而后一直保持减少趋势。人均GDP和城镇居民家庭人均可支配收入对人均交通CO2排放具有显著的正向效应,表明社会经济发展和居民收入水平提高是交通CO2排放增长的主要驱动因素。城市人口密度对交通CO2排放亦具有显著的正向效应,这意味着未来中国应加强对城市人口密度的规划控制,以避免因人口过度集聚而额外增加产生交通CO2排放。公共交通发展水平对交通CO2排放增长具有显著的负向效应,但小汽车拥有率对交通CO2排放的影响并不显著。
The evolution of spatial-temporal characteristics and influence factors of CO2 emissions from transport in China: A panel data analysis of 30 provinces in China from 2000 to 2012 .https://doi.org/10.13249/j.cnki.sgs.2016.04.002 Magsci [本文引用: 1] 摘要
通过构建交通CO2排放模型对2000~2012年中国30个省(市)的交通CO2排放时空演变特征进行了分析。并采取“由大到小”逐步回归的建模方式,在传统的固定效应模型(面板数据模型)基础上引入时间固定效应,构建了双向固定效应模型对中国交通CO2排放的社会经济、城市形态、交通发展等方面的影响因素进行研究。结果表明:2000~2012年期间,中国交通CO2排放总量和人均交通CO2排放量分别以9.29%和8.69%的年均增速增长,前者的区域差异呈先增后减趋势,后者的区域差异则首先呈周期性波动,而后一直保持减少趋势。人均GDP和城镇居民家庭人均可支配收入对人均交通CO2排放具有显著的正向效应,表明社会经济发展和居民收入水平提高是交通CO2排放增长的主要驱动因素。城市人口密度对交通CO2排放亦具有显著的正向效应,这意味着未来中国应加强对城市人口密度的规划控制,以避免因人口过度集聚而额外增加产生交通CO2排放。公共交通发展水平对交通CO2排放增长具有显著的负向效应,但小汽车拥有率对交通CO2排放的影响并不显著。
|
| [24] |
Energy consumption and energy efficiency of the transportation sector in Shanghai [J].https://doi.org/10.3390/su6020702 URL [本文引用: 1] 摘要
This article investigates changes in the transportation sector in Shanghai between 2000 and 2010 and the implications of this on transportation energy consumption and energy efficiency. The results show that from 2000 to 2010: (1) the traffic energy consumption increased from 597.96 million tons of carbon to 2070.22 million tons of carbon, with an average annual growth rate of 13.49%, and oil met 94.49% of this energy demand by 2010; (2) among present transportation modes, waterway transportation accounts for over 50% of the energy consumption within the transportation sector (on the dominant transportation modes for Shanghai residents, private car use accounted for the largest proportion of energy consumption, whereas rail transportation accounted for the smallest proportion of energy consumption); (3) the energy consumption per unit conversion traffic volume had an upward trend, whereas the energy consumption per unit output value showed a declining trend. Across the study period, the energy consumption elasticity coefficient is 0.94 on average, indicating that the change rate of energy consumption has lagged behind that of economic growth. Correspondingly, some recommendations for energy policy were presented.
|
| [25] |
中国省际物质资本存量估算:1952-2000 [J].
通过回顾和比较已有研究中国资本存量的相关文献 ,考虑到中国国内生产总值历史数据的几次重大补充和调整 ,本文对各年投资流量、投资品价格指数、折旧率 重置率、基年资本存量的选择与构造以及缺失数据进行了认真的处理和研究 ,并在此基础上利用补充和调整后的分省数据 ,根据永续盘存法估计了中国大陆 3 0个省区市 1 952— 2 0 0 0年各年末的物质资本存量。
The Estimation of China's provincial capital stock:1952-2000 .
通过回顾和比较已有研究中国资本存量的相关文献 ,考虑到中国国内生产总值历史数据的几次重大补充和调整 ,本文对各年投资流量、投资品价格指数、折旧率 重置率、基年资本存量的选择与构造以及缺失数据进行了认真的处理和研究 ,并在此基础上利用补充和调整后的分省数据 ,根据永续盘存法估计了中国大陆 3 0个省区市 1 952— 2 0 0 0年各年末的物质资本存量。
|
| [26] |
|
| [27] |
IPCC guidelines for national greenhouse gas inventories [EB/OL] . |
| [28] |
|
| [29] |
A slacks-based measure of efficiency in data envelopment analysis [J].https://doi.org/10.1016/S0377-2217(99)00407-5 URL [本文引用: 1] 摘要
In this paper, we will propose a slacks-based measure (SBM) of efficiency in Data Envelopment Analysis (DEA). This scalar measure deals directly with the input excesses and the output shortfalls of the decision making unit (DMU) concerned. It is units invariant and monotone decreasing with respect to input excess and output shortfall. Furthermore, this measure is determined only by consulting the reference-set of the DMU and is not affected by statistics over the whole data set. The new measure has a close connection with other measures proposed so far, e.g., Charnes–Cooper–Rhodes (CCR), Banker–Charnes–Cooper (BCC) and the Russell measure of efficiency. The dual side of this model can be interpreted as profit maximization, in contrast to the ratio maximization of the CCR model. Numerical experiments show its validity as an efficiency measurement tool and its compatibility with other measures of efficiency.
|
| [30] |
Local indicators of spatial association—LISA [J].https://doi.org/10.1111/j.1538-4632.1995.tb00338.x URL [本文引用: 1] 摘要
The capabilities for visualization, rapid data retrieval, and manipulation in geographic information systems (GIS) have created the need for new techniques of exploratory data analysis that focus on the 090008spatial090009 aspects of the data. The identification of local patterns of spatial association is an important concern in this respect. In this paper, I outline a new general class of local indicators of spatial association (LISA) and show how they allow for the decomposition of global indicators, such as Moran's I, into the contribution of each observation. The LISA statistics serve two purposes. On one hand, they may be interpreted as indicators of local pockets of nonstationarity, or hot spots, similar to the Gi and G*i statistics of Getis and Ord (1992). On the other hand, they may be used to assess the influence of individual locations on the magnitude of the global statistic and to identify 090008outliers,090009 as in Anselin's Moran scatterplot (1993a). An initial evaluation of the properties of a LISA statistic is carried out for the local Moran, which is applied in a study of the spatial pattern of conflict for African countries and in a number of Monte Carlo simulations.
|
| [31] |
A computer movie simulating urban growth in the Detroit Region [J].https://doi.org/10.2307/143141 URL [本文引用: 1] |
| [32] |
|
| [33] |
Endogenous, Innovation in the Theory of Growth [J].https://doi.org/10.1257/jep.8.1.23 URL [本文引用: 1] 摘要
This paper makes the case that purposive, profit-seeking investments in knowledge play a critical role in the long-run growth process. First, the authors review the implications of neoclassical growth theory and the more recent theories of 'endogenous growth.' Then they discuss the empirical evidence that bears on the modeling of long-run growth. Finally, the authors describe in more detail a model of growth based on endogenous technological progress and discuss the lessons that such models can teach us.(This abstract was borrowed from another version of this item.)
|
| [34] |
America’s Green Strategy [J].https://doi.org/10.1038/scientificamerican0491-168 URL [本文引用: 1] |

/
| 〈 |
|
〉 |