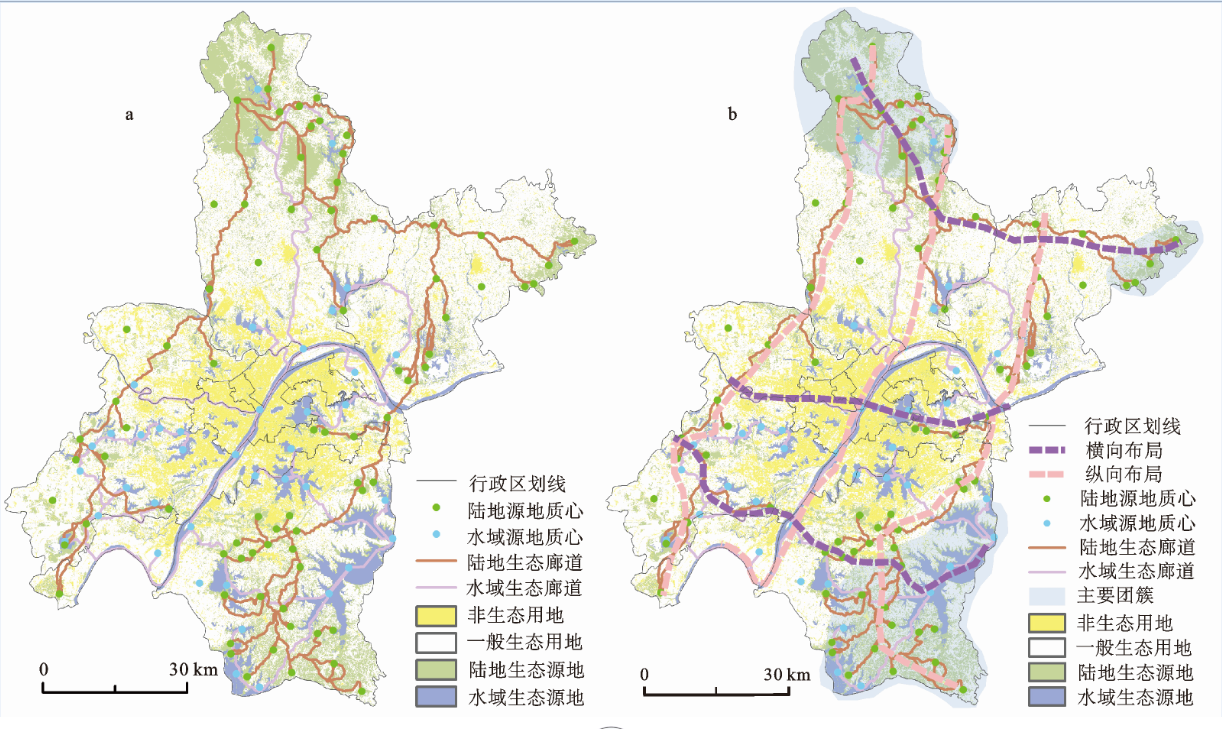
Ecological security pattern is the bridge between ecosystem services and human society development, and it is a healthy spatial pattern of ecosystem existing in landscape. Most of the studies on corridor extraction have insufficient quantitative basis and strong subjectivity. For example, all ecological sources are directly used for the extraction of ecological corridors, or after subjectively eliminating or merging small ecological source areas, the remaining ecological source areas are used to extract ecological corridors, which is easy to cause the problems of corridor redundancy or low credibility. In addition, the research on the optimization of the ecological security pattern is not in-depth enough, which is mainly manifested in the determination of the optimized areas of the ecological security pattern without quantitative analysis of the optimization effect. This paper takes Wuhan City as an example, by analyzing ecosystem service value, ecological sensitivity, landscape connectivity and ecological needs, Wuhan land and water ecological sources were identified. And using genetic algorithm to obtain the optimal ecological source, on this basis, the minimum cumulative resistance model (MCR) was used to extract the land and water ecological corridors, respectively. The ecological source and ecological corridor are superimposed to construct the ecological security pattern of Wuhan in 2017. The results show that in 2017, the total area of ecological source in Wuhan was about 1917.342 km2, of which the land and water ecological source areas were 780.217 km2 and 1137.125 km2, respectively. The number of the optimal land and water ecological sources identified by the genetic algorithm is 65 and 32 respectively. The extracted ecological corridors have a total length of 2 305.37 km, and the length of land and water ecological corridors is 1 497.86 km and 807.51 km, respectively. The ecological security pattern in Wuhan presents the characteristics of “three horizontal, three vertical and three clusters”, and in general, the ecological security pattern can construct a circular intersecting layout of ecological sources. In addition, eight new land ecological stepping stones, 8 new water ecological stepping stones and 5 new ecological sources were added in this paper. The graph theory method was used to compare the relevant indexes before and after optimization, and it was found that a more perfect ecological security pattern could be constructed after optimization, the optimization effect is good and the optimization scheme is feasible. The construction and optimization method of ecological security pattern can provide a more scientific reference for the study of ecological security pattern in rapidly developing metropolises.
Based on the data of corporate holding in strategic emerging industries and the data of invention patents transfer among Chinese cities in 2018, the interurban technology transfer network based on corporate holding and patent transfer is constructed respectively. Combined with geospatial and complex network analysis methods, this paper analyzes the characteristics of urban centrality, multi-scale network correlation strength, community structure and distance attenuation. The results show that: 1) The urban intensity centrality of corporate holdings and patent transfers are distributed in “core-periphery” and banded clusters respectively. Regional central cities and developed eastern coastal cities have played a major intermediary role in the corporate and patent network. Patent transfer is more conducive to technology transfer in different professional categories than corporate holding; 2) The corporate network is hierarchical, and the patent network is more open and liquid. Among them, corporate holding is a coordinated unilateral leading transfer path, while patent transfer is a bilateral interactive transfer path pursuing efficiency; 3) The corporate network is mainly a geographically adjacent community structure of “contiguous gathering and gradually spreading”, while the patent network is a cross-regional group model of “partial partnership and extensive collaboration”; 4) Both corporate holding and patent transfer have obvious distance attenuation characteristics, but their distance attenuation patterns are different at different stages.
Based on the Landsat TM remote sensing images of 2000, 2010, and 2020, landscape pattern index, index of regional ecological environment quality were used to explore the temporal and spatial variation characteristics of land landscape pattern and the response law of landscape ecological environment in the Yangtze River Economic Belt. The results showed 1) The spatial distribution of forest land, grassland and other ecological land in the upper, middle and lower reaches of the Yangtze River Economic Belt is misplaced with the spatial distribution of man-made surface. The main transfer direction of ecological land is cultivated land and man-made surface. 2) At the landscape level, the index of aggregation degree decreased, the index of fragmentation degree and the index of diversity increased from 2000 to 2020. At the class level, the degree of fragmentation of cultivated land increased, and the spatial connection of the manmade surface was continuously strengthened, which tends to develop on a large scale. 3) From 2000 to 2020, the the coexistence of the ecological improvement trend and the ecological deterioration trend of the ecological environment quality weakens the temporal variability of the overall ecological environment. Spatially, the low-value area of the ecological environment quality index is closely related to the spatial pattern of the three major urban agglomerations in the Yangtze River Economic Belt. 4) The changes in the ecological environment under the transformation of the dominant function of land use, the side effects of the population siphon effect, and the industrial structure affected the spatial distribution of the ecological environment of urban agglomerations.
The wide application of information technology play a very important role in tourism development, but few studies have divided it into an information infrastructure layer and an information technology consumption layer. Based on the data of the balance panel model of 31 provinces from 2005 to 2017, this article uses a DEA model to measure the economic efficiency of tourism of each research unit and uses ArcGIS spatial statistical tools to carry out spatial visualization analysis. On this basis, we further investigate the mechanism of information infrastructure, information technology consumption and control variables on the economic efficiency of tourism. The main findings are as follows: 1) The development of (In-formation Communication Technology, ICT) has not improved the economic efficiency of tourism in China as a whole, which proves the existence of the Solow Paradox and Gordon effect in the tourism sector; 2) The promotion effect of ICT on the economic efficiency of tourism mainly benefits from the drive of information infrastructure. However, the consumption of information technology has a significant restraining effect on the economic efficiency of tourism, and the main reason is the insufficient application of information technology by tourism operators. Depending on factor input and scale economy to improve the economic output and efficiency of tourism is still the main development mode of tourism in many provinces during the study period. 3) The spatial differential development of the regional economy further strengthens the spatial difference in the economic efficiency of tourism. The economic efficiency of tourism in China’s three regions still shows a gradient of East > Central > West. The spatial boundary of scale efficiency is the Hu Huanyong Line, and spatial differentiation is constantly expanding. The causes of the Solow paradox and Gordon effect in the tourism sector mainly lie in the insufficient application of information technology by tourism operators. In the western China in particular, the ability to transform modern information technology into advanced productive forces is still limited. With the rapid development and diffusion of information technology, the degree to which the tourism and information industries are integrated is increasing, and the influence of the information level on the tourism economy is gradually strengthened. Based on the research conclusions, the policy implications of this article for the development of tourism in the 3 regions are obvious. In the future, the eastern coastal region should pay attention to the technical training of practitioners, improve the absorptive capacity of knowledge and the potential energy of innovation development, and avoid the problem of technology waste in the process of enterprise operation. There is still room for improvement in scale efficiency in the central and western China. The overall tourism development efficiency of the central and western China can be improved by adjusting the industrial layout and structure and reasonably expanding the scale of the tourism industry. In particular, the western region should focus on the promotion of information technology consumption for the economic efficiency of tourism.
A conceptual model of non-work travel group profile for urban residents is proposed in this paper, and a sequential combination of correlation coefficient matrix and two-step clustering method is applied to constructing the non-work travel group profiles. In the case study, using Suzhou mobile phone signaling data, the urban travelers are grouped based on spatiotemporal non-work travel information and social attributes. Combined with the conceptual model of non-work travel group profile, a detailed discussion on the group profiles of different types of non-work travelers is given. Results show that the urban travelers can be divided into two groups: active-fluctuating-workday oriented group and inactive-stable-balanced group. Significant differences exist in multi-dimensional features among different types of non-work travel group profiles. The association analysis of group profile labels shows that, in addition to the explicit association, there are implicit associations between different labels of group profile.
The geographical mismatch between the supply and demand sides of water and energy is severe in China, two kinds of resources circulate between provinces and sectors in physical form or through products and services. Two kinds of resources consume each other, and the complicated interweave relationship increases the difficulty of resource management. Based on the three-scale embodied resource intensity, this paper calculated embodied resources circulation between different countries (regions) and China, as well as between provinces in China, quantified the mutual consumption of water and energy from the perspective of trade, depicted the source-to-sink flow characteristics of water and energy in China from the natural world to the final use, and analyzed the embodied resources in the final use from the perspective of provinces. The results showed that: 1) Virtual water was in the state of net outflow in China, the international virtual water trade has increased pressure on China’s water. The international energy trade offset one-third of the net exported virtual water, and alleviated China’s water resource pressure. 2) Embodied energy was in the state of net import in China, the international energy trade has alleviated pressure on China’s energy. The international water trade has increased the pressure on energy use in China, but the impact was relatively weak. 3) Virtual water entered the socioeconomic system mainly through the agricultural and manufacturing sectors, embodied energy entered the socioeconomic system mainly through the mining and manufacturing sectors, urban living consumption and fixed capital formation were two main forms of consumption of virtual water and embodied energy, with values of 173.54 billion m3 and 211.72 billion m3, 6.25×10⁷ TJ and 2.73×10⁷ TJ, respectively. 4) The total final used water-induced energy in all provinces in China was 8.73×10⁶ TJ, accounting for 3.27% of the total embodied energy, and was lower than the proportion of energy-induced water in virtual water (9.63%). The inter-provincial trade of energy is more active than water, water consumption of energy plays a leading role in the water-energy nexus.
The super-efficiency SBM model and panel regression model are introduced to explore the relationship between innovation cooperation of different spatial scales and urban innovation performance in the Yangtze River Delta region from 2001 to 2018. The research shows that: 1) The innovation performance of the Yangtze River Delta generally shows an upward trend, but the overall level is not high. The high-value areas of innovation performance are mostly concentrated in the Shanghai-Nanjing-Hefei-Hangzhou-Ningbo development zone and its adjacent areas. By 2018, 22% of cities had an innovation performance index above 0.8657, and 63% of cities still had an innovation performance index below 0.4491. 2) Among cities with different administrative levels, the order of positive effects of the cooperation of all spatial scales on the innovation performance of high hierarchy cities is: Outside-region innovation cooperation, inside-region innovation cooperation and local innovation cooperation, while the order of positive effects on the innovation performance of general hierarchy cities is: Outside-region innovation cooperation, local innovation cooperation and inside-region innovation cooperation. 3) In high hierarchy cities, local innovation cooperation and innovation cooperation outside the region weaken each other’s positive impact on innovation performance, and the balance between the two is conducive to improving urban innovation performance; Local innovation cooperation and regional innovation cooperation also weaken the positive impact of each other on innovation performance, and the balance of the two can also improve the innovation performance of cities. 4) In general hierarchy cities, local innovation cooperation and innovation cooperation outside the region weaken each other’s positive influence on innovation performance, and the balance between them has no significant influence on innovation performance; Local innovation cooperation and regional innovation cooperation has no significant Impact on Innovation performance due to the change of the other party,and the balance between them has no significant impact on innovation performance. Therefore, the following suggestions are put forward: Accelerate the innovation cooperation of multiple spatial scales in the Yangtze River Delta region, and pay attention to the influence of the relationship between innovation cooperation of different spatial scales on urban innovation performance.
Taking the Henan-Shaanxi-Hubei junction area as the research object, this paper measured the comprehensive development level of the counties in the Henan-Shaanxi-Hubei junction area from 2000 to 2017, and analyzed its spatial differentiation characteristics, evolutionary trends and obstacles. The results show that: 1) From 2000 to 2017, the comprehensive development level of the counties in the ??Henan-Shaanxi-Hubei junction area gradually improved, with an average annual growth rate of 6.08%, and the spatial difference between the county-level development gradually increased; 2) The comprehensive development level of counties showed a positive spatial correlation. The significant hotspot areas migrated from the southeast to the southwest and then to the southeast. The significant coldspot areas were mainly distributed in Ankang and Shangluo before 2005, and then mainly concentrated in Nanyang. 3) The humanistic and economic factors are at moderate to high barrier levels, while resources and environmental factors are at extremely low and low barrier levels; with the passage of time, the spatial resistance differentiation of obstacle factors in different counties became more significant. 4) The spatial resistance patterns of county development in the Henan-Shaanxi-Hubei junction area can be divided into 3 types, among which the low economic development level-human resource element restriction type is the main spatial resistance pattern, and on the basis of analyzing the characteristics of different spatial resistance patterns, a regional development strategy is proposed.
Based on the cross-national, cross-regional and regional enterprises’ nonlocal investment data in the Yangtze River Delta (YRD) and applying the social network analysis, panel vector auto regression and geographically weighted regression, this paper reveals the spatial evolution characteristics and interaction effects of the YRD’s multi-scalar urban networks. The results are obtained as follows: Global, national, and regional urban networks in the YRD are in the preliminary, steady, and perfect development stages. Besides, the YRD’s multi-scalar urban networks tend to be regionalized: On a global scale, a dense regional network is gradually forming between the YRD and East Asia, Western Europe, and North America; on a national scale, the connectivity between the YRD and Beijing-Tianjin-Hebei and the Pearl River Delta becomes closer; on a regional scale, there are closer economic ties within the provinces compared with trans-provincial economic ties. Additionally, the network spatial structure dominated by the Shanghai-Nanjing-Hefei-Hangzhou-Ningbo development corridor is forming. When it comes to the interaction effects of the YRD’s multi-scalar urban networks, there is a mutual promotion relationship between the global and national functional connectivity. The improvement of the city’s regional functional connectivity can promote its integration into the global and national urban networks. However, the improvement of the city’s global and national functional connectivity cannot promote its further integration into the YRD’s regional urban network, and its integration into the global urban network even has a significant inhibitory effect on the city’s regional functional connectivity. Furthermore, obvious spatial heterogeneity of interaction effects can be observed, which is coupled with regional economic development patterns.
Based on finance, information and traffic flow, the urban network structure of the Yellow River Basin is analyzed from the perspective of hierarchy, pattern, direction and influencing factors by using social network analysis method. The results show that: 1) There are significant regional differences in the centrality of the urban network based on various factor flows in the Yellow River Basin. The traffic network has the largest difference and the most concentrated size distribution, and the traffic development of small and medium-sized cities in the western China lags behind. The difference of information network is relatively small and the centrality of cities with large population or rich tourism resources is relatively high. The financial network has the smallest difference and the most decentralized size distribution, and the eastern region has the most significant overall advantage. 2) The backbone financial network has connected the central cities of the basin and the cities of Shandong and Henan, forming a diamond network; the backbone information network appears as several star clusters with the provincial central cities as the core; the backbone traffic network is composed of several groups with the traffic trunk as the axis, and the backbone networks are all centered on Xi'an, Zhengzhou and Jinan. 3) The preferential attachment and geographic proximity interactions are important mechanisms in the development of basin urban network. The financial network is absolutely dominated by the preferential attachment; the information network is also dominated by the preferential connection, but it shows certain geographical proximity features in Shandong and Henan; while the transportation network is dominated by the geographical proximity interaction, forming several traffic sub-centers. 4) The level of globalization, administrative hierarchy and government functional transformation, and provincial boundary barriers are the main factors influencing the urban network spatial structure in the Yellow River Basin.
This article selects data from Hong Kong, China during the period of 1997-2019. The antecedent and consequential conditions are analyzed by using the qualitative comparative analysis (QCA) to determine the path of inbound and outbound tourism flow. The research results are as follow: 1) In terms of the number of paths, although it is continuously simplified, it is still complex; 2) In terms of core conditions, all single factors do not constitute core conditions of influence, and the pathways of Hong Kong’s inbound and outbound tourism flows are affected by a combination of multiple factors; 3) In terms of antecedent conditions, there are differences in the impact of IRRIF, with the hard power relationship playing a dominant role in high inbound and outbound tourism flows and the soft power relationship playing a greater role in non-high inbound and outbound tourism flows; 4) Among the path countries/regions, there are significant regional differences between high and non-high inbound and outbound tourism flows; 5) At the temporal level, the paths of stage 1 are quite different from those of stage 2 and stage 3, indicating that the segmentation events of time nodes have different impact on inbound and outbound tourism in Hong Kong, China.
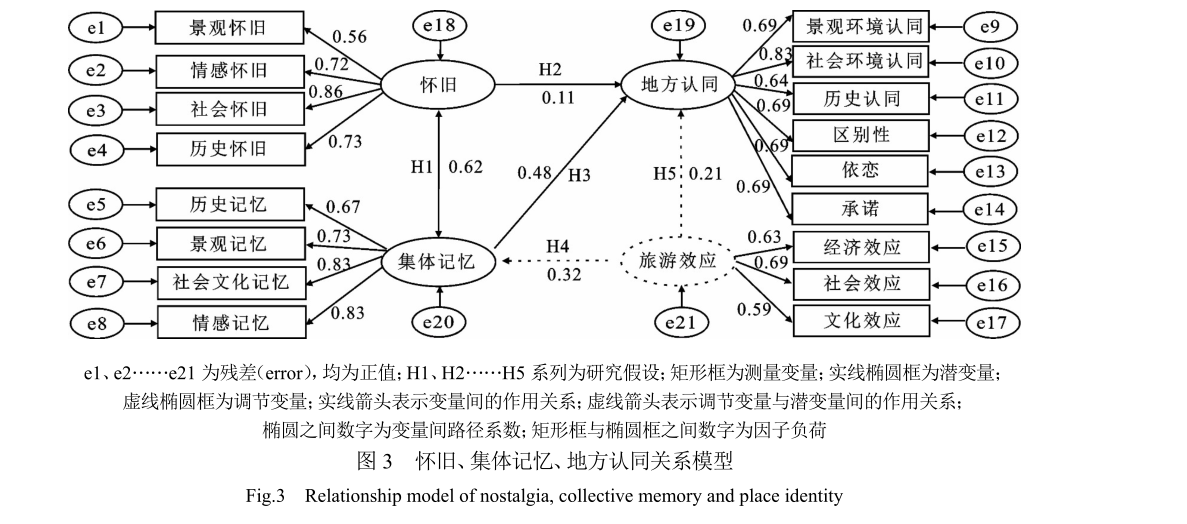
The emotional sustenance of rural residents is an important reference for the development quality of rural revitalization and rural tourism in China. The evolution of tourism landscape also provides a new perspective for the study of rural residents’ emotion and memory. Taking Huhhot Naobao village in Inner Mongolia as a case, this paper discusses the residents’ nostalgic, collective memory and place identity by means of experiment and questionnaire survey. The structural equation model is used to verify the internal interaction mechanism among the nostalgia, collective memory and place identity of residents in the online populartourism village under the effect of tourism. In the context of the integration of non-indigenous tourism landscape into local tourism communities, the research shows that: Residents still identify with the current landscape and architecture strongly, and maintain a positive attitude towards tourism development; If nostalgia and collective memory lose their material carrier, they will be concentrated on the cultural carrier performance. The evolution of tourism landscape does not cut off residents’ collective memory of former villages, but the tourism effect brought by tourism landscape optimization weakens residents’ nostalgic feelings. Residents’ nostalgia has a significant positive correlation with collective memory, residents’ collective memory has a significant positive impact on place identity, and tourism development has a significant positive impact on collective memory and place identity. This paper provides a theoretical reference for the development model of rural tourism and the reconstruction of rural tourism landscape under the strategy of rural revitalization.
The Songze culture period (6 000-5 300 a B. P.) in the lower reaches of the Yangtze River is a key stage of the origin civilization. However, whether the economic society of rice farming had been formed in this period and its influencing mechanism behind it remain unclear. Through systematic archaeobotanical analysis at Qingchengdun site in Changzhou, 131 carbonized rice seeds and 2 262 rice spikelet base were found in 22 of 24 flotation samples. The results indicated that the agricultural economy of the ancestors of Qingchengdun site during the Songze culture period was mainly based on rice planting. Combined with previous archaeobotanical work, it is found that the main subsistence economy of human beings during the Songze culture period in the lower reaches of the Yangtze River was a rice farming agricultural economy based on planting rice, supplemented by a gathering economy based on collecting wild plant resources such as gourd (Lagenaria siceraria), Semen Euryales (Euryale ferox), peach (Prunus persica) and muskmelon (Cucumis melo). After 7 000 a B. P., the slow rise of sea level and the eastward withdrawal of coastline provided a large number of living environments for ancient humans carrying out rice agricultural production. The suitable relatively warm and humid climate conditions in this period also provided suitable habitat conditions for rice agricultural production. The pressure of population growth after 6 000 a B. P. is the reason why ancient humans in the lower reaches of the Yangtze River chose stable and high-yield rice agriculture as the main subsistence strategy.
This study selected surface water (reservoir water, river water) and groundwater in the middle reaches of the Heihe River Basin as the research objects, and comprehensively used descriptive statistics and Piper triangle diagrams, Gibbs diagram, ion correlation and other methods to systematically analyze the water chemistry type, main ion composition and control factors. The results showed that: 1) In 2005-2013, the Total dissolved solids (TDS) of groundwater increased significantly, while the TDS of surface water (river water and reservoir water) decreased. Meanwhile, the TDS of groundwater was significantly higher than that of surface water. 2) At the interannual scale, groundwater ion concentrations increased significantly with time, while river water and reservoir water ions showed a decreasing trend. At the annual scale, NO3? ion concentration in groundwater was significantly higher in August than that in May, while Ca2+, K+, SO42? ion concentration in river water was higher in August than that in May, and all ion content in reservoir water was higher in May. 3) In 2005-2013, the hydrochemical types of surface water and groundwater changed significantly: the hydrochemical type of surface water changed from HCO3?-SO42?-Ca2+-Mg2+ to HCO3?-Ca2+-Na+ in 2005-2009, reservoir water changed to HCO3?-SO42?-Ca2+-Mg2+ , and river water changed to HCO3?-SO42?-Ca2+-Na+; groundwater hydrochemical type changes from HCO3?-SO42?-Ca2+-Mg2+ type to SO42?-HCO3?-Ca2+-Na+-Mg2+ type; surface water and groundwater HCO3?, SO42?, Mg2+ had the largest coefficient of variation, and were the most important sensitive ions that change with environmental factors; 4) The Gibbs diagram showed that surface water and groundwater ions mainly came from rock weathering, the weathering and dissolution of carbonate or silicate minerals such as calcite and dolomite were the main sources of ions in this area, and the irrigation and fertilization of farmland at the edge of oasis were the main reasons for the significant increase of SO42? and NO3?.
The low mountain and hilly areas in Northeast China are important grain producing areas and commercial grain bases. High-intensity agricultural cultivation has caused serious soil erosion and increasing erosion ditch hazards. An area of 106.5 km2 in the upper reaches of the East Liaohe River was selected as the study area, and the geometric parameters and latitude and longitude of erosion ditches with length ≥ 50 m and depth ≥ 0.5 m in the study area were verified and measured in the field based on the remote sensing images with 2 m resolution and manual prediction of erosion ditches by GIS. Based on DEM, the spatial information of slope gradient, slope aspect and elevation of erosion gullies was obtained; the basic characteristics and spatial and temporal evolution trends of erosion gullies in the study area were analyzed, and the influence of slope gradient and slope aspect on the development of erosion gullies was discussed. The results show that: 1) There are 322 erosion gullies in the study area, with a distribution density of 3.0 gullies /km2, a gully density of 0.8 km/km2, and a fragmentation degree of 1.4%. The development of erosion gullies is fast, and the intensity of gully erosion has reached an intense degree, which should be paid enough attention to. 2) Erosion gullies are mainly distributed on sloping arable land from 6° to 9°, the influence of slope gradient on gully erosion is obvious, and the high-intensity reclamation of sloping arable land is the main driving force for the increase of gully erosion. 3) There are more erosion gullies on the sunny slope (S, E, etc.), and least erosion gullies on the shady slope (N). Slope aspect also has a certain influence on gully erosion. The research results provide scientific data for understanding the occurrence and evolution of erosion gullies in low mountain and hilly areas of Northeast China.
Under the background of global climate change, human activities have intensified the occurrence of extreme climate events, increased the possibility of grassland fire, and seriously threatened these curity of terrestrial ecosystem and people’s life and property. The Hulunbuir grassland as a border zone of China, Mongolia, and Russia, so the study of spatial and temporal distribution pattern and influencing factors of grassland fire is of great significance to the management and prevention and control of grassland fire in our country. In this study, Fire_CCI51 was used as the main data source, and GIS spatial analysis technology was applied to explore the spatial and temporal distribution of grassland fires in Hulunbuir region from 2001 to 2019. The results show that there has the randomness of large interannual fluctuations and indefinite cycles and the regularity of bimodal concentration in spring and autumn; the spatial distribution is concentrated in the eastern forests and grasslands and near the border line , shows a pattern of more east and less west, more north and less south. In order to explore the influence of meteorological factors on grassland fire in HulunBuir grassland, this study conducted an in-depth analysis of relationship between major meteorological factors and grassland fires by using correlation analysis method. It was found that there was no significant correlation. Therefore, this paper makes a statistical analysis of the causes of grassland fires, and finds that human activities are the main cause of grassland fires. In addition, the spatial analysis is used to extract the burn area in boder area and buffer zone, and found that there are far more fires outside than inside and Russia has far more fires than Mongolia or China. In view of junction environment is not very different, this study conducts a comparative analysis of the different grassland management and prevention and control policies in China, Mongolia and Russia, and finds that China’s policy is more strict and perfect, and has more advantages in border fire prevention and control. Therefore, the study believes that the local government should urge herdsmen to mow the grassland in time, focus on human activities in pastoral areas, and strictly manage anthropogenic fire sources, rationally allocate prevention and control forces, focusing on forest-steppe zone and border zone. At the same time, China’s prevention and control experience should also be shared with neighboring countries to promote joint prevention and control in border areas.
The Qinghai-Tibetan Plateau is the major region covered by permafrost in the middle and low latitudes of the world. The change in permafrost has a significant impact on the hydrological processes and ecological environment on the Qinghai-Tibetan Plateau. In this study, the distribution of frozen soil and active layer thickness (ALT) of permafrost are simulated using the temperature at the top of permafrost (TTOP) model and the Stefan formula, which based on the moderate-resolution imaging spectroradiometer (MODIS) land surface temperature, and the results are compared with the ground observations. The results show that the estimated spatial distribution of permafrost is close to the map of permafrost proposed in previous studies. The ALT of permafrost estimated by MODIS land surface temperature data using Stefan formula has certain accuracies. However, there are some differences between the estimated ALT and observations in the region near the Qinghai-Tibet Highway possibly due to the human activities. The area of permafrost on the Qinghai-Tibetan Plateau is estimated to be about 1.01× 10⁶ km2 in the period from 2003 to 2019; the regional averaged ALT on the Qinghai-Tibet Plateau is 1.79 m, and the change rate of ALT on the Qinghai-Tibet Plateau is estimated to be 3.67 cm/10a. The changes in the ALT show differences among different vegetation types. The change rate in meadow area is significantly higher than that in grassland area. The change rate also varies along different elevation intervals. From 4 100 m to 5 700 m, the change rate of ALT first increases and then decreases, and the change rate of ALT shows the largest value in the 5 100-5 300 m elevation intervals. The simulated frozen soil distribution and ALT in this study can provide valuable data support for the study of permafrost in the Qinghai-Tibetan Plateau and may deepen our understanding of the characteristics and changes in permafrost in the Qinghai-Tibetan Plateau.